Positive Tone; More Modest Expansion
Our proprietary “Beige Book Barometer” ticked up to +66 in March 2013 (from +56 in January 2013), continuing the rebound from a Superstorm Sandy-related dip to +30 in November 2012. Despite the post-Sandy bounce, our Barometer remains well below its recent high of +101, hit in April 2012, and describes an economy that is growing — but only  modestly. The improvement in our Barometer since November 2012 has come as the number of positive words in the Beige Book surged to a nine-month high. The number of negative words ticked up slightly between the January and March 2013 Beige Books, but remains well below the levels seen just after Superstorm Sandy hit.
Our Barometer, a diffusion index that measures the number of times the word “strong” or its variations (stronger, strength, strengthen, etc.) appear in the Beige Book less the number of times the word “weak” or its variations (weaken, weaker, etc.) appear, is displayed in Figure 1. The barometer is an effective, quantitative way to derive the shades between strong and weak in the predominately qualitative Beige Book report.
Still Bouncing Back From the Fiscal Cliff and Sandy
When we wrote about the Beige Book in early December 2012, we noted that despite the tepid reading of our Barometer in November 2012 (+30), there was some reason for modest optimism on the economic outlook. First, the Barometer generally suggested the economy was stronger during the summer and early 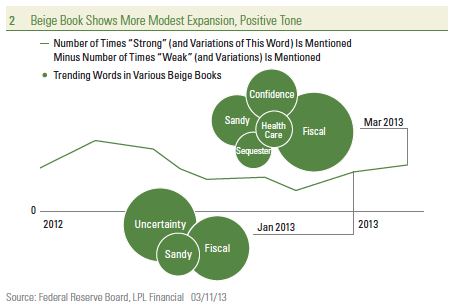 fall of 2012, prior to the impact of Superstorm Sandy and uncertainty ahead of the fiscal cliff than it was in early 2011, before the bruising debt ceiling debate. In addition, we noted that many of the factors that weighed on our Barometer in November 2012 appeared to be temporary. Indeed, with key indicators like consumer sentiment hitting a five-year high, a sustainable housing recovery in place, and the private economy adding more than 200,000 jobs per month in four of the past five months, the U.S. economy is now on a firmer footing than it was in the summer and fall of 2011. A big driver of the uncertainty in the November 2012 Beige Book was Superstorm Sandy, which had 48 mentions, and virtually all of the mentions were associated with disruptions to economic activity.
In contrast, nearly every one of the 25 mentions of Sandy in January 2013 and all but one of the 11 mentions in the March 2013 edition of the Beige Book was associated with a rebound in, or resumption of, economic activity that was disrupted by the storm in late 2012. Because of the timing of the collection of comments for the January 2013 Beige Book (comments 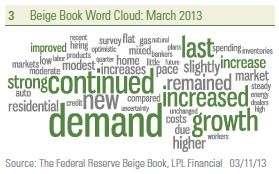 from contacts in the business and banking community were collected throughout December 2012 and in the first few days of January 2013), we noted that the Beige Book likely overstated the impact of the fiscal cliff on economic activity in early 2013. Indeed, there were 38 mentions of the word “fiscal” in the January 2013 Beige Book, and almost every mention was accompanied by a word like “uncertainty.” Clearly, the uncertainty was a drag on economic activity among consumers and businesses alike as 2012 drew to a close.
The word “fiscal” appeared just 17 times in the March 2013 Beige Book, and almost all of them were used in a negative context. Looking ahead, the word “sequester” (across the board federal spending cuts that began to go into effect on March 1, 2013) is likely to make a prominent appearance in the next several Beige Books. However, with the debt ceiling debate and possible government shutdown now pushed back until August or September 2013, fiscal uncertainty outside of the impact of the sequester may fade in upcoming Beige Books. The rebound from Sandy will also likely fade in the coming months, although rebuilding from the storm may take years.
While the fiscal cliff debate and the sequester — along with the impact of Sandy may be temporary, though significant — other more persistent factors have weighed on the Barometer since it peaked in April 2012. The ongoing recession in Europe, the economic slowdown in China, the severe damage to the agricultural economy as a result of the drought, and a return to “normal” weather all helped to push the Beige Book Barometer down from +101 in April 2012 to around +50 over the summer and early fall of 2012.
As we expected, the uncertainty surrounding the fiscal cliff and the disruptions caused by Sandy have reversed in recent Beige Books, and our Barometer has returned to the +60 range seen over the spring and summer of 2012. A quick look at Figure 1, however, reveals that our Barometer remains below the range seen in 2005 and 2006, the years just prior to the Great Recession. In short, the Barometer is consistent with other more quantitative metrics on the U.S. economy that suggest that the economy rebounded from the impact of Sandy in early 2013, but is still not back to “normal,” where normal is defined as the pre-Great Recession years of 2005 – 2006, where real gross domestic product (GDP) growth averaged between 2.5% and 3.0%.
Word Clouds Show Modest Expansion
The nearby word clouds are dominated by words describing the tone of the economy when the Beige Books were published.  Below are some observations on the current Beige Book (released on March 6, 2013) relative to other recent editions of the Beige Book.
- The economy continued to expand at a “modest to moderate pace” in February and early March 2013. Although the Beige Book corroborates other, more quantitative evidence that the economy is expanding modestly, it is not doing so at a pace that would concern the Federal Reserve that there is upward pressure on wages or prices, which in turn might cause the Fed to slow down or stop its latest round of quantitative easing. The latest Beige Book described wages pressures as “mostly limited” and pricing pressures as “modest.”
- In the Beige Books released in late November 2012 and early January 2013, economic uncertainty surrounding the fiscal cliff and the rebound from the economic disruption wrought by Superstorm Sandy dominated. There were 43 mentions of “uncertainty,” 25 of “Sandy,” and 38 of “fiscal” in the January 2013 Beige Book, and 26 mentions of “uncertainty,” 48 of “Sandy,” and 15 of “fiscal” in the November 2012 Beige Book. In the latest Beige Book, there were just 26 mentions of “uncertainty,” only 11 of “Sandy,” and just 17 of “fiscal.” While the battle over the sequester (and impact on the economy) is likely to begin appearing in the Beige Books released over the next few quarters, all of these words will likely fade as concerns. However, the debt ceiling debate is likely to heat up again in mid-to-late summer 2013, and could once again return fiscal uncertainty to the pages of the Beige Book.
- The word “confidence” appeared 11 times in the latest Beige Book. However, unlike in 2011 and most of 2012, when the word was used in a negative context (i.e., lack of confidence, weak confidence), nine of the 11 mentions in the latest Beige Book were in a positive context. Thus, over the past few Beige Books since Superstorm Sandy, business and banking contacts have generally seen increased confidence in the recovery, especially in housing. This suggests that a sustained, multiyear recovery in the housing market is likely underway.
- Health care, health insurance, and the Affordable Care Act (ACA) were mentioned a total of 15 times in the latest Beige Book, up from eight mentions in the January 2013 Beige Book. In contrast, those words were found just three times in the Beige Book released a year ago (February 2012). We will continue to monitor these health care words closely in the upcoming Beige Books, as the economy continues to adjust to the impact of the ACA.
- In the Beige Book released in January 2013, China received no mentions, marking the first time since early 2012 that China was not mentioned by business and banking contacts. In the March 2013 edition, China had six mentions, many related to the timing of the Chinese Lunar New Year in 2013 (February) versus 2012 (January). Over the course of 2012, the financial media was chock full of stories on the economic slowdown in China and the recession and debt crisis in Europe. The Beige Book suggests that while those issues have not entirely disappeared from Main Street’s radar, they are far less of a concern than the media makes them out to be. Indeed, the last time China warranted as many as six mentions was in January 2012, as fears of a “hard landing” in China began to gather steam. The Chinese economy appeared to have bottomed out in late 2012, avoiding a “hard landing.” The recent data suggest that China’s economy is re-accelerating as 2013 begins, although, as the Beige Book points out, the timing of the Lunar New Year this year, which can impact economic data, is making it difficult to draw any conclusions about the health of the Chinese economy right now.
- Despite the recent flare-up in Europe, related to the lack of a clear winner in the Italian presidential elections, there were only six mentions of Europe in the latest Beige Book, down from eight in January 2013’s Beige Book. The six mentions in March’s Beige Book were well below the 15 – 20 mentions seen in the summer and fall of 2012, as Europe struggled through elections in Greece and increased fears of a break-up. Not surprisingly, nearly all of the mentions of Europe in the latest Beige Book were in a negative context. Perhaps business and banking contacts on Main Street are not as exposed to Europe as some of the larger businesses and financial institutions on Wall Street that dominate media coverage. But it is also worth noting that the European debt crisis is in its fourth year, and Main Street may be getting used to it now.
_______________________________________________________________________________________IMPORTANT DISCLOSURES
The opinions voiced in this material are for general information only and are not intended to provide specific advice or recommendations for any individual. To determine which investment(s) may be appropriate for you, consult your financial advisor prior to investing. All performance reference is historical and is no guarantee of future results. All indices are unmanaged and cannot be invested into directly.
Gross domestic product (GDP) is the monetary value of all the finished goods and services produced within a country’s borders in a specific time period, though GDP is usually calculated on an annual basis. It includes all of private and public consumption, government outlays, investments and exports less imports that occur within a defined territory.
The economic forecasts set forth in the presentation may not develop as predicted and there can be no guarantee that strategies promoted will be successful.
Stock investing involves risk including loss of principal.
The Federal Open Market Committee action known as Operation Twist began in 1961. The intent was to flatten the yield curve in order to promote capital inflows and strengthen the dollar. The Fed utilized open market operations to shorten the maturity of public debt in the open market. The action has subsequently been reexamined in isolation and found to have been more effective than originally thought. As a result of this reappraisal, similar action has been suggested as an alternative to quantitative easing by central banks.
The Federal Open Market Committee (FOMC), a committee within the Federal Reserve System, is charged under the United States law with overseeing the nation’s open market operations (i.e., the Fed’s buying and selling of United States Treasure securities).
_______________________________________________________________________________________INDEX DESCRIPTIONS
Purchasing Managers Index (PMI) is an indicator of the economic health of the manufacturing sector. The PMI index is based on five major indicators: new orders, inventory levels, production, supplier deliveries and the employment environment.
The Consumer Price Index (CPI) is a measure of the average change over time in the prices paid by urban consumers for a market basket of consumer goods and services.
_______________________________________________________________________________________ This research material has been prepared by LPL Financial.
To the extent you are receiving investment advice from a separately registered independent investment advisor, please note that LPL Financial is not an affiliate of and makes no representation with respect to such entity.
Not FDIC/NCUA Insured | Not Bank/Credit Union Guaranteed | May Lose Value | Not Guaranteed by any Government Agency | Not a Bank/Credit Union Deposit
_______________________________________________________________________________________
Stay Connected with Us!


Leave a comment