This week, markets digest a variety of reports on the U.S. economy in February, March, and April 2013. Of particular interest to market participants will be the reports on producer prices and retail sales for March — both due out on Friday, April 12. The Consumer Price Index (CPI) is due out next Tuesday, April 16, 2013. The price of gasoline will feature prominently in all three reports. This time of year, gasoline prices typically garner plenty of attention from the media with the approach of the unofficial summer driving season right around the corner. Readers often want to know:
- How have gasoline prices behaved thus far in 2013, and what might they do in the months ahead?
- How much gasoline do we use in the United States?
- How big an influence do gas prices have on consumer spending and the overall economy?
How Have Gasoline Prices Behaved So Far in 2013?
Gasoline prices are a product of global oil prices, federal, state, and local taxes, the cost of transporting the gasoline from refinery to filling station, and marketing costs. Prices can vary widely from region to region within the United States, and all prices in this report reflect the national average retail price for gasoline. Refinery shutdowns, refinery capacity, and differences in transportation and pipeline costs account for the U.S. regional differences in gasoline prices. In the latest week, retail gasoline prices were $3.65 per gallon, and have declined by 20 cents per gallon over the past six weeks. While retail gasoline prices have increased by 28 cents per gallon this year, they remain 51 cents per gallon below the all-time high set in July 2008 at $4.16 per gallon. In a typical year, gasoline prices rise from January through the end of May, hit a plateau in the summer driving months of June, July, and August, and prices decline from the beginning of September through year-end. Figure 1 shows that the price increase in gasoline in the first two months of 2013 was steeper than usual, but here in early April, the year-to-date price rise in gasoline prices has been more muted than usual. Wholesale prices can often provide a window into what gasoline prices at the retail level will look like in a few weeks. Like gold, silver, copper, corn, wheat, etc., wholesale gasoline trades on commodity exchanges. Prices in the wholesale market have dropped 51 cents per gallon since mid February 2013, suggesting that the retail price is poised to drop by another $0.30 – 0.35 cents per gallon in the coming weeks, barring any major refinery outages or other disruptions. Wholesale gasoline prices are driven by global oil prices and supply and demand in the market place for gasoline from retail consumers, businesses, and government.

How Much Gasoline Does the United States Use?
Each week, the Department of Energy produces the Weekly Petroleum Status Report (WPSR). The report has a variety of information on the nation’s petroleum industry, including production, inventories, imports, exports, and prices. A key statistic in that report is the “gasoline supplied” figure, a good proxy for gasoline use (by all end users — consumers, businesses, industry, and government). On balance, the data reveals that the United States is using far less gasoline today than it did in 2007 [Figure 2]. In the last week of March 2013, the nation used 8.5 million barrels of gasoline per day, down 1 million barrels per day from the peak in January 2007, when the economy used 9.5 million barrels of gasoline per day. A combination of slowing economic growth, a slight increase in fuel economy among the nation’s vehicle fleet, and a sharp slowdown in miles driven (in part driven by an aging population) has helped to curtail U.S. gasoline use.

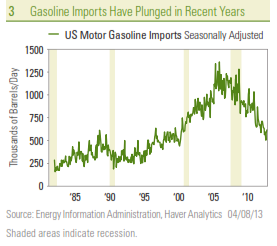
Gasoline imports (and exports) are also captured in the WPSR [Figure 3]. In March 2013, gasoline imports were around 600,000 barrels per day, levels not seen since the early 2000s. Some of the drop in imports in recent years is due to environmental standards and ethanol mandates, but our reliance on foreign gasoline is waning. Still, the vast majority (95%) of the gasoline we use is produced domestically.
Gasoline carries a weight of 5.5% in the CPI, an 8% weight in the Producer Price Index (PPI), and sales at gasoline service stations account for about 11% of retail sales. Although gasoline represents only a small portion of the most widely watched price indices and measures of consumer spending, spending on gasoline and gasoline prices garner plenty of attention in the media and from politicians. Why? Gasoline is one of those items (like groceries) that consumers see the price of almost every day, and most of us fill up our gas tanks regularly. Even small changes in gasoline prices can elicit plenty of news coverage and consumer backlash.
How Much Does Gasoline Influence Consumer Spending and the Overall Economy?
What consumers spend on gasoline is carefully measured by the U.S. Commerce Department’s personal income and spending report released each month. The last report (for February 2013) was released on March 28, 2013. This report revealed that consumers spent an annualized $431 billion on gasoline in February 2013. This was equal to 3.8% of total consumer spending ($1.1 trillion) in February 2013, and 3.2% of personal income ($1.4 trillion). At the peak of oil prices in 2008, 4.3% of U.S. consumer spending

went to gasoline, and gasoline purchases were 3.2% of personal income. Both of these figures were well below the all-time peaks on these metrics hit during the early 1980s [Figure 4]. Another surge in energy prices relative to consumer income and spending remains a threat to the health and longevity of the current expansion, which will turn four years old in June 2013.

To put economy-wide gasoline use in perspective, in 1991, the U.S. economy used 7 million barrels per day of gasoline and produced gross domestic product (GDP) of $5.9 trillion, or put another way, produced $2,288 of GDP per gallon of gasoline used. In the first quarter of 2013, the U.S. economy used 8.7 millions of barrels of gasoline per day and produced $16 trillion in GDP, as the economy produced $5,036 in GDP for every gallon of gasoline used. Thus, looking back over the past 20-plus years, the U.S. economy’s output has nearly tripled, as gasoline usage increased by just 22%. In short, the U.S. economy has become much more gasoline efficient in the past 20 years, and this trend has been in place since the late 1970s/early 1980s [Figure 5]. Still, even with the emerging energy renaissance now underway, it may be years, or even decades — if ever — where the average U.S. consumer does not know (or care) what a gallon of gasoline costs.

_________________________________________________________________________
IMPORTANT DISCLOSURES
The opinions voiced in this material are for general information only and are not intended to provide specific advice or recommendations for any individual. To determine which investment(s) may be appropriate for you, consult your financial advisor prior to investing. All performance reference is historical and is no guarantee of future results. All indices are unmanaged and cannot be invested into directly.
The economic forecasts set forth in the presentation may not develop as predicted and there can be no guarantee that strategies promoted will be successful.
Gross Domestic Product (GDP) is the monetary value of all the finished goods and services produced within a country’s borders in a specific time period, though GDP is usually calculated on an annual basis. It includes all of private and public consumption, government outlays, investments and exports less imports that occur within a defined territory.
Stock investing involves risk including loss of principal.
Commodity-linked investments may be more volatile and less liquid than the underlying instruments or measures, and their value may be affected by the performance of the overall commodities baskets as well as weather, disease, and regulatory developments.
The fast price swings in commodities and currencies will result in significant volatility in an investor’s holdings. Job Openings and Labor Turnover Survey (JOLTS) is a survey done by the United States Bureau of Labor Statistics to help measure job vacancies. It collects data from employers including retailers, manufacturers and different offices each month. Respondents to the survey answer quantitative and qualitative questions about their businesses’ employment, job openings, recruitment, hires and separations. The JOLTS data is published monthly and by region and industry.
______________________________________________________________________________________
INDEX DESCRIPTIONS
Producer Price Index is an inflationary indicator published by the U.S. Bureau of Labor Statistics to evaluate wholesale price levels in the economy.
The Consumer Price Index (CPI) is a measure of the average change over time in the prices paid by urban consumers for a market basket of consumer goods and services.
______________________________________________________________________________________
This research material has been prepared by LPL Financial.
To the extent you are receiving investment advice from a separately registered independent investment advisor, please note that LPL Financial is
not an affiliate of and makes no representation with respect to such entity.
Not FDIC/NCUA Insured | Not Bank/Credit Union Guaranteed | May Lose Value | Not Guaranteed by any Government Agency | Not a Bank/Credit Union Deposit

Leave a comment