What We Spend on Health Care
This week, health care is likely to be in the news as a key component of the 2010 Affordable Care Act (ACA). Enrollment for individuals seeking insurance coverage takes effect on October 1, as members of Congress continue to debate the merits (and funding) of the law as part of the discussion around providing funding for the federal government. We’ll leave the pros and cons of the ACA to the politicians and pundits and focus instead on the size and scope of the health care sector in the U.S. economy. In future Weekly Economic Commentaries, we’ll explore the impact of health care on the labor market, various segments of the economy, the federal budget, inflation, and the impact of demographics on health care spending. On balance, how we (as individuals and as an economy) consume, pay for, and manage the cost of health care will play a crucial role not only in the economy, but in the federal budget in the years and decades to come.
How We’re Covered
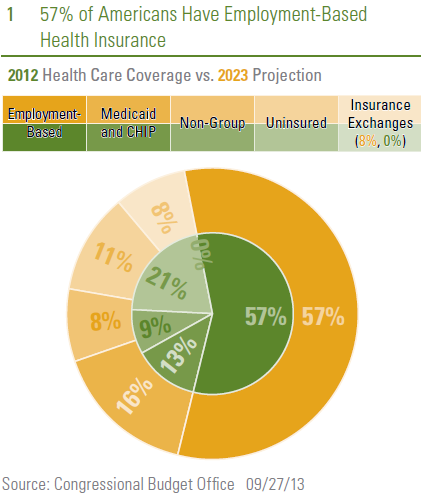
Most, though not all, of the spending patterns discussed below are driven by what type of health insurance, if any, individuals have. Using data compiled by the non-partisan Congressional Budget Office (CBO), which assigns people to their primary source of insurance (many people have multiple sources of insurance, especially those eligible for Medicare who also purchase additional insurance), we find that 156 million people (or 57% of the non-elderly population) have employment-based health insurance. By 2023, the CBO projects that this figure will increase to 162 million but will remain at 57% of the non-elderly population. At 57 million, or 21% of the non-elderly population, the uninsured made up the second-largest portion of the population in 2012. The CBO projects that under current law, the number of uninsured will drop to 31 million or 11% of the non-elderly population by 2023. More people are likely to move onto Medicaid and to the government-run health insurance exchanges as prescribed by the ACA while those purchasing non-group insurance will remain roughly steady at 8% of the non-elderly population. This potential shift in how Americans purchase health insurance has major implications for the overall economy and the outlook for the budget, which we’ll discuss in depth in future editions of the Weekly Economic Commentary.
How We Spend Our Health Care Dollars
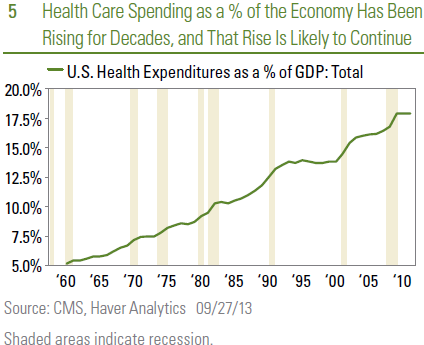
Economy-wide (federal, state, and local governments, corporations, and individuals), Americans spent $2.7 trillion (or roughly 18% of gross domestic product [GDP]) on health care products, services, and investment in 2011, the latest data available.
To put that in perspective, only three countries, China, Japan, and Germany, have economies larger than $2.7 trillion. Ten years ago, the figure was closer to 15% of GDP, and 30 years ago (1982) health care represented less than 10% of GDP. The rise in the percentage of the economy accounted for by health care is because spending on health care has risen much faster than GDP. Over the last 10 years, for example, health care spending has increased at a 5.5% annualized rate while overall GDP has increased at only a 4.0% pace. Although the aging population has played a role in this increase, and will continue to for many decades to come, health care spending per capita has increased 5% per year over the past 10 years to nearly $9,000, suggesting that even without the demographic shift, we are spending more on health care than ever before.

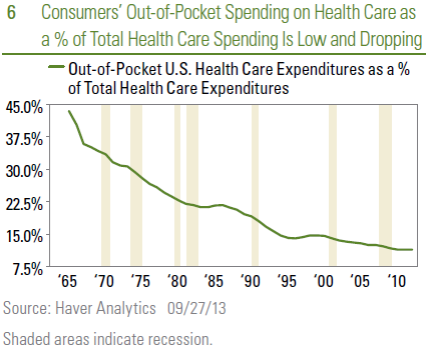
Of the $2.7 trillion spent economy-wide on health care in 2011, about one-third is on hospital services, another 25% is on professional services (doctors, dentists, clinics), and 15% is on medical products, including pharmaceuticals, medical equipment, and medical supplies. $308 billion is spent by individuals out of pocket on health care, more than is spent by individuals on new passenger cars and light trucks (approximately $240 billion in 2012), furniture and appliances (~$275 billion), or clothing (~$290 billion). Health insurance pays for another $2 trillion in health care expenses. Private insurance covers $900 billion of that $2 trillion, Medicare insurance for the elderly covers $550 billion, and Medicaid insurance for the poor covers $400 billion. The surprise here is that out-of-pocket expenses (~$300 billion) as a percent of total health care expenditures ($2.7 trillion) are just 11%, and have been moving lower for more than five decades.

As noted above, we’ll discuss the impact of health care spending on the federal budget in a future edition of the Weekly Economic Commentary, but it’s important to note that the portion of health care spending economywide “sponsored” by governments has risen steadily over the past 25 years and is projected to continue to increase over the next 10 years and beyond, as the population ages and more people move into Medicare.

Allocation of Health Care Dollars Shifting Toward Government
In 1987, 68% of health care spending was initiated by the private sector (private businesses, households, and health-related philanthropic organizations), with one-third coming from businesses and roughly twothirds from households. Within the private sector, the ratio between businesses (one-third) and household spending (two-thirds) has remained relatively steady over the past 25 years. In 2012, just 55% of health care spending was initiated by the private sector, down from 68% in 1987, while government (federal, state, and local) accounted for 45%, up from 32% in 1987. This trend is expected to rise over the next 10 years.
Business spending in this context includes:
- Employer contributions to private health insurance premiums;
- Employer Medicare Hospital Insurance (HI) payroll taxes;
- One-half of self-employment contributions to the Medicare HI Trust Fund;
- Temporary disability insurance; and
Household spending on health care includes:
- Out-of-pocket health spending;
- Employee contributions to employer-sponsored health insurance;
- Individually purchased health insurance;
- Employee and self-employment payroll taxes;
- Premiums paid to the Medicare HI and Supplementary Medical Insurance (SMI) Trust Funds by individuals; and
- Premiums paid for the Pre-existing Condition Insurance Program (PCIP) beginning in 2010.
Shifts in the mix of spending by businesses and consumers on various aspects of health care will continue to impact the economy for many years to come, and hopefully inform policy choices about who pays and how much is paid for health care in the coming decades.

Because the U.S. government is paying an ever-increasing share of health care costs, and more businesses and individuals are paying less out of pocket for health care, the actual cost and quality of health care is not as transparent as it should be. For example, we are likely to know far more about the cost and quality of the house we’re going to buy, the car we’re going to lease, and the vacation we’re going to take than we often do about our health care purchases. The overall cost of health care, combined with the lack of transparency throughout the system, will likely remain ongoing concerns for health care policymakers in the coming years and decades.
_________________________________________________________________________________________________________________________________________________________________________________
IMPORTANT DISCLOSURES
The opinions voiced in this material are for general information only and are not intended to provide specific advice or recommendations for any individual. To determine which investment(s) may be appropriate for you, consult your financial advisor prior to investing. All performance reference is historical and is no guarantee of future results. All indices are unmanaged and cannot be invested into directly.
The economic forecasts set forth in the presentation may not develop as predicted and there can be no guarantee that strategies promoted will be successful.
Stock investing involves risk including loss of principal.
Gross domestic product (GDP) is the monetary value of all the finished goods and services produced within a country’s borders in a specific time period, though GDP is usually calculated on an annual basis. It includes all of private and public consumption, government outlays, investments and exports less imports that occur within a defined territory.
The Congressional Budget Office is a non-partisan arm of Congress, established in 1974, to provide Congress with non-partisan scoring of budget proposals.
This research material has been prepared by LPL Financial.
To the extent you are receiving investment advice from a separately registered independent investment advisor, please note that LPL Financial is not an affiliate of and makes no representation with respect to such entity.
Not FDIC/NCUA Insured | Not Bank/Credit Union Guaranteed | May Lose Value | Not Guaranteed by any Government Agency | Not a Bank/Credit Union Deposit
Member FINRA/SIPC

Health Care Checkup
What We Spend on Health Care
This week, health care is likely to be in the news as a key component of the 2010 Affordable Care Act (ACA). Enrollment for individuals seeking insurance coverage takes effect on October 1, as members of Congress continue to debate the merits (and funding) of the law as part of the discussion around providing funding for the federal government. We’ll leave the pros and cons of the ACA to the politicians and pundits and focus instead on the size and scope of the health care sector in the U.S. economy. In future Weekly Economic Commentaries, we’ll explore the impact of health care on the labor market, various segments of the economy, the federal budget, inflation, and the impact of demographics on health care spending. On balance, how we (as individuals and as an economy) consume, pay for, and manage the cost of health care will play a crucial role not only in the economy, but in the federal budget in the years and decades to come.
How We’re Covered
Most, though not all, of the spending patterns discussed below are driven by what type of health insurance, if any, individuals have. Using data compiled by the non-partisan Congressional Budget Office (CBO), which assigns people to their primary source of insurance (many people have multiple sources of insurance, especially those eligible for Medicare who also purchase additional insurance), we find that 156 million people (or 57% of the non-elderly population) have employment-based health insurance. By 2023, the CBO projects that this figure will increase to 162 million but will remain at 57% of the non-elderly population. At 57 million, or 21% of the non-elderly population, the uninsured made up the second-largest portion of the population in 2012. The CBO projects that under current law, the number of uninsured will drop to 31 million or 11% of the non-elderly population by 2023. More people are likely to move onto Medicaid and to the government-run health insurance exchanges as prescribed by the ACA while those purchasing non-group insurance will remain roughly steady at 8% of the non-elderly population. This potential shift in how Americans purchase health insurance has major implications for the overall economy and the outlook for the budget, which we’ll discuss in depth in future editions of the Weekly Economic Commentary.
How We Spend Our Health Care Dollars
Economy-wide (federal, state, and local governments, corporations, and individuals), Americans spent $2.7 trillion (or roughly 18% of gross domestic product [GDP]) on health care products, services, and investment in 2011, the latest data available.
To put that in perspective, only three countries, China, Japan, and Germany, have economies larger than $2.7 trillion. Ten years ago, the figure was closer to 15% of GDP, and 30 years ago (1982) health care represented less than 10% of GDP. The rise in the percentage of the economy accounted for by health care is because spending on health care has risen much faster than GDP. Over the last 10 years, for example, health care spending has increased at a 5.5% annualized rate while overall GDP has increased at only a 4.0% pace. Although the aging population has played a role in this increase, and will continue to for many decades to come, health care spending per capita has increased 5% per year over the past 10 years to nearly $9,000, suggesting that even without the demographic shift, we are spending more on health care than ever before.
Of the $2.7 trillion spent economy-wide on health care in 2011, about one-third is on hospital services, another 25% is on professional services (doctors, dentists, clinics), and 15% is on medical products, including pharmaceuticals, medical equipment, and medical supplies. $308 billion is spent by individuals out of pocket on health care, more than is spent by individuals on new passenger cars and light trucks (approximately $240 billion in 2012), furniture and appliances (~$275 billion), or clothing (~$290 billion). Health insurance pays for another $2 trillion in health care expenses. Private insurance covers $900 billion of that $2 trillion, Medicare insurance for the elderly covers $550 billion, and Medicaid insurance for the poor covers $400 billion. The surprise here is that out-of-pocket expenses (~$300 billion) as a percent of total health care expenditures ($2.7 trillion) are just 11%, and have been moving lower for more than five decades.
As noted above, we’ll discuss the impact of health care spending on the federal budget in a future edition of the Weekly Economic Commentary, but it’s important to note that the portion of health care spending economywide “sponsored” by governments has risen steadily over the past 25 years and is projected to continue to increase over the next 10 years and beyond, as the population ages and more people move into Medicare.
Allocation of Health Care Dollars Shifting Toward Government
In 1987, 68% of health care spending was initiated by the private sector (private businesses, households, and health-related philanthropic organizations), with one-third coming from businesses and roughly twothirds from households. Within the private sector, the ratio between businesses (one-third) and household spending (two-thirds) has remained relatively steady over the past 25 years. In 2012, just 55% of health care spending was initiated by the private sector, down from 68% in 1987, while government (federal, state, and local) accounted for 45%, up from 32% in 1987. This trend is expected to rise over the next 10 years.
Business spending in this context includes:
Household spending on health care includes:
Shifts in the mix of spending by businesses and consumers on various aspects of health care will continue to impact the economy for many years to come, and hopefully inform policy choices about who pays and how much is paid for health care in the coming decades.
Because the U.S. government is paying an ever-increasing share of health care costs, and more businesses and individuals are paying less out of pocket for health care, the actual cost and quality of health care is not as transparent as it should be. For example, we are likely to know far more about the cost and quality of the house we’re going to buy, the car we’re going to lease, and the vacation we’re going to take than we often do about our health care purchases. The overall cost of health care, combined with the lack of transparency throughout the system, will likely remain ongoing concerns for health care policymakers in the coming years and decades.
_________________________________________________________________________________________________________________________________________________________________________________
IMPORTANT DISCLOSURES
The opinions voiced in this material are for general information only and are not intended to provide specific advice or recommendations for any individual. To determine which investment(s) may be appropriate for you, consult your financial advisor prior to investing. All performance reference is historical and is no guarantee of future results. All indices are unmanaged and cannot be invested into directly.
The economic forecasts set forth in the presentation may not develop as predicted and there can be no guarantee that strategies promoted will be successful.
Stock investing involves risk including loss of principal.
Gross domestic product (GDP) is the monetary value of all the finished goods and services produced within a country’s borders in a specific time period, though GDP is usually calculated on an annual basis. It includes all of private and public consumption, government outlays, investments and exports less imports that occur within a defined territory.
The Congressional Budget Office is a non-partisan arm of Congress, established in 1974, to provide Congress with non-partisan scoring of budget proposals.
This research material has been prepared by LPL Financial.
To the extent you are receiving investment advice from a separately registered independent investment advisor, please note that LPL Financial is not an affiliate of and makes no representation with respect to such entity.
Not FDIC/NCUA Insured | Not Bank/Credit Union Guaranteed | May Lose Value | Not Guaranteed by any Government Agency | Not a Bank/Credit Union Deposit
Member FINRA/SIPC
Share this:
Related