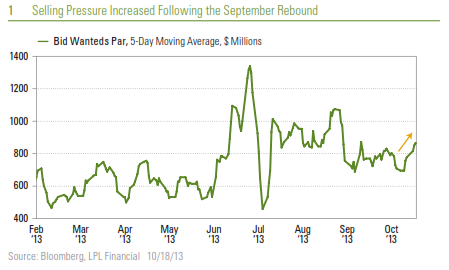
We continue to find municipal bonds one of the more attractive sectors in the bond market even after a modest pullback to start the fourth quarter of 2013. Over the first half of October, selling pressure has increased as investors used September gains as a reason to exit the municipal bond market following the spring and summer 2013 sell-off. We do not view selling in October as the start of another leg down but rather a reflection of the choppy up-and-down trading that typically follows a significant sell-off.
Headwinds
An increase in selling weighed on municipal bond prices in early October. Data from the Investment Company Institute (ICI) showed that municipal bond mutual fund outflows exceeded $1 billion for the week ending October 9, 2013 for the first time since September 18, 2013, contributing to the increase in bonds for sale before dropping last Friday, October 18, 2013 [Figure 1]. The increase in selling inventory is modest compared to the spike in June and again in late August but still enough to put the brakes on the
nascent municipal bond recovery.
Municipal bond mutual fund outflows continue to be a headwind but are showing signs of selling exhaustion. According to ICI data, municipal bond funds have now recorded 20 consecutive weeks of outflows totaling $47 billion.
During the 2010 – 2011 municipal bond sell-off, which was similar in impact to the recent pullback, outflows totaled $45 billion but over a slightly longer 26 week period, based on ICI data. Typically, outflows do not preclude a bond rally (as was the case in September) but still present a headwind for the sector.
The increase in selling supply pressure may gather steam from a pickup in new issuance. The summer rise in municipal bond yields has kept new issuance subdued in September and at the start of October, as fewer municipal bond issuers find it economical to refinance existing issues given the recent rise in yields. However, the current week, starting October 18, 2013, involves a slightly above-average $8 billion scheduled to come to market with the forward 30-day calendar increasing to $12.6 billion (according to The Bond Buyer), the highest level since mid-July 2013. Taken together, supply will be a headwind for the municipal bond market over the coming few weeks.
Poor liquidity is adding to the near-term supply challenge for municipal bonds as bond dealers remain reluctant to fully participate in markets. While many investors remain sidelined, the municipal bond market could benefit from greater bond dealer participation but — for reasons discussed in last week’s Bond Market Perspectives: Liquidity, You Don’t Miss It until It’s Gone — remain hesitant to hold bonds. Federal Reserve (Fed) data show that bond dealer holdings of municipal bonds remain relatively low and with year-end approaching are unlikely to increase materially.
Nonetheless, these challenges were evident following prior sell-offs and do not preclude a turnaround, as we saw during the 2010 – 2011 period. In fact, the lead up into the recent sell-off, the sell-off itself, and the aftermath are so far closely tracking the experience of the municipal bond market in 2010 – 2011 [Figure 2]. In 2010 – 2011, credit quality fears sparked a sharp sell-off while Fed tapering fears produced significant weakness in 2013. In both cases, markets overshot with valuations becoming attractive. The road to improvement was not a straight line in 2010 – 2011 but choppy, and a similar experience may be unfolding in 2013.

The modest pullback in October 2013 therefore could be part of the choppy up-and-down trading that typically follows a period of significant weakness.
Tailwinds
Despite the near-term supply challenges, we believe there is a good case for longer-term optimism.
- Government shutdown uncertainty. The 16-day government shutdown is over, but now market participants await the data that will reveal the impact. Standard & Poor’s has estimated the shutdown will reduce fourth quarter economic growth by 0.6%. Slower growth tends to be supportive of bonds overall and may help support municipal bond prices.
- Fed tapering delay. On a related note, the current resolution to fund the government expires in mid-January 2014, opening the door for another shutdown. The Fed will likely be hesitant therefore to taper bond purchases at the December meeting and may wait longer than anticipated, perhaps until March 2014, before reducing bond purchases. Fed tapering risks continuing to fade are also supportive of high-quality bond prices including municipal bonds.
- Attractive valuations. The municipal soft spot has led to more attractive valuations, as municipal bonds have failed to keep pace with Treasuries [Figure 3]. Valuations, as measured by AAA-rated municipal-to-Treasury yield ratios, are not back to the summer peaks but indicative of longer-term value. The higher the municipal-to-Treasury yield ratio the more attractively municipal bonds are to Treasuries and vice versa.

Keeping It in Perspective
The October soft spot is part of the ups and downs municipal investors experience following a significant pullback. The current episode is following the 2010-2011 experience and is part of the recovery process. We caution, however, that the robust municipal gains witnessed over the second half of 2011 are unlikely to be repeated over the end of 2013 and into 2014. The better economic backdrop now and eventual Fed exit from its bond purchase program argue for more limited returns compared to 2011. The headwinds suggest a quick improvement is unlikely, but the positive factors may help drive low to mid-single-digit gains over the coming six to 12 months, led by interest income and improving valuations. Among high-quality bonds we find municipal bonds one of the more attractive investment options.
_____________________________________________________________________________________________________________________________
IMPORTANT DISCLOSURES
The opinions voiced in this material are for general information only and are not intended to provide specific advice or recommendations for any individual. To determine which investment(s) may be appropriate for you, consult your financial advisor prior to investing. All performance reference is historical and is no guarantee of future results. All indices are unmanaged and cannot be invested into directly. Unmanaged index returns do not reflect fees, expenses, or sales charges. Index performance is not indicative of the performance of
any investment. Past performance is no guarantee of future results.
The economic forecasts set forth in the presentation may not develop as predicted and there can be no guarantee that strategies promoted will be successful.
Yield is the income return on an investment. This refers to the interest or dividends received from a security and is usually expressed annually as a percentage based on the investment’s cost, its current market value or its face value.
Bonds are subject to market and interest rate risk if sold prior to maturity. Bond values and yields will decline as interest rates rise, and bonds are subject to availability and change in price.
Government bonds and Treasury Bills are guaranteed by the U.S. government as to the timely payment of principal and interest and, if held to maturity, offer a fixed rate of return and fixed principal value. However, the value of fund shares is not guaranteed and will fluctuate.
Municipal bonds are subject to availability, price, and to market and interest rate risk if sold prior to maturity. Bond values will decline as interest rate rise. Interest income may be subject to the alternative minimum tax.Federally tax-free but other state and local taxes may apply.
Treasuries are marketable, fixed-interest U.S. government debt securities. Treasury bonds make interest payments semi-annually, and the income that holders receive is only taxed at the federal level.
INDEX DESCRIPTIONS
The Barclays Treasury index is an unmanaged index of public debt obligations of the U.S. Treasury with a remaining maturity of one year or more. The index does not include t-bills (due to the maturity constraint), zero coupon bonds (Strips) , or Treasury Inflation Protected Securities (TIPS).
The Barclays Municipal Bond Index is a market capitalization-weighted index of investment-grade municipal bonds with maturities of at least one year. All indices are unmanaged and include reinvested dividends. One cannot invest directly in an index. Past performance is no guarantee of future results.

Leave a comment