LPL Financial Research forecasts U.S. economic growth, as measured by real gross domestic product (GDP), to accelerate to 3% in 2014 from the 2% pace of recent years. This marks our first above-consensus annual forecast for GDP in many years. As of mid-December 2013, the Bloomberg-tracked consensus estimate by economists for 2014 was 2.6%. If achieved, the 3% pace of GDP growth in 2014 would be the best performance for the U.S. economy since 2005, when the economy posted 3.4% growth. While a strong growth rate in comparison to the past 10 years, the 3% growth rate would simply equal the average pace of real GDP growth since the end of WWII.
Global GDP growth is also likely to accelerate in 2014. The economists’ consensus forecast expects a pickup from around 3% in 2013 to 3.5% in 2014. Beyond the United States, the major contributors to this growth rate amay also enjoy a better pace of growth in 2014:
-
Europe will likely eke out a modest gain in GDP after emerging from a double-dip recession in 2013;
-
China’s growth should stabilize in the coming year after slowing during the last few years; and
-
Japan could record its third consecutive year of GDP growth for the first time since the mid-2000s.
Below, we take a month-by-month look at what could be some of the key milestones for the economic outlook in the first quarter of 2014.
January:
- 19th: China’s GDP report for 2013 – As of mid-December 2013, the consensus of economists polled by Bloomberg News expected that China’s GDP growth in 2013 would be between 7.5% and 8.0%, close to the 7.7% gain in 2012, but far below the 10 – 12% pace set by the Chinese economy between 2000 and 2007. In our view, markets have yet to become comfortable with the notion that China may never again see 10% GDP growth on a sustained basis, as it continues its transition from an export-led economy to a more stable, consumer-led economy.
- 29th: First of eight Federal Open Market Committee (FOMC) meetings for 2014 – The Federal Reserve (Fed) is expected to maintain the current pace of tapering ($10 billion less in purchases) of quantitative easing at this meeting. The pace of the economy in 2014 will determine how quickly the Fed trims its purchases.
This is Janet Yellen’s first meeting as Chairwoman of the Fed and FOMC, the policymaking arm of the Fed. We continue to expect that Yellen will aim for more transparency at the Fed in 2014, and that could mean a press conference after each of the eight FOMC meetings this year. Currently, Yellen is scheduled to hold only four press conferences—after the March, June, September, and December 2014 FOMC meetings.
- 30th: The first estimate of GDP for Q4 2013 will be released – The government shutdown in the first half of October 2013 likely weighed on growth and based on the daily, weekly, and monthly data already in hand for the fourth quarter of 2013, fourth quarter 2013 GDP is currently tracking to around 2.0%. If GDP does come in at around 2.0% in the fourth quarter, GDP growth for all of 2013 would be just 1.9%.
February:
-
7th: Employment report for January 2014 will be released – The pace of job growth is one of the keys to the pace of Fed tapering in 2014. The December 2013 jobs report (due out this Friday, January 10, 2014) will likely show that the economy again created a net new 200,000 jobs in December 2013, close to the pace of job creation seen over the past three, six, and 12 months. If job creation increases markedly from this pace, the market will expect the Fed to quicken its pace of tapering. Similarly, a sustained slowdown in job creation from the current 200,000 per-month pace might cause the Fed to slow its tapering plan.
-
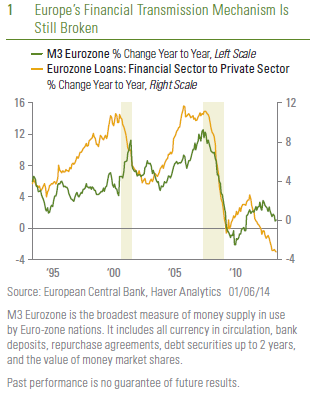
14th: Eurozone will report GDP for Q4 2013 and all of 2013 – The Eurozone is expected to have eked out a modest (0.4%) increase in GDP in the fourth quarter of 2013, which would leave GDP for all of 2013 0.4% below its 2012 level. Looking ahead to 2014, the Bloomberg consensus estimate for Eurozone GDP (as of mid-December 2013) stands at just 1.0%, still among the slowest growth in the developed world. While the European economy stopped getting worse in 2013, it is not likely to improve dramatically until it can effectively address its broken financial transmission mechanism. The latest data show that while money supply growth in the Eurozone is slightly positive, bank lending to small and medium-sized businesses in the Eurozone is still contracting — and at a faster rate than it was at the start of 2013 [Figure 1]. We view this as a key impediment to faster economic growth in the Eurozone in 2014.
-
Late February: Retailers will report their sales and earnings for their fiscal fourth quarters, the three months ending in January 2014. – These results will serve as the final say on the 2013 holiday shopping season. The improvement in the labor and housing markets throughout 2013, as well as the increases in household net worth, driven in part by the 25 – 30% gain in equity prices in 2013 to new all-time highs, will act as support for holiday spending. Most retailers will report their December 2013 sales and provide guidance for January 2014 and beyond later this week (Thursday, January 9, 2014).
March
-
4th: Q4 2013 Flow of Funds report will be released by the Fed – The quarterly flow of funds report is often ignored by markets and the media, as it is difficult to interpret and is released with a long lag. However, the report is full of crucial data, including household balance sheets (assets and liabilities). The latest data available (Q3 2013) revealed that household net worth (assets minus liabilities) hit another new all-time high in the third quarter [Figure 2], aided by solid gains in the labor market, home prices, and sizable increases in financial assets, like equities. All of those categories continued to move higher in the fourth quarter of 2013, suggesting that household net worth will likely hit another all-time high in the fourth quarter of 2013. The rise in household net worth provides solid support for consumer spending, which represents two-thirds of GDP.

-
19th: FOMC meeting – If the Fed sticks to its current communications plan, March 19, 2014 will be Janet Yellen’s first press conference as Fed Chairwoman. As noted above, we expect Yellen to continue to enhance the Fed’s transparency over the course of 2014.
-
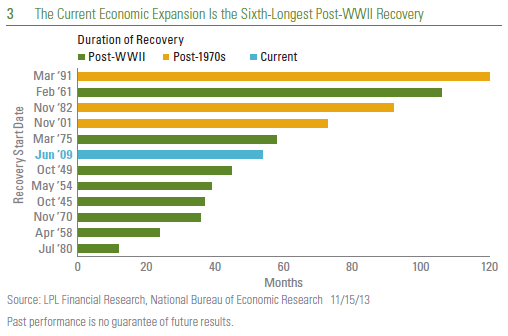
31st: Start of the 58th month of the economic expansion that began in July 2009 – As noted in our Outlook 2014 publication, since the end of WWII, the average economic expansion has lasted 58 months [Figure 3]. Looking back over the past 50 years, the average expansion has been 71 months. On that basis, the current recovery has another two years to go (2014 and 2015) just to get to “average.” The best comparison, however, may be the three economic expansions since the end of the inflationary 1970s, a period that has seen the transformation of the U.S. economy from a domestically focused, manufacturing economy to a more exportheavy, service-based economy. In general, this economic structure is less prone to inventory swings that drove the shorter boom-bust cycles of the past. On average, the last three expansions — the ones that began in 1982, 1991, and 2001 — lasted 95 months, or roughly eight years. Using those three expansions as the standard, the current economic expansion would merely be at its midpoint at the end of March 2014. The rather tepid pace of this expansion relative to prior expansions that lasted this long also supports the idea that we are close to the middle of the expansion, rather than the end.
_____________________________________________________________________________________________________________________________
IMPORTANT DISCLOSURES
The opinions voiced in this material are for general information only and are not intended to provide specific advice or recommendations for any individual. To determine which investment(s) may be appropriate for you, consult your financial advisor prior to investing. All performance reference is historical and is no guarantee of future results. All indices are unmanaged and cannot be invested into directly.
The economic forecasts set forth in the presentation may not develop as predicted and there can be no guarantee that strategies promoted will be successful.
Stock investing involves risk including loss of principal.
The Federal Open Market Committee (FOMC), a committee within the Federal Reserve System, is charged under the United States law with overseeing the nation’s open market operations (i.e., the Fed’s buying and selling of U.S. Treasury securities).
Quantitative easing is a government monetary policy occasionally used to increase the money supply by buying government securities or other securities from the market. Quantitative easing increases the money supply by flooding financial institutions with capital in an effort to promote increased lending and liquidity.
Tapering refers to the Federal Reserve (Fed) slowing the pace of bond purchases in their Quantitative Easing (QE) program. To execute QE, the Fed purchases a set amount of Treasury and Mortgage-Backed bonds each month from banks. This inserts more money in the economy (known as easing), which is intended to encourage economic growth. Lowering the amount of purchases (tapering) would indicate less easing of monetary policy.
This research material has been prepared by LPL Financial.
To the extent you are receiving investment advice from a separately registered independent investment advisor, please note that LPL Financial is not an affiliate of and makes no representation with respect to such entity.
Not FDIC/NCUA Insured | Not Bank/Credit Union Guaranteed | May Lose Value | Not Guaranteed by any Government Agency | Not a Bank/Credit Union Deposit
Member FINRA/SIPC

Leave a comment