Archive for January, 2014

Sentiment & Positioning
January 28, 2014

A widely expected move higher in bond yields has yet to materialize in 2014, and those expectations actually may help explain why yields have declined. Financial markets occasionally “zig” just when a growing majority expects a “zag.” Bonds are no exception, and many investors have been caught off guard by early 2014 bond strength. Although profit taking hit bonds on Monday, January 27, 2014, the Barclays Aggregate Bond Index is still up over 1% year to date. After dropping as low as 2.71% last Friday, the 10-year Treasury yield closed Monday, January 27, 2014 at 2.76%, still 0.27% lower in just over three weeks of trading this year — a significant move.

Lopsided sentiment can often drive contrarian moves by financial markets, especially in the bond market. One indicator that captured the overwhelmingly negative sentiment on bonds was the Commitments of Traders report, which is issued weekly by the U.S. Commodity Futures Trading Commission (CFTC). The CFTC Commitments of Traders report includes the net positioning of speculative investors across a variety of futures contracts. Observing whether speculative investors are net long (betting on higher prices) or net short (betting on lower prices) can reveal positioning of institutional speculative investors.

In late 2013, the CFTC report showed one of the largest net short positions on record in 10-year Treasury futures, indicating that the market was expecting rates to rise. The near 200,000 net short position was a level witnessed only rarely over the past 10 years [Figure 1]. These extremes have

Figure_1_-_1-28-2014

often coincided with contrarian rallies as evidenced by the shaded areas. As prices rise and yields decline, speculative investors scramble to cover their short positions for fear of incurring losses. The rush to exit positions can be a powerful force and, here in early 2014, the subsequent buying has helped propel the bond market higher.

This contrarian indicator can help explain pullbacks as well. The buildup of long positions in early 2013 to some of the highest levels of the past few years coincided with the 2013 bond pullback and rise in yields.

At the same time, the indicator is not foolproof, and a significant net long position prior to the 2007 – 08 financial crisis coincided with a long decline in yields. In addition, the CFTC data are released with a slight lag meaning sentiment may have shifted, but it does help explain market moves. The CFTC report is just one tool to assess sentiment that may be offside and a lead to a contrarian move in the markets, but it needs to be evaluated in conjunction with other data.

Positioning

Positioning of short-term speculators is far from the only factor driving bond prices, and investor positioning appeared to corroborate the negative sentiment at the start of the year. The firm Stone & McCarthy Research Associates conducts a survey of bond investors to assess whether they are positioned short, neutral, or long relative to their broad benchmarks. A short or long bias would reveal investor expectations of rising or falling interest rates, respectively. In mid-January, Stone & McCarthy’s survey revealed investors on average were at 96.6% of their target interest rate sensitivity, or duration, the most defensive reading since the third quarter of 2008.

As bond prices rise and interest rates fall, defensively positioned investors may see their portfolios likely lag benchmark performance. Investors then would likely buy to get closer to their benchmark in order to limit underperformance to a benchmark. Bond buys to get portfolios closer to neutral may have aided bonds in early 2014.

When coupled with fundamental drivers, positioning and sentiment can be a potent combination. In early January 2014, a weaker-than-expected employment report sparked questions about the strength of the economy and bonds rallied, setting in motion a buying spree as wrong-footed investors reversed bets on lower bond prices. Pension investors also took advantage of yields near two-and-a-half-year highs and also gave bond prices a boost to start 2014 (please see blog post Why Own Bonds? 1/21/14 for more details).

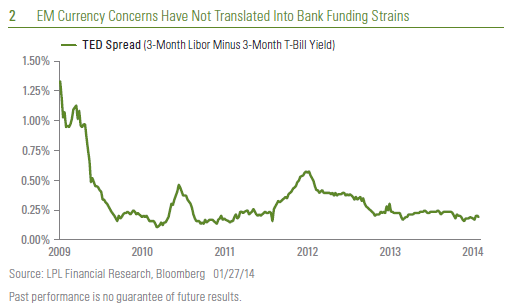
Recent momentum was aided by a host of emerging market (EM) issues spurring buys of higher-quality assets like Treasuries. Weaker-than-expected economic growth from China, Turkey’s central bank’s attempt to stabilize its currency, political instability in the Ukraine, and Argentine currency devaluation all contributed to US Treasury demand.

EM currency fears appear contained for now, however, with no signs of disruption in domestic intra-bank lending markets. The TED spread, a key gauge of inter-bank lending pressures during the 2007 – 08 financial crisis and several times during the European debt fears of recent years, has served as an early warning signal but is near a post-recession low for now [Figure 2], indicating no global contagion from EM currency weakness.

Figure_2_-_1-28-2014

Where Do We Go From Here?

Although EM concerns may support high-quality bonds during the current week, the offside positioning in the bond market has been largely reversed. Figure 1 illustrates that while speculators may still be net short, positioning is much closer to neutral and away from an extreme. The most recent J.P. Morgan investor duration survey shows fewer participants “short” and a greater number now “neutral.”

This suggests that the fuel for additional price gains will likely need to come from fundamental data. The preponderance of economic data suggests the U.S. economy continues to expand near our expected pace of 3% (as measured by real gross domestic product) and that the weak employment report may have been an outlier, suggesting further bond gains may be limited. Bond investors may refocus on economic data now that positioning and sentiment appear more balanced.

Furthermore, this week’s auctions of new two-, five-, and seven-year Treasury securities may give investors pause after the recent run-up in prices. Add a Federal Reserve (Fed) meeting, and a bond market breather is likely until new information is digested. The Fed is also widely expected to announce a further $10 billion reduction in bond purchases at the conclusion of Wednesday’s Fed meeting. Both factors augur for higher yield probability over the course of the year.

____________________________________________________________________________________________________________________________

IMPORTANT DISCLOSURES

The opinions voiced in this material are for general information only and are not intended to provide specific advice or recommendations for any individual. To determine which investment(s) may be appropriate for you, consult your financial advisor prior to investing. All performance referenced is historical and is no guarantee of future results. All indices are unmanaged and cannot be invested into directly. Unmanaged index returns do not reflect fees, expenses, or sales charges. Index performance is not indicative of the performance of any investment. Past performance is no guarantee of future results.

This information is not intended to be a substitute for specific individualized tax advice. We suggest that you discuss your specific tax issues with a qualified tax advisor.

The economic forecasts set forth in the presentation may not develop as predicted and there can be no guarantee that strategies promoted will be successful.

Bonds are subject to market and interest rate risk if sold prior to maturity. Bond values and yields will decline as interest rates rise, and bonds are subject to availability and change in price.

Treasuries are marketable, fixed-interest U.S. government debt securities. Treasury bonds make interest payments semi-annually, and the income that holders receive is only taxed at the federal level.

Government bonds and Treasury bills are guaranteed by the U.S. government as to the timely payment of principal and interest and, if held to maturity, offer a fixed rate of return and fixed principal value. However, the value of fund shares is not guaranteed and will fluctuate.

International and emerging market investing involves special risks such as currency fluctuation and political instability and may not be suitable for all investors.

_____________________________________________________________________________________________________________________________

INDEX DESCRIPTIONS

The Barclays Aggregate Bond Index represents securities that are SEC-registered, taxable, and dollar denominated. The index covers the U.S. investment-grade fixed rate bond market, with index components for government and corporate securities, mortgage pass-through securities, and asset-backed securities.

_____________________________________________________________________________________________________________________________

This research material has been prepared by LPL Financial.

To the extent you are receiving investment advice from a separately registered independent investment advisor, please note that LPL Financial is not an affiliate of and makes no representation with respect to such entity.

Not FDIC/NCUA Insured | Not Bank/Credit Union Guaranteed | May Lose Value | Not Guaranteed by any Government Agency | Not a Bank/Credit Union Deposit

Member FINRA/SIPC

Why Own Bonds?
January 21, 2014

Strong equity market performance in 2013 and still-low yields may cause investors to overlook the fact that bonds can still serve as an effective diversification tool. Following a year in which stocks returned 30% and bonds posted their worst return since 1994*, investor sentiment for stocks remains positive while bond sentiment is poor. The divergence in sentiment is evident in actual investment dollars. Inflows into stock mutual funds totaled $168 billion in 2013 versus a rare outflow for bonds, which totaled $82 billion. Our 2014 forecast calls for 10% to 15% returns for stocks and another challenging year for bonds with returns roughly flat^.

Figure_1_-_1-21-2014

The case for stock investing is strong but pullbacks can arrive without warning. As mentioned in our

Outlook 2014, we expect more volatility this year. In 2013, the stock market experienced only one brief pullback of just over 5%. Historically such calm is rare. Looking beyond 2014 the case for stocks over bonds is compelling, but for investors with shorter-term horizons protection against an equity market sell-off is prudent. After all, the average annual peak-to-trough decline in the S&P 500 from 1960 to 2013 has been 16%, and pullbacks can arrive without warning. Investors need to be prepared and bonds can help provide a buffer.

A look back at prior stock market pullbacks illustrates how bonds have historically provided good diversification benefits. Figure 1 shows all equity market pullbacks of 5% or more lasting three weeks or more over the past 10 years and the corresponding return for stocks and high-quality bonds. Figure 1 also illustrates the hypothetical return of a balanced 60% stock/40% bond portfolio and the dampening impact bonds can have on stock weakness. During stock market pullbacks in excess of 5%, bonds outperformed stocks on average by a double digit margin, a significant difference. Excluding the historic mid-2008 to early-2009 sell-off, the performance differential narrows but is still notable at a 9.6% advantage in favor of high-quality bonds.

In a few cases, both stocks and bonds declined together. This is a troubling outcome and reflects a failure of diversification, but it is rare. Still, bonds managed to outperform stocks on those occasions. In 2008, high-quality bonds provided a buffer but not without volatility, as investment-grade corporate bonds declined for the year and even high-quality mortgage-backed securities (MBS) suffered brief declines. While not all segments of the bond market perform similarly every time, an allocation to high-quality bonds has proven effective at offsetting stock market weakness.

Not About Yield

Today’s low-yield environment does not negate the diversification potential of bonds. During 2012, the stock market suffered two pullbacks greater than 5%, and bonds rose more than 1% over each period. The 10-year Treasury yield varied between 1.4% and 1.9% during the 2012 equity market sell-offs, much lower than today’s level.

In fact, during each stock market pullback in Figure 1 bond market performance is fairly consistent, averaging 1%, despite varied levels of interest rates. Two of the bond market’s strongest gains during stock market sell-offs occurred in 2010 and 2011, a post-recession period in which yields had already declined sharply.

Over short-term periods, price movement, not interest income, is the primary driver of bond performance. Interest income accrues slowly and although the primary driver of long-term bond returns, price changes, up or down, often overwhelm the impact of interest income over short periods of time. Therefore, a low-yield environment does not preclude bonds acting as a diversification tool.

Figure_2_-_1-21-2014

Pension Buyers

Pension plans represent another investor group that can use bonds to address a specific objective. Pension investors, who have a very long time horizon and are therefore less sensitive to interest rate movements, use bonds to offset their long-term liabilities. Robust equity market gains in 2013 improved pension funding ratios broadly and reduced the need to take on additional risk to achieve investment goals. Following a year in which equities gained 30%, pension buyers took advantage of long-term Treasury yields near 4% and long-term corporate bond yields above 5% to better balance the risk-reward profile of their investment portfolios [Figure 2]. Pension buying, which has been a steady source of demand so far in 2014 and one reason why bonds are off to a good start, illustrates another way in which bonds can address specific investor objectives.

Conclusion

Low yields will likely translate into lower long-term bond returns, and therefore the hurdle for stock investors to beat bond performance over the long term is lower. However, for investors with shorter horizons or those simply unwilling to endure stock market swings, bonds can play a diversification role even in today’s low-yield environment. In conjunction with sectors that historically hold up better against rising rates, such as high-yield bonds and bank loans, an allocation to core bonds makes sense to help protect against potential stock market weakness.

_____________________________________________________________________________________________________________________________

IMPORTANT DISCLOSURES

The opinions voiced in this material are for general information only and are not intended to provide specific advice or recommendations for any individual. To determine which investment(s) may be appropriate for you, consult your financial advisor prior to investing. All performance reference is historical and is no guarantee of future results. All indices are unmanaged and cannot be invested into directly. Unmanaged index returns do not reflect fees, expenses, or sales charges. Index performance is not indicative of the performance of any investment. Past performance is no guarantee of future results.

This information is not intended to be a substitute for specific individualized tax advice. We suggest that you discuss your specific tax issues with a qualified tax advisor.

The economic forecasts set forth in the presentation may not develop as predicted and there can be no guarantee that strategies promoted will be successful.

Bonds are subject to market and interest rate risk if sold prior to maturity. Bond values and yields will decline as interest rates rise, and bonds are subject to availability and change in price.

Stock and mutual fund investing involves risk including loss of principal.

Corporate bonds are considered higher risk than government bonds but normally offer a higher yield and are subject to market, interest rate and credit risk as well as additional risks based on the quality of issuer coupon rate, price, yield, maturity and redemption features.

Mortgage-backed securities are subject to credit, default risk, prepayment risk that acts much like call risk when you get your principal back sooner than the stated maturity, extension risk, the opposite of prepayment risk, and interest rate risk.

Treasuries are marketable, fixed-interest U.S. government debt securities. Treasury bonds make interest payments semi-annually, and the income that holders receive is only taxed at the federal level.

Government bonds and Treasury bills are guaranteed by the US government as to the timely payment of principal and interest and, if held to maturity, offer a fixed rate of return and fixed principal value.

_____________________________________________________________________________________________________________________________

INDEX DESCRIPTIONS

The Barclays Aggregate Bond Index represents securities that are SEC-registered, taxable, and dollar denominated. The index covers the U.S. investment-grade fixed rate bond market, with index components for government and corporate securities, mortgage pass-through securities, and asset-backed securities.

The Standard & Poor’s 500 Index is a capitalization-weighted index of 500 stocks designed to measure performance of the broad domestic economy through changes in the aggregate market value of 500 stocks representing all major industries.

______________________________________________________________________________________________________________________________

This research material has been prepared by LPL Financial.

To the extent you are receiving investment advice from a separately registered independent investment advisor, please note that LPL Financial is not an affiliate of and makes no representation with respect to such entity.

Not FDIC/NCUA Insured | Not Bank/Credit Union Guaranteed | May Lose Value | Not Guaranteed by any Government Agency | Not a Bank/Credit Union Deposit

Member FINRA/SIPC

An Investor’s Guide to Central Banks
January 14, 2014

Portfolios are likely to enjoy more independence from policymakers in 2014 compared to 2013, when the markets and media seemed to obsess over policymakers’ actions both here and abroad, as noted in our Outlook 2014: The Investor’s Almanac. Despite our view that the economy and markets are likely to become more independent of policymakers this year, actions (and words) of central banks always have (and likely always will) some impact on global economies and financial markets.

Every year, we devote many pages in this publication and others to discussing the United States’ central bank — the Federal Reserve (Fed). We have also written extensively about the Eurozone’s central bank, the European Central Bank (ECB); China’s central bank, the People’s Bank of China; and more recently the Bank of Japan (BOJ), Japan’s central bank. But what about the other prominent central banks around the globe?

  • Have they been lowering or raising rates?
  • What are their concerns?
  • What indicators do they watch?
  • What are their views of economies beyond their own?

The political independence, as well as the relative transparency, of each of the banks is of course also of keen interest to market participants. We plan on examining these issues in future editions of the Weekly Economic Commentary.

Figure 1 details 15 central banks, representing 19 of the top 20 economies in the world. These central banks set monetary policy for nearly 90% of the world’s gross domestic product (GDP). What they do and say matters, even in years where policy is likely to take a back seat to portfolios, as we expect to be the case in 2014.

At first glance, it may seem that developed market central banks have all been aggressively cutting rates since the onset of the financial crisis and Great Recession in 2007. However, while the ECB, the Fed, the BOE, and the BOJ have been aggressively easing policy over the past five years or so, central banks in several large developed economies have raised rates over that time. Geography and exposure to commodity prices were keys to most of these policy shifts. The divergence in central bank policies within the developed world, and between the developed world and the emerging market economies, has created risks and opportunities across the investment spectrum — equities, bonds, commodities, and currencies — for active managers investing in many of these regions and asset classes.

Figure_1_-_1-14-2014

For example, the Bank of Canada (BOC), along with the Reserve Bank of Australia (RBA), and South Korea’s central bank, the Bank of Korea, have all raised rates since 2008, and all have either close ties to China and the relatively strong emerging market economies, or have big exposure to commodity prices. Most — but not all — emerging market central banks have raised rates at least once since 2009.

Figure_2_-_1-14-2014

Commodities, currencies, and China were key drivers of policy in this group. For example, in October 2009, Australia’s central bank, the RBA, raised rates by 25 basis points, noting that the downside risks for the economy had waned, the risk of rising inflation had increased, and that “Growth in China has been very strong, which is having a significant impact on other economies in the region and on commodity markets.” The RBA continued to raise rates over the next 12 months, but has been cutting rates since late 2011, citing a slowdown in Europe and China, moderating inflation, and a decline in commodity prices.

The BOC waited until June 2010 to raise rates, citing “strong momentum in emerging market economies” and forecast that Canada’s economy would return to “full capacity” by the end of 2011. Canada raised rates three times (by a total of 75 basis points) in 2010 but has not made a change to policy since late 2010. Commodity prices (lumber, energy) are key components of the Canadian economy, which has strong ties to China and Asia as well.

Figure_3_-_1-14-2014

Similarly, the Bank of Korea (BOK) began raising rates in mid-2010, noting “emerging market economies have sustained their favorable performance” and “upward pressures (on inflation) are expected to build continuously owing to the increase in demand-pull pressures associated with the continued upturn in economic activity.” The BOK raised rates by a total of 125 basis points between mid-2010 and mid-2011, but has generally been cutting rates since then. Korea’s economy is closely linked to China’s and Japan’s.

Among the seven emerging market central banks on our radar, six have raised rates at least once since 2009, including the People’s Bank of China, the Reserve Bank of India (RBI), Brazil’s central bank, and the central banks of Turkey, Russia, and Indonesia. Most of these rate hikes were the result of higher-than-expected inflation readings and/or concern over the value of the local currency. Russia’s central bank, Bank Rossii, has increased rates by just 50 basis points since 2011, a far less aggressive round of tightening than at any of the other emerging market central banks on our list. Why? Russia’s economy was more severely impacted by the crisis in Russia’s next door neighbor Europe than most of the other major emerging market economies. Mexico’s central bank, the Banco de Mexico (Banixo), has been cutting rates since early 2013. Mexico’s economy, of course, is closely tied to the U.S. economy, which has been sluggish. A stronger peso (Mexico’s currency) and stable inflation provided the scope to cut rates.

For many of these countries, the latest round of rate hikes is the second since 2009. For example, Brazil raised rates between mid-2010 and mid- 2011, eased rates as the European financial crisis worsened in 2011, and then began raising rates again in mid-2013. Inflation was the primary catalyst each time. India’s experience has been similar. India began raising rates in early 2010, citing a weakening currency and higher-than-expected inflation. After raising rates throughout 2010 and 2011, the RBI began cutting rates in 2012 and into early 2013, but recently, as the Fed began to consider scaling back its quantitative easing (QE) program, the RBI began raising rates, citing weakness in the rupee, India’s currency. Indonesia’s experience with rates over the past four years is similar to the RBI’s and Brazil’s central bank.

China’s central bank was quick to tighten in 2010 and 2011, citing rising inflation pressures, but stopped raising rates by mid-2011. By mid-2012, concerned with a slowdown in export growth, the PBOC cut rates, against the backdrop of decelerating inflation.

Looking ahead, with the Fed now in the process of scaling back or tapering, its QE program, and the BOE poised to begin to reduce its QE program, the policy divergences among the world’s major central banks are likely to intensify in 2014. This will create risks to global economies, investments, and currencies, but opportunities as well. We will continue to monitor what these banks do and say throughout the year, keeping in mind that portfolios are likely to matter more than policy in 2014.

______________________________________________________________________________________________________________________________

IMPORTANT DISCLOSURES

The opinions voiced in this material are for general information only and are not intended to provide specific advice or recommendations for any individual. To determine which investment(s) may be appropriate for you, consult your financial advisor prior to investing. All performance reference is historical and is no guarantee of future results. All indices are unmanaged and cannot be invested into directly.

The economic forecasts set forth in the presentation may not develop as predicted and there can be no guarantee that strategies promoted will be successful.

Stock investing involves risk including loss of principal.

Gross Domestic Product (GDP) is the monetary value of all the finished goods and services produced within a country’s borders in a specific time period, though GDP is usually calculated on an annual basis. It includes all of private and public consumption, government outlays, investments and exports less imports that occur within a defined territory.

The Federal Open Market Committee (FOMC), a committee within the Federal Reserve System, is charged under the United States law with overseeing the nation’s open market operations (i.e., the Fed’s buying and selling of U.S. Treasury securities).

Quantitative easing is a government monetary policy occasionally used to increase the money supply by buying government securities or other securities from the market. Quantitative easing increases the money supply by flooding financial institutions with capital in an effort to promote increased lending and liquidity.

Tapering refers to the Federal Reserve (Fed) slowing the pace of bond purchases in their Quantitative Easing (QE) program. To execute QE, the Fed purchases a set amount of Treasury and Mortgage-Backed bonds each month from banks. This inserts more money in the economy (known as easing), which is intended to encourage economic growth. Lowering the amount of purchases (tapering) would indicate less easing of monetary policy.

______________________________________________________________________________________________________________________________

This research material has been prepared by LPL Financial.

To the extent you are receiving investment advice from a separately registered independent investment advisor, please note that LPL Financial is not an affiliate of and makes no representation with respect to such entity.

Not FDIC/NCUA Insured | Not Bank/Credit Union Guaranteed | May Lose Value | Not Guaranteed by any Government Agency | Not a Bank/Credit Union Deposit

Member FINRA/SIPC

Guide to Q1: Global Growth, Jobs, and the Fed
January 7, 2014

LPL Financial Research forecasts U.S. economic growth, as measured by real gross domestic product (GDP), to accelerate to 3% in 2014 from the 2% pace of recent years. This marks our first above-consensus annual forecast for GDP in many years. As of mid-December 2013, the Bloomberg-tracked consensus estimate by economists for 2014 was 2.6%. If achieved, the 3% pace of GDP growth in 2014 would be the best performance for the U.S. economy since 2005, when the economy posted 3.4% growth. While a strong growth rate in comparison to the past 10 years, the 3% growth rate would simply equal the average pace of real GDP growth since the end of WWII.

Global GDP growth is also likely to accelerate in 2014. The economists’ consensus forecast expects a pickup from around 3% in 2013 to 3.5% in 2014. Beyond the United States, the major contributors to this growth rate amay also enjoy a better pace of growth in 2014:

  • Europe will likely eke out a modest gain in GDP after emerging from a double-dip recession in 2013;
  • China’s growth should stabilize in the coming year after slowing during the last few years; and
  • Japan could record its third consecutive year of GDP growth for the first time since the mid-2000s.

Below, we take a month-by-month look at what could be some of the key milestones for the economic outlook in the first quarter of 2014.

January:

  • 19th: China’s GDP report for 2013 – As of mid-December 2013, the consensus of economists polled by Bloomberg News expected that China’s GDP growth in 2013 would be between 7.5% and 8.0%, close to the 7.7% gain in 2012, but far below the 10 – 12% pace set by the Chinese economy between 2000 and 2007. In our view, markets have yet to become comfortable with the notion that China may never again see 10% GDP growth on a sustained basis, as it continues its transition from an export-led economy to a more stable, consumer-led economy. 
  • 29th: First of eight Federal Open Market Committee (FOMC) meetings for 2014 – The Federal Reserve (Fed) is expected to maintain the current pace of tapering ($10 billion less in purchases) of quantitative easing at this meeting. The pace of the economy in 2014 will determine how quickly the Fed trims its purchases.

This is Janet Yellen’s first meeting as Chairwoman of the Fed and FOMC, the policymaking arm of the Fed. We continue to expect that Yellen will aim for more transparency at the Fed in 2014, and that could mean a press conference after each of the eight FOMC meetings this year. Currently, Yellen is scheduled to hold only four press conferences—after the March, June, September, and December 2014 FOMC meetings.

  • 30th: The first estimate of GDP for Q4 2013 will be released – The government shutdown in the first half of October 2013 likely weighed on growth and based on the daily, weekly, and monthly data already in hand for the fourth quarter of 2013, fourth quarter 2013 GDP is currently tracking to around 2.0%. If GDP does come in at around 2.0% in the fourth quarter, GDP growth for all of 2013 would be just 1.9%.

February:

  • 7th: Employment report for January 2014 will be released – The pace of job growth is one of the keys to the pace of Fed tapering in 2014. The December 2013 jobs report (due out this Friday, January 10, 2014) will likely show that the economy again created a net new 200,000 jobs in December 2013, close to the pace of job creation seen over the past three, six, and 12 months. If job creation increases markedly from this pace, the market will expect the Fed to quicken its pace of tapering. Similarly, a sustained slowdown in job creation from the current 200,000 per-month pace might cause the Fed to slow its tapering plan.

Figure_1_-_1-7-2014

  • 14th: Eurozone will report GDP for Q4 2013 and all of 2013 – The Eurozone is expected to have eked out a modest (0.4%) increase in GDP in the fourth quarter of 2013, which would leave GDP for all of 2013 0.4% below its 2012 level. Looking ahead to 2014, the Bloomberg consensus estimate for Eurozone GDP (as of mid-December 2013) stands at just 1.0%, still among the slowest growth in the developed world. While the European economy stopped getting worse in 2013, it is not likely to improve dramatically until it can effectively address its broken financial transmission mechanism. The latest data show that while money supply growth in the Eurozone is slightly positive, bank lending to small and medium-sized businesses in the Eurozone is still contracting — and at a faster rate than it was at the start of 2013 [Figure 1]. We view this as a key impediment to faster economic growth in the Eurozone in 2014.

  • Late February: Retailers will report their sales and earnings for their fiscal fourth quarters, the three months ending in January 2014. – These results will serve as the final say on the 2013 holiday shopping season. The improvement in the labor and housing markets throughout 2013, as well as the increases in household net worth, driven in part by the 25 – 30% gain in equity prices in 2013 to new all-time highs, will act as support for holiday spending. Most retailers will report their December 2013 sales and provide guidance for January 2014 and beyond later this week (Thursday, January 9, 2014).

March

  • 4th: Q4 2013 Flow of Funds report will be released by the Fed – The quarterly flow of funds report is often ignored by markets and the media, as it is difficult to interpret and is released with a long lag. However, the report is full of crucial data, including household balance sheets (assets and liabilities). The latest data available (Q3 2013) revealed that household net worth (assets minus liabilities) hit another new all-time high in the third quarter [Figure 2], aided by solid gains in the labor market, home prices, and sizable increases in financial assets, like equities. All of those categories continued to move higher in the fourth quarter of 2013, suggesting that household net worth will likely hit another all-time high in the fourth quarter of 2013. The rise in household net worth provides solid support for consumer spending, which represents two-thirds of GDP.

Figure_2_-_1-7-2014

  • 19th: FOMC meeting – If the Fed sticks to its current communications plan, March 19, 2014 will be Janet Yellen’s first press conference as Fed Chairwoman. As noted above, we expect Yellen to continue to enhance the Fed’s transparency over the course of 2014.
  • 31st: Start of the 58th month of the economic expansion that began in July 2009 – As noted in our Outlook 2014 publication, since the end of WWII, the average economic expansion has lasted 58 months [Figure 3]. Looking back over the past 50 years, the average expansion has been 71 months. On that basis, the current recovery has another two years to go (2014 and 2015) just to get to “average.” The best comparison, however, may be the three economic expansions since the end of the inflationary 1970s, a period that has seen the transformation of the U.S. economy from a domestically focused, manufacturing economy to a more exportheavy, service-based economy. In general, this economic structure is less prone to inventory swings that drove the shorter boom-bust cycles of the past. On average, the last three expansions — the ones that began in 1982, 1991, and 2001 — lasted 95 months, or roughly eight years. Using those three expansions as the standard, the current economic expansion would merely be at its midpoint at the end of March 2014. The rather tepid pace of this expansion relative to prior expansions that lasted this long also supports the idea that we are close to the middle of the expansion, rather than the end.

Figure_3_-_1-7-2014

_____________________________________________________________________________________________________________________________

IMPORTANT DISCLOSURES

The opinions voiced in this material are for general information only and are not intended to provide specific advice or recommendations for any individual. To determine which  investment(s) may be appropriate for you, consult your financial advisor prior to investing. All performance reference is historical and is no guarantee of future results. All indices are unmanaged and cannot be invested into directly.

The economic forecasts set forth in the presentation may not develop as predicted and there can be no guarantee that strategies promoted will be successful.

Stock investing involves risk including loss of principal.

The Federal Open Market Committee (FOMC), a committee within the Federal Reserve System, is charged under the United States law with overseeing the nation’s open market operations (i.e., the Fed’s buying and selling of U.S. Treasury securities).

Quantitative easing is a government monetary policy occasionally used to increase the money supply by buying government securities or other securities from the market. Quantitative easing increases the money supply by flooding financial institutions with capital in an effort to promote increased lending and liquidity.

Tapering refers to the Federal Reserve (Fed) slowing the pace of bond purchases in their Quantitative Easing (QE) program. To execute QE, the Fed purchases a set amount of Treasury and Mortgage-Backed bonds each month from banks. This inserts more money in the economy (known as easing), which is intended to encourage economic growth. Lowering the amount of purchases (tapering) would indicate less easing of monetary policy.

_____________________________________________________________________________________________________________________________

This research material has been prepared by LPL Financial.

To the extent you are receiving investment advice from a separately registered independent investment advisor, please note that LPL Financial is not an affiliate of and makes no representation with respect to such entity.

Not FDIC/NCUA Insured | Not Bank/Credit Union Guaranteed | May Lose Value | Not Guaranteed by any Government Agency | Not a Bank/Credit Union Deposit

Member FINRA/SIPC