Archive for the ‘Confidence’ Category

Beige Book: Window on Main Street
July 23, 2013

Unseasonable Weather Still Weighing on the Economy

The latest edition of the Federal Reserve’s (Fed) Beige Book, released on July 17, 2013, described the economy as increasing at a modest-to- moderate pace, with little wage or inflation pressures. Housing and commercial real estate were mentioned as key drivers of growth. The report, along with comments made by Fed Chairman Ben Bernanke at his semi-annual Monetary Policy Testimony to Congress last week (July 15 – 19), suggest that the Fed is still on track to begin scaling back its quantitative easing (QE) program this fall, but that it remains a long way from tightening monetary policy by raising its fed funds rate target.

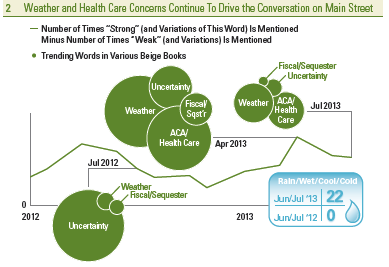
In order to provide one snapshot of the entire Beige Book collage of data, we created our proprietary Beige Book Barometer (BBB) [Figure 1]. The barometer ticked down to +79 in July 2013, from +82 last  month. The April 2013 reading was +112. Despite the downtick since April, the BBB remains well above its Superstorm Sandy-related dip to +30 in November 2012. Note that the April 2013 reading (+112) was  both a post-Great Recession high and also the highest reading since 2005, suggesting a broadening and deepening of the economic expansion. The move down to +79 from +112 between the April and July 2013 editions of the Beige Books came as the number of positive words dropped and the number of negative words hit a fresh seven year low in July 2013. The drop in the number of negative words in the Beige Book to a seven-year low can be viewed as reflecting the diminishing pace of headwinds (e.g., fiscal policy, Europe, China, housing) that have hampered the U.S. economic recovery over the past four years.

2013-07-24_Figure_1

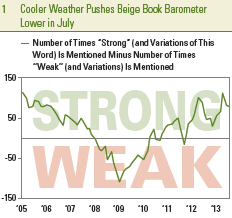
Our BBB, a diffusion index that measures the number of times the word “strong” or its variations (stronger, strength, strengthen, etc.) appear in the Beige Book less the number of times the word “weak” or its variations (weaken, weaker, etc.) appear, is displayed in Figure 1. The barometer is an easy-to-use, quantitative way to derive the shades between strong and weak in the predominately qualitative Beige Book report.

Headwinds From Fiscal Policy Diminish

The word “fiscal” appeared just four times in the latest Beige Book, down from five in June 2013, and 12 in April. There were 17 mentions in the March 2013 Beige Book, and a whopping 38 in the January 2013 edition. Because of the timing of the collection of comments for the January 2013 Beige Book (comments from contacts in the business and banking community were collected throughout December 2012 and during the first few days of January 2013), we noted that with 38 mentions of the word “fiscal,” the January 2013 Beige Book likely overstated the impact of the fiscal cliff on economic activity in early 2013.

2013-07-24_Figure_2

At the start of 2013, as Congress passed legislation to avoid the worst case scenario of the fiscal cliff, but allowed the sequester (i.e., government spending cuts prescribed in the debt ceiling agreement reached in 2011) to proceed, we expected that the word “sequester” would start to appear more often in the Beige Book. Thus far, however, that has not been the case. The word sequester was not used at all in the latest two Beige Books (July and June 2013) and appeared just once in the April 2013 Beige Book. Mentions of budget or budget cuts have been almost non-existent in the recent Beige Books as well. Looking ahead, we still expect the word sequester (or related words) to show up in the next several Beige Books, but with the debt ceiling debate and possible government shutdown now pushed back until late 2013, fiscal uncertainty outside of the impact of the sequester will likely continue to fade in upcoming Beige Books. The peak of the impact of the sequester will likely be felt in the recently completed second quarter and third (current) quarter of 2013.

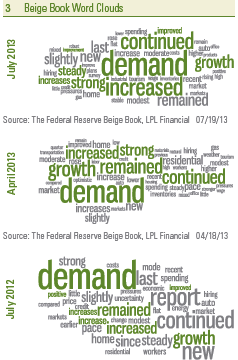
Word Clouds Show Unseasonably Cool Weather and Growing Concern About Impact of Health Care Reform Still Acting as Headwinds

The word clouds in Figure 3 are dominated by words describing the tone of the economy when the Beige Books were published. Below are some observations on the current Beige Book (released on July 17, 2013) relative to other recent editions of the Beige Book.

2013-07-24_Figure_3

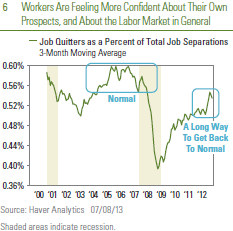
  • In the last two Beige Books (June and July 2013), the word “weather” appeared a total of 43 times, 27 times in the June 2013 edition of the Beige Book, and 16 times in the July 2013 version. The 43 mentions were nearly double the 24 mentions of weather in the same two Beige Books in June and July 2012. All but a few of the mentions of weather in the last two (June and July 2013) were in a negative context. The words rain, wet, cool, and cold appeared a total of 22 times in the June and July 2013 Beige Books. These words did not appear at all in the June and July 2012 Beige Books. This helps to explain, in part, the poor U.S. economic data reports — both on an absolute basis and relative to expectations — for much of the spring (March, April, May, and early June), especially in housing. In corporate earnings reports for the second quarter (April, May, and June 2013), managements in the housing construction, lodging, and leisure and hospitality industries have also mentioned unseasonably cold and wet weather as having a negative impact on results. The key takeaway here is that a return to “normal” weather could provide a significant lift to weather-sensitive portions of the economy and to upcoming readings on our BBB. Indeed, the first three weeks of July 2013 have generally seen warmer-than-usual temperatures and less-than-usual amounts of rainfall across the nation.
  • In the Beige Books released in late November 2012 and early January 2013, economic uncertainty surrounding the fiscal cliff and the rebound from the economic disruption wrought by Superstorm Sandy dominated. Sandy and the fiscal cliff have since faded as concerns, and uncertainty has faded a bit as well. There were just seven mentions of the word “uncertain” in the July 2013 Beige Book, down from 13 in the June Beige Book. It was used 26 times in March 2013, and 43 in January 2013. The seven mentions of uncertain in the June 2013 Beige Book were the fewest since June 2011.
  • The word “confidence” appeared just nine times in the latest Beige Book, 10 times in the June 2013 Beige Book, seven times in the April 2013 Beige Book, and 11 times in the March 2013 Beige Book. However, unlike in 2011 and most of 2012, when the word was used in a negative context (i.e., lack of confidence, weak confidence), most of the mentions of the word confidence in the Beige Book have been in a positive context. Eight of the nine mentions in July, nine of the 10 mentions in June, five of the seven mentions in April, and nine of the 11 mentions in the March 2013 Beige Book were in a positive context. Thus, over the past few Beige Books since Superstorm Sandy, business and banking contacts have generally become more confident in the recovery, especially in housing. This suggests that a sustained, multi-year recovery in the housing market is likely underway.
  • Although the number of mentions of “health care,” “health insurance,” and the “Affordable Care Act” (ACA) totaled just 15 in the latest Beige Book, heath care remains a major issue for Main Street as the ACA begins to be implemented. Health care, health insurance, and the Affordable Care Act were mentioned 28 times in June 2013, 26 times in April, and 18 times in the March 2013 Beige Book. The topic warranted just eight mentions in the January 2013 Beige Book. In contrast, those words were found just a handful of times in the Beige Book released a year ago (June and July 2012). We will continue to monitor these health care words closely in the upcoming Beige Books, as the economy continues to adjust to the impact of the ACA. We expect this set of words to grow in importance in the coming months.
  • There were just three mentions of Europe in the latest Beige Book, down from eight mentions in the June 2013 Beige Book. Europe was mentioned nine times in the April 2013 edition of the Beige Book. The three mentions of Europe in July 2013 were the fewest since October 2012, and well below the 15 – 20 mentions seen in the summer and fall of 2012, as Europe struggled through elections in Greece and increased fears of a break-up. Not surprisingly, nearly all of the mentions of Europe in the latest Beige Book were in a negative context. Perhaps business and banking contacts on Main Street are not as exposed to Europe as some of the larger businesses and financial institutions on Wall Street are that dominate media coverage. But it is also worth noting that the European debt crisis is well into its fourth year, and Main Street may be getting used to it now. The relatively few mentions of Europe are consistent with our view that the European economy has probably stopped getting worse, even though it may not accelerate anytime soon.
  • Despite the well-publicized slowdown in China’s economy in the second quarter of 2013, the concerns around an overheated Chinese property market, and a sudden rise in overnight borrowing costs in China, China warranted just two mentions in the latest Beige Book, down from three mentions each in the April and June 2013 Beige Books. The Beige Book suggests that while China has not entirely disappeared from Main Street’s radar, it is far less of a concern than the media makes it out to be. Indeed, the last time China warranted as many as six mentions in the Beige Book was in January 2012, as fears of a “hard landing” in China began to gather steam. The Chinese economy appeared to have bottomed out in late 2012, avoiding a “hard landing,” but recent data in China suggest that it has not re-accelerated as quickly as some market participants hoped.

___________________________________________________________________________________________________________________________________

IMPORTANT DISCLOSURES

The opinions voiced in this material are for general information only and are not intended to provide specific advice or recommendations for any individual. To determine which investment(s) may be appropriate for you, consult your financial advisor prior to investing. All performance reference is historical and is no guarantee of future results. All indices are unmanaged and cannot be invested into directly.

Gross domestic product (GDP) is the monetary value of all the finished goods and services produced within a country’s borders in a specific time period, though GDP is usually calculated on an annual basis. It includes all of private and public consumption, government outlays, investments and exports less imports that occur within a defined territory.

The economic forecasts set forth in the presentation may not develop as predicted and there can be no guarantee that strategies promoted will be successful.

Quantitative easing (QE) is a government monetary policy occasionally used to increase the money supply by buying government securities or other securities from the market. Quantitative easing increases the money supply by flooding financial institutions with capital in an effort to promote increased lending and liquidity.

The Federal Open Market Committee (FOMC), a committee within the Federal Reserve System, is charged under the United States law with overseeing the nation’s open market operations (i.e., the Fed’s buying and selling of United States Treasure securities).
_____________________________________________________________________________________________________________________________________

INDEX DESCRIPTIONS

Purchasing Managers’ Index (PMI) is an indicator of the economic health of the manufacturing sector. The PMI index is based on five major indicators: new orders, inventory levels, production, supplier deliveries and the employment environment.

Real and Sustainable: An Update
July 10, 2013

Real and Sustainable: An Update

Just prior to the release of the May 2013 employment, report, we wrote in our June 3, 2013, Weekly Economic Commentary: Real and Sustainable, that in the coming months:

“Federal Reserve (Fed) policymakers must decide if the recent pace of job creation-on average, the economy added 175,000 per month over the past year-and/or the drop in the unemployment rate (from 10.0% at the peak in 2010 and from 8.2% in May 2012) was ‘real and sustainable’ to warrant a tapering of QE.”

“Real and sustainable” was also a phrase used by Fed Chairman Ben Bernanke at his now (in)famous testimony before the Joint Economic Committee (JEC) of Congress on May 22, 2013. Answering a question about when the Fed would begin unwinding QE, Bernanke said:

“As the economic outlook and particularly the outlook for the labor market improves in a real and sustainable way, the committee will gradually reduce the flow of purchases.”

Bernanke used similar words answering questions at the press conference following the June 18 – 19 Federal Open Market Committee (FOMC) meeting.

Now, with both the May and June 2013 jobs reports, as well as the June FOMC Meeting and Fed Chairman Bernanke’s press conference in the rearview mirror, financial markets have largely embraced the notion that the Fed will begin tapering QE sometime this fall. Payroll employment in the private sector in both May and June 2013 exceeded expectations, and the job gains reported for April 2013 and May 2013 were revised markedly higher with the release of the June 2013 data. As a result, the private sector economy has added about 200,000 net new jobs per month over the past three, six, and 12 months [Figure 1]. It is pretty clear that the market, especially the bond market, thinks that adding 200,000 jobs per month is “real and sustainable.”

2013-07-10_Fig_1

Of course, Fed policymakers are not only looking at the number of private sector jobs being created each month. In early March 2013, FOMC Vice Chair Janet Yellen — who is a leading candidate to replace Bernanke as Fed Chairman in 2014 — said that she was looking at a number of indicators on the labor market and economy. These included:

  • The unemployment rate;
  • Payroll employment;
  • The hiring rate;
  • Layoffs/discharges as a share of total job separations;
  • ƒƒ The “quit” rate as a share of total job separations; and
  • Spending and growth in the economy.

Tracking the Labor Market: Not Quite There Yet

Figures 2 – 5 show the labor market indicators mentioned by Bernanke last week and Yellen in early March 2013. A quick review of the figures suggests that while job growth has been “real and sustainable,” several of the other key measures the Fed is monitoring are not yet sending the same signal. Yellen and Bernanke — two of the three FOMC members of the “center of gravity” at the Fed — are probably not yet ready to begin scaling back QE.

2013-07-10_Fig_2

  • While down from the peaks seen during the Great Recession of 2008 – 2009, the unemployment rate, at 7.6% in June 2013, remains well above the 6.5% threshold for raising rates, and also well above the 5.50 – 5.75% rate the FOMC forecasts as the new “normal” unemployment rate. In his prepared comments to the press just prior to his FOMC press conference on June 19, 2013, Bernanke said that QE would likely end in mid-2014, when the unemployment rate hits 7.0%.
  • The economy is now consistently creating 200,000 jobs per month, and has been over the past 12 months.

2013-07-10_Fig_3

  • At 3.6% in April 2013, the latest data available, the hiring rate — the level of new hiring as a percent of total employment measured from the Job Openings and Labor Turnover Survey (JOLTS) data remains depressed, and well below the 4.5 – 5.0% hire rate seen prior to the onset of the Great Recession in 2007. In her March 4, 2013 speech, Yellen noted, “the hiring rate remains depressed. Therefore, going forward, I would look for an increase in the rate of hiring.” The May JOLTS report is due out this Tuesday, July 9, 2013.
  • In that same speech, Yellen noted “layoffs and discharges as a share of total employment have already returned to their pre-recession level”. Indeed, Figure 4 shows that the discharge rate, at 1.2% in April 2013, is very close to an all-time low. A good proxy for this metric is the weekly readings on initial claims for unemployment insurance and the monthly Challenger layoff data, both of which continue to show that companies are reluctant to shed more workers at this point in the business cycle.

2013-07-10_Fig_4

2013-07-10_Fig_5

  • The quit rate measures the percentage of people who leave their jobs voluntarily, presumably because they are confident enough in their own skills — or in the health of the economy — to find another job. In the three months ending in April 2013 (the latest data available), 53% of the people who were separated from their jobs (laid off, fired, retired, or left voluntarily) were job quitters. This reading was just below the 54% readings in February and March 2013, which were the highest readings on this metric since mid- 2008. Even at 54%, this metric remains well below its pre-Great Recession norm of 56 – 60%. Commenting on this metric in her March 4, 2013 speech,  Yellen noted “a pickup in the quit rate, which also remains at a low level, would signal that workers perceive that their chances to be rehired are good — in other words, that labor demand has strengthened.”

2013-07-10_Fig_6

  • The final metrics mentioned by Yellen — consumer spending and overall economic growth — both remain well below average, and indeed still point to an economy that is still running at around two-thirds speed.

GDP and Jobs: Why the Disconnect?

Since the end of the 1981-82 recession, the economy has seen four periods when it has consistently created 200,000 or more private sector jobs per month:

  • Mid-1980s
  • Late 1980s
  • ƒƒ Mid-1990s through the end of the decade
  • ƒƒ Early 2006

On average, when the economy has consistently produced 200,000 jobs over a 12-month period, economic growth — as measured by growth in real gross domestic product (GDP) — has averaged between 4.5% and 5.0%. Today, the economy is struggling to grow at 2.0%, and our forecast is that growth is likely to be near 2.0% over the rest of 2013. What has caused the disconnect between job and GDP growth, and does better job growth mean better economic growth in the period ahead?

In general, the economy leads job growth, not the other way around. The timing of the economic recoveries and labor market recoveries over the past 20 years is helpful in illustrating this point. Coming out of the 2007 – 2009 Great Recession, the economy bottomed out in June 2009, while the labor market did not begin creating jobs regularly until spring 2010. The same pattern played out coming out of the mild recession in 2001. The recession ended in November 2001, but the economy did not begin to consistently create jobs until the summer of 2003. The 1990 – 91 recession ended in March 1991. The private sector economy did not begin creating jobs regularly until a year later, in the spring of 1992.

The recent disconnect between private sector job growth and the performance of the economy can be partially traced to several factors. First, the severity and composition of the Great Recession was unique in its scope, and recent financial-led recessions in other countries suggest that economies recover more slowly from recessions caused by severe financial crisis. Restrictive fiscal policy at both the federal and state and local levels is also a culprit of the disconnect between 200,000 per month job growth and an economy growing at only around 2.0%. In the first half of 2013, the economic drag from fiscal policy (less spending and higher taxes) likely shaved around 2.0% from GDP. In addition, the recession in Europe and the sharp slowdown in emerging markets have sharply curtailed our export growth, which in turn, puts downward pressure on GDP growth.

The bottom line is that job creation tends to lag the overall economy, and that the recent job gains likely do not portend stronger economic growth in the coming months. Any uptick in economic growth over the next few quarters would likely be the result of an easing of fiscal pressures or improvement in the economies in Europe and emerging market countries.

2013-07-10_Fig_7

Closer Look: Labor Market Surveys

  • A survey of 60,000 households nationwide — an incredibly large sample size for a national survey — generates the data set used to calculate the unemployment rate, the size of the labor force, part-time and full-time employment, the reasons for and duration of unemployment, employment status by age, educational attainment, and race. The “household survey” has been conducted essentially same way since 1940, and although it has been “modified” over the years, the basic framework of the data set has stayed the same. The last major modification to the data set (and to how the data is collected) came in 1994. To put a sample size of 60,000 households into perspective, nationwide polling firms typically poll around 1,000 people for their opinion on presidential races.
  • ƒƒThe headline unemployment rate (7.6% in June 2013) is calculated by dividing the number of unemployed (11.8 million in June 2013) by the number of people in the labor force (155.8 million). The civilian population over the age of 16 stood at 245.5 million in June 2013. A person is identified as being part of the labor force if they are over 16, have a job (employed), or do not have a job (unemployed) but are actively looking for work. A person is not in the labor force if they are neither employed nor unemployed. This category includes retired persons, students, those taking care of children or other family members, and others who are neither working nor seeking work.
  • ƒƒ In June 2013, the labor force was 155.8 million, which consists of 144 million  employed people and 11.8 million unemployed people. Another 89.7 million people over the age of 16 were classified as not in the labor force. The 155.8 million people in the labor force plus the 89.7 million people not in the labor force is equal to the civilian population over 16, 245.5 million.
  • The payroll job count data is culled from a survey of 440,000 business establishments across the country. The sample includes about 141,000 businesses and government agencies, which cover approximately 486,000 individual worksites drawn from a sampling frame of Unemployment Insurance (UI) tax accounts covering roughly 9 million establishments. The sample includes approximately one-third of all nonfarm payroll employees. From these data, a large number of employment, hours, and earnings series in considerable industry and geographic detail are prepared and published each month.

___________________________________________________________________________________

IMPORTANT DISCLOSURES
The opinions voiced in this material are for general information only and are not intended to provide specific advice or recommendations for any individual. To determine which investment(s) may be appropriate for you, consult your financial advisor prior to investing. All performance reference is historical and is no guarantee of future results. All indices are unmanaged and cannot be invested into directly.

Gross domestic product (GDP) is the monetary value of all the finished goods and services produced within a country’s borders in a specific time period, though GDP is usually calculated on an annual basis. It includes all of private and public consumption, government outlays, investments and exports less imports that occur within a defined territory.

The economic forecasts set forth in the presentation may not develop as predicted and there can be no guarantee that strategies promoted will be successful.

Stock investing involves risk including loss of principal.
The Federal Open Market Committee (FOMC), a committee within the Federal Reserve System, is charged under the United States law with overseeing the nation’s open market operations (i.e., the Fed’s buying and selling of United States Treasure securities).

Quantitative easing is a government monetary policy occasionally used to increase the money supply by buying government securities or other securities from the market. Quantitative easing increases the money supply by flooding financial institutions with capital in an effort to promote increased lending and liquidity.

___________________________________________________________________________________

This research material has been prepared by LPL Financial.

To the extent you are receiving investment advice from a separately registered independent investment advisor, please note that LPL Financial is not an affiliate of and makes no representation with respect to such entity.

Not FDIC/NCUA Insured | Not Bank/Credit Union Guaranteed | May Lose Value | Not Guaranteed by any Government Agency | Not a Bank/Credit Union Deposit

Member FINRA/SIPC

The Market’s March Madness
March 21, 2013

It has been a sweet sixteen weeks for the S&P 500. The broad stock market index has had only three down weeks out of the past sixteen. While
this stretch is tied by the same period a year ago, it is important to note that there has not been a sixteen-week period with fewer weeks of losses in
over 20 years — since the period ending September 1, 1989.

March has been maddening for investors in the past few years (2010 – 2012) as the S&P 500 raced higher in March only to reverse all of those gains in a pullback of about 10% that began in late March or April. It later took stocks at least five months to climb back to the peaks of March.

As the NCAA tournament gets down to its own sweet sixteen at the end of this week, it is a good time to reflect on the competing drivers of the markets that may make for an exciting showdown in the weeks and months to come.

March Madness Bracket

As we narrow down stocks’ “sweet sixteen” potential drivers this year, the four “regions” of market-moving factors vying for investor attention are: economy, policy, fundamentals, and market dynamics.

Economy

  • „Employment – Job growth has been picking up with more than 200,000 jobs created in three of the past four months and first-time filings for unemployment benefits have started to fall after stabilizing around 350,000 for over a year.
  • Housing – The powerfully rebounding housing market, as seen in data such as housing starts and building permits, is a positive for growth.
  • Confidence – Last week’s University of Michigan data showed that consumer confidence fell sharply in the preliminary reading for March to the lowest level in over a year.
  • Gasoline Prices – Retail gasoline prices are back up near the “danger zone” that coincided with stock market pullbacks in each of the past few years.

Policy

  • „Federal Reserve – “Don’t Fight the Fed” rally is intact, but as the Federal Reserve publicly contemplates ending the latest stimulus program, the stock market may suffer the same sell-off that surrounded the ending of prior quantitative easing programs, so-called QE1 and QE2.
  • Europe – With the Eurozone back in recession, an inconclusive election leaving no government in Italy, a political scandal hampering the ability to implement needed reforms in Spain, Greece unlikely to meet the terms of its own bailout, and Germany pushing hard terms on any aid ahead of its fall elections, the events in Cyprus could provide the catalyst for another Europe-driven spring slide in the world’s stock markets.
  • Geopolitics – The hot spots are heating up again given the power grab following the death of Chavez in Venezuela, the coming elections in Iran, different factions vying for power in war-torn Syria, and North Korea annulling its cease fire agreement.
  • Fiscal Cliff – A fiscal drag on gross domestic product (GDP) of about 2%, and showdowns over the continuing resolution funding the government and the debt ceiling still to come, may weigh on investor sentiment as the recently implemented sequester threatens to halt labor market improvement with an estimated cost of 750,000 jobs, according to the Congressional Budget Office.

Fundamentals

  • „Earnings – Earnings are the most fundamental of all drivers of stocks.  Earnings growth has been the most consistent factor driving the markets in recent years, but growth has now slowed to the low-single digits for S&P 500 companies.
  • Valuations – The price-to-earnings ratio of the S&P 500, at around 15 on the past four quarters’ earnings, is well below the 17 – 18 seen at the end of all prior bull markets since WWII.
  • Credit – Demand for credit has improved and credit spreads have

    narrowed; both trends are key supports to growth.

  • Corporate Cash – Strong cash balances provide a cheap source of

    capital to invest and incentive to buy back shares to boost earnings per s

    hare growth.

Market Dynamics

  • „Momentum – Stocks have been on a strong winning streak that could continue.
  • Volume – Trading volume in the markets has been light this year, 10 – 15% below last year, traditionally seen as a sign that a trend has become vulnerable.
  • Volatility – Investors have once again become net sellers of U.S. stock mutual funds in the past two weeks, according to data from the Investment Company Institute (ICI), despite strong and steady gains. A return to more volatile markets may further undermine individual investor support.
  • Interest Rates – Interest rates are on the rise, potentially acting as a drag on everything from housing to the U.S. budget, but from very low levels.

There are quite a few listed here, but these certainly are not all the factors that are influencing the markets.

The key message for investors in considering these factors is: don’t be too confident in any particular outcome. Respect the complexity of the situation. This is a time for caution and taking some profits, not for indiscriminate selling. It is a time to nibble at opportunities as they emerge; it is not a time to jump in with both feet.

Investing is not a game, but it is important also to remember that forecasting is not an exact science, and many factors can affect outcomes that are hard to predict. Two years ago, the Japanese earthquake had a big impact on markets and natural disasters — despite tremendous advances in technology — are very hard to predict with any degree of accuracy. Geopolitical outcomes can also be hard to foresee as we look to the stresses in the Middle East. For example, the outcome of the Arab Spring uprisings and the changes they have led to in countries including Syria and Egypt were hard to foresee. The markets rarely offer perfect clarity on their direction because they are driven by these factors as well as many others. Even this week’s NCAA March Madness can be seen as a reminder of how it can be notoriously hard to predict winners. Historically, a team’s ranking has meant nothing after getting down to the elite eight.

These factors will play out in the markets over the course of the year, not just in the coming weeks. This means there will likely be some upsets that result in volatility and pullbacks as these factors face off against each other. In the end, we expect a positive year with many opportunities for investors.

____________________________________________________________________________________________________________________________________________

IMPORTANT DISCLOSURES
The opinions voiced in this material are for general information only and are not intended to provide specific advice or recommendations for any individual. To determine which investment(s) may be appropriate for you, consult your financial advisor prior to investing. All performance reference is historical and is no guarantee of future results. All indices are unmanaged and cannot be invested into directly.

The economic forecasts set forth in the presentation may not develop as predicted and there can be no guarantee that strategies promoted will be successful.

Stock and mutual fund investing involves risk, including the risk of loss.

The Standard & Poor’s 500 Index is an unmanaged index, which cannot be invested into directly. Past performance is no guarantee of future results.

Quantitative easing is a government monetary policy occasionally used to increase the money supply by buying government securities or other securities from the market. Quantitative easing increases the money supply by flooding financial institutions with capital in an effort to promote increased lending and liquidity.

The Congressional Budget Office is a non-partisan arm of Congress, established in 1974, to provide Congress with non-partisan scoring of budget proposals.

The P/E ratio (price-to-earnings ratio) is a measure of the price paid for a share relative to the annual net income or profit earned by the firm per share. It is a financial ratio used for valuation: a higher P/E ratio means that investors are paying more for each unit of net income, so the stock is more expensive compared to one with lower P/E ratio.

Earnings per share (EPS) is the portion of a company’s profit allocated to each outstanding share of common stock. EPS serves as an indicator of a company’s profitability. Earnings per share is generally considered to be the single most important variable in determining a share’s price. It is also a major component used to calculate the price-to-earnings valuation ratio.
The Investment Company Institute (ICI) is the national association of U.S. investment companies, including mutual funds, closed-end funds, exchange-traded funds (ETFs) , and unit investment trusts (UITs). Members of ICI manage total assets of $11.18 trillion and serve nearly 90 million shareholders.

The credit spread is the yield the corporate bonds less the yield on comparable maturity Treasury debt. This is a market-based estimate of the amount of fear in the bond market Bass-rated bonds are the lowest quality bonds that are considered investment-grade, rather than high-yield. They best reflect the stresses across the quality spectrum.

International and emerging market investing involves special risks such as currency fluctuation and political instability and may not be suitable for all investors.

____________________________________________________________________________________________________________________________________________

INDEX DESCRIPTIONS
The Standard & Poor’s 500 Index is a capitalization-weighted index of 500 stocks designed to measure performance of the broad domestic economy through changes in the aggregate market value of 500 stocks representing all major industries.

____________________________________________________________________________________________________________________________________________
„This research material has been prepared by LPL Financial.

To the extent you are receiving investment advice from a separately registered independent investment advisor, please note that LPL Financial is not
an affiliate of and makes no representation with respect to such entity.

Not FDIC or NCUA/NCUSIF Insured | No Bank or Credit Union Guarantee | May Lose Value | Not Guaranteed by any Government Agency | Not a Bank/Credit Union Deposit