After a bounce on the relief from the fiscal cliff deal that took place on New Year’s Day, the stock market has been in a sideways holding pattern. Investors are waiting to see if there was some collateral damage from the battle over the fiscal cliff. This week, we will begin to see if any damage was done to corporate profits in the fourth quarter of 2012.
Macroeconomic factors have been the key driver of the market lately, but microeconomics will begin to garner investors’ attention in the coming weeks as companies begin to release their fourth quarter earnings reports. Four times a year, investors focus on the most fundamental driver of investment performance: earnings. While only a handful of S&P 500 companies report fourth quarter 2012 results this week, earnings reports will be issued from big U.S. companies including Alcoa, Constellation Brands, Monsanto, and Wells Fargo, among others as the fourth quarter earnings season kicks off.
While the fiscal cliff battle ultimately ended in a modest deal to avert some of the worst consequences to the economy, the related caution, contingency planning, special dividend distributions, and other distractions may have restrained business results. There is some reason to believe the fiscal cliff issues may have had some impact. While Friday’s (January 4, 2013) employment report for December 2012 reflected another month of modest job growth and broad economic indicators show little measurable effect of the concern over the fiscal cliff, we saw weak business investment act as a drag on growth in the third quarter of 2012. This generally extended into the fourth quarter as corporate leaders were more likely to sit on cash, or return it to shareholders in the form of dividends and share buybacks, rather than make longer term commitments by increasing capital expenditures or ramping up hiring. For example, new orders for business investment were only up 0.5% year-over-year in November 2012, according to the latest U.S. Commerce Department data. Excluding transportation equipment, orders for business spending were flat.
Expectations for profit growth among S&P 500 companies in the fourth quarter of 2012 are down to about 3% year-over-year, sharply lower than the 10% growth expected at the start of the quarter. While the estimates are now in line with our long-held outlook*, two sectors are expected to provide double-digit gains and may still present some risk of disappointment [Figure 1].
- The strong gains in the consumer discretionary sector — largely driven by strong demand for autos and housing — may be at risk due to disappointing retail sales reported during the holiday shopping season as consumers fretted over tax increases.
- The strong performance by financial stocks backed by similarly strong earnings growth — driven by mortgage lending, securities gains, and cost cutting at the big diversified financial services companies — may be at risk with relatively weak demand for credit, low interest rates along a flat yield curve, and large insurance losses.
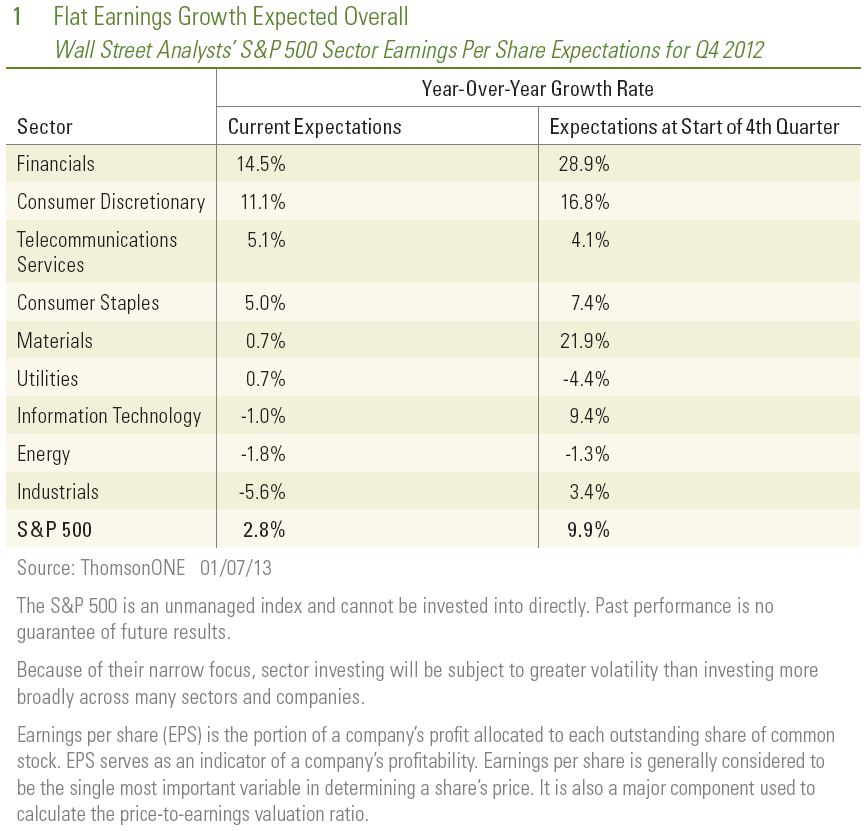
On the other hand, the industrials sector — expected to post the biggest year-over-year earnings decline (-5.6%) among S&P 500 sectors, may offer
the potential for an upside surprise. Industrial production has been solid and exceeded economists’ estimates in the latest data reported for November 2012. Also, in the jobs report for December 2012 released on Friday, January 4, 2013, manufacturing job growth turned much more positive after weak numbers in the prior four months. Renewed hiring among industrial companies may be a sign of confidence by management in the recently improving trend.
Wall Street analysts‘ consensus forecast of S&P 500 earnings per share for the fourth quarter of 2012 is $25.56. If accurate, this will be the lowest quarterly total for earnings per share in 2012. This is unusual; fourth quarter profits during a year of growth are typically the highest of the year. While this week – the week that Alcoa reports its earnings — is most often referred to as the start of the reporting season, some companies have already provided their fourth quarter numbers and confirmed a soft environment for profits. For example, FedEx Corporation reported in mid-December 2012 and missed expectations, posting a 12% decline from a year ago, reflecting a weak global economic backdrop and the impact of Superstorm Sandy.
While the results reported for the fourth quarter are important in measuring the impact of the fiscal cliff battle, so will the profit guidance for the coming quarters provided by corporate leaders. Earnings per share for 2012 are expected to end up 3.7% above the total for 2011. We expect another year of lackluster profit growth again in 2013. However, the consensus of Wall Street analysts’ expectations is for 10% growth. The coming weeks may provide insight on the trajectory of profits in 2013.
The focus on microeconomic data in the coming weeks leads us to expect a relatively range-bound market in the near term. However, when the earnings season winds down in February 2013, the fiscal cliff battle part II may emerge as we approach the limit on U.S. borrowing authority, known as the debt ceiling, along with the end of the delay to the spending sequester on February 28 and funding of the U.S. government on March 27. These factors may weigh on the confidence of business leaders to employ capital in the first quarter and extend the sluggish profit environment.
IMPORTANT DISCLOSURES
The opinions voiced in this material are for general information only and are not intended to provide specific advice or recommendations for any individual. To determine which investment(s) may be appropriate for you, consult your financial advisor prior to investing. All performance reference is historical and is no guarantee of future results. All indices are unmanaged and cannot be invested into directly.
The economic forecasts set forth in the presentation may not develop as predicted and there can be no guarantee that strategies promoted will be successful.
Stock investing involves risk, including the risk of loss.
Consumer Discretionary Sector: Companies that tend to be the most sensitive to economic cycles. Its manufacturing segment includes automotive, household durable goods, textiles and apparel, and leisure equipment. The service segment includes hotels, restaurants and other leisure facilities, media production and services, consumer retailing and services and education services.
Consumer Staples Sector: Companies whose businesses are less sensitive to economic cycles. It includes manufacturers and distributors of food, beverages and tobacco, and producers of non-durable household goods and personal products. It also includes food and drug retailing companies.
Energy Sector: Companies whose businesses are dominated by either of the following activities: The construction or provision of oil rigs, drilling equipment and other energy-related service and equipment, including seismic data collection. The exploration, production, marketing, refining and/or transportation of oil and gas products, coal and consumable fuels.
Financials Sector: Companies involved in activities such as banking, consumer finance, investment banking and brokerage, asset management, insurance and investment, and real estate, including REITs.
Industrials Sector: Companies whose businesses manufacture and distribute capital goods, including aerospace and defense, construction, engineering and building products, electrical equipment and industrial machinery. Provide commercial services and supplies, including printing, employment, environmental and office services. Provide transportation services, including airlines, couriers, marine, road and rail, and transportation infrastructure.
Materials Sector: Companies that are engaged in a wide range of commodity-related manufacturing. Included in this sector are companies that manufacture chemicals, construction materials, glass, paper, forest products and related packaging products, metals, minerals and mining companies, including producers of steel.
Information Technology: Companies include those that primarily develop software in various fields such as the Internet, applications, systems and/or database management and companies that provide information technology consulting and services; technology hardware & Equipment, including manufacturers and distributors of communications equipment, computers and peripherals, electronic equipment and related instruments, and semiconductor equipment and products.
Telecommunications Services Sector: Companies that provide communications services primarily through a fixed line, cellular, wireless, high bandwidth and/or fiber-optic cable network.
Utilities Sector: Companies considered electric, gas or water utilities, or companies that operate as independent producers and/or distributors of power.
Earnings per share (EPS) is the portion of a company’s profit allocated to each outstanding share of common stock. EPS serves as an indicator of a company’s profitability. Earnings per share is generally considered to be the single most important variable in determining a share’s price. It is also a major component used to calculate the price-to-earnings valuation ratio.
INDEX DEFINITIONS:
The Standard & Poor’s 500 Index is a capitalization-weighted index of 500 stocks designed to measure
performance of the broad domestic economy through changes in the aggregate market value of 500 stocks
representing all major industries.
This research material has been prepared by LPL Financial.
To the extent you are receiving investment advice from a separately registered independent investment advisor, please note that LPL Financial is not an affiliate of and makes no representation with respect to such entity.
Not FDIC or NCUA/NCUSIF Insured | No Bank or Credit Union Guarantee | May Lose Value | Not Guaranteed by any Government Agency | Not a Bank/Credit Union Deposit


