Weekly Market Commentary from Garrett and Robinson
Modest Expansion
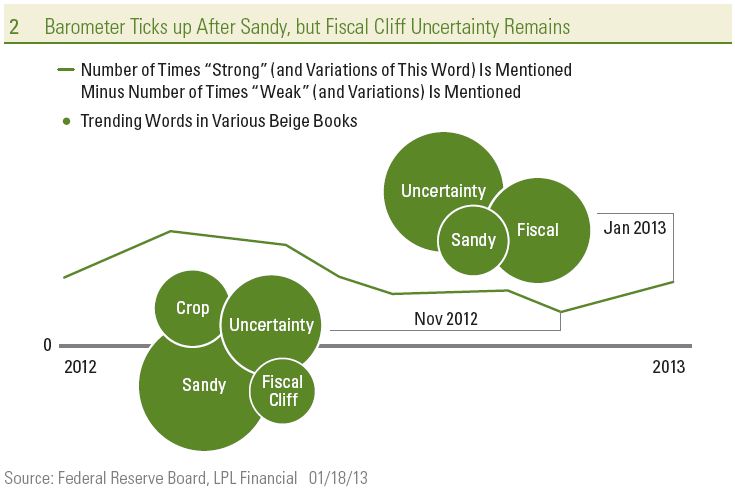
Despite elevated levels of uncertainty surrounding the debate over the fiscal cliff in December 2012 and in the first few days of January 2013, our proprietary “Beige Book Barometer” moved up to +56 in January 2013, rebounding from a Superstorm Sandy-related dip to +30 in November 2012. Still, our Barometer remains well below its recent high of +101, hit in April 2012. The improvement in our barometer between November 2012 and January 2013 was largely the result of a drop in the number of negative words in the Beige Book; there was only a modest change in the number of positive words in the Beige Book between November 2012 and January 2013. Our Barometer, a diffusion index that measures the number of times the word “strong” or its variations (stronger, strength, strengthen, etc.) appear in the Beige Book less the number of times the word “weak” or its variations (weaken, weaker, etc.) appear, is displayed in Figure 2. The barometer is an effective, quantitative way to derive the shades between strong and weak in the predominately qualitative Beige Book report.
Bouncing Back From the Fiscal Cliff and Sandy
 When we last wrote about the Beige Book in early December 2012, we noted that despite the tepid reading of our Barometer in November 2012 (+30), there was some reason for modest optimism on the economic outlook. First, the Barometer generally suggested the economy was stronger heading into the debate around the fiscal cliff and Sandy in the summer and fall of 2012 than it was in early 2011, ahead of the bruising debt ceiling debate. In addition, many of the factors that weighed on our Barometer in November 2012 appeared to be temporary. Indeed, with key indicators like consumer sentiment hitting a five-year high and initial claims for unemployment benefits hitting a five-year low in late 2012, the U.S. economy is now on a firmer footing than it was in the summer and fall of 2011. A big driver of the uncertainty in the November 2012 Beige Book was Superstorm Sandy, which had 48 mentions, and virtually all of the mentions were associated with disruptions to economic activity.
In contrast, nearly every one of the 25 mentions of Sandy in January 2013 was associated with a rebound in, or resumption of, economic activity that was disrupted by the storm in late 2012. Because of the timing of the collection of comments for the January 2013 Beige Book (comments from contacts in the business and banking community were collected throughout December 2012 and in the first few days of January 2013), the latest Beige Book likely overstated the impact of the fiscal cliff on economic activity in early 2013. However, there were 38 mentions of the word “fiscal” in the January 2013 Beige Book, and almost every mention was accompanied by a word like “uncertainty.” Clearly, the uncertainty was a drag on economic activity among consumers and businesses alike as 2012 drew to a close.
While the fiscal cliff debate and the impact of Sandy may be temporary, though significant, other more persistent factors have weighed on the Barometer since it peaked in April 2012. The ongoing recession in Europe, the economic slowdown in China, the severe damage to the agricultural economy as a result of the drought, and a return to “normal” weather all helped to push the Beige Book Barometer down from +101 in April 2012 to around +50 over the summer of 2012.
Even if the uncertainty surrounding the fiscal cliff and the disruptions caused by Sandy reversed, and our Barometer returned to the +60 range seen over the spring and summer of 2012, it would still remain below the range seen in 2005 and 2006, the years just prior to the Great Recession. In short, the Beige Book Barometer is consistent with other more quantitative metrics on the U.S. economy that suggest that the economy is in recovery, and growing at around 2.0% (as measured by gross domestic product [GDP]) but is still not back to “normal,” where normal is defined as the pre- Great Recession years of 2005 – 2006, where real GDP growth averaged between 2.5% and 3.0%.
Word Clouds Show Modest Expansion
The nearby word clouds are dominated by words describing the tone of the economy when the Beige Books were published. Below are some observations on the current Beige Book (released on January 16, 2013) relative to other recent editions of the Beige Book.
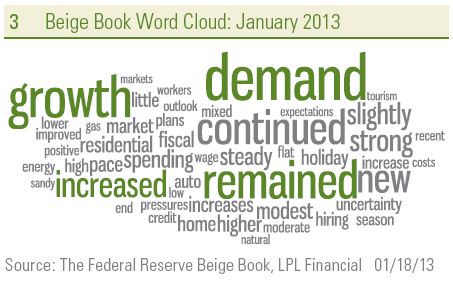
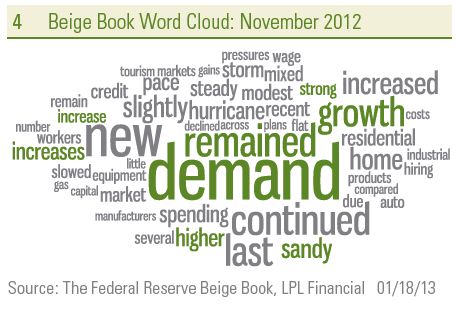
- The economy is expanding at a modest pace, perhaps a step up from the measured pace seen in November 2012, representing a rebound in activity after the disruption caused by Superstorm Sandy.
- The latest Beige Book was dominated by uncertainty surrounding the fiscal cliff and the rebound from the economic disruption wrought by Superstorm Sandy. There were 43 mentions of “uncertainty,” 25 of “Sandy,” and 38 of “fiscal” in the January 2013 Beige Book.
- The word “confidence,” which was used 11 times in the September 2011 Beige Book amid the worst of the situation in Europe, appeared just five times in the latest Beige Book. During the summer and fall of 2011, the word confidence appeared an average of eight times in each Beige Book. Increased uncertainty (Sandy and fiscal cliff), rather than lack of economic confidence, seems to best describe the current economic environment on Main Street in late 2012/early 2013.
- The lack of rain and concerns over the drought in the midsection of the United States made another significant appearance in the latest Beige Book, although these concerns have faded in recent Beige Books. The word “drought” was mentioned 11 times in January 2013, 18 times in November 2012, 19 times in October 2012, and 22 times in August 2012. Drought warranted only a handful of mentions in the Beige Books released in late 2011 and early 2012. The word “crop” was mentioned 16 times in the January 2013 Beige Book after 20 mentions in the November 2012 Beige Book. Crop warranted 26 mentions in October 2012 and 22 in August 2012. A look back to the Beige Books of a year ago (July 2011 through January 2012) finds that drought was also a concern (mentioned 37 times in those four Beige Books). However, in the last five Beige Books (July 2012 through January 2013), the word drought appeared 73 times. Looking ahead, we would expect drought and the damage to crops due to the lack of rain this past summer in the Midwest to continue to impact the Beige Book in the coming months, and the economy could begin to see higher prices for some foods as soon as this spring.
- For the first time since the February 2012 Beige Book, China received no mentions in the Beige Book. Over the course of 2012, the financial media was chock full of stories on the economic slowdown in China and the recession and debt crisis in Europe. The Beige Book suggests that while those issues have not entirely disappeared from Main Street’s radar, they are far less of a concern than the media makes them out to be. China had no mentions in the latest Beige Book, two in the November 2012 Beige Book, and just one mention in the August 2012 and October 2012 Beige Books. The recent peak for mentions of China was six in the January 2012 Beige Book. The Chinese economy appeared to have bottomed out in late 2012, avoiding a “hard landing.” The recent data suggest that China’s economy is re-accelerating as 2013 begins.
- There were just eight mentions of Europe in the latest Beige Book, up from seven in November 2012, but down from 12 in October 2012 and 20 in August 2012. Not surprisingly, all of the mentions of Europe in the latest Beige Book were in a negative context. Perhaps business and banking contacts on Main Street are not as exposed to Europe as some of the larger businesses and financial institutions on Wall Street that dominate media coverage. But it is also worth noting that the European debt crisis is in its fourth year, and Main Street may be getting used to it now.
_____________________________________________________________________________________________________________
IMPORTANT DISCLOSURES
The opinions voiced in this material are for general information only and are not intended to provide specific advice or recommendations for any individual. To determine which investment(s) may be appropriate for you, consult your financial advisor prior to investing. All performance reference is historical and is no guarantee of future results. All indices are unmanaged and cannot be invested into directly.
* Gross Domestic Product (GDP) is the monetary value of all the finished goods and services produced within a country’s borders in a specific time period, though GDP is usually calculated on an annual basis. It includes all of private and public consumption, government outlays, investments and exports less imports that occur within a defined territory.
^ Federal Funds Rate is the interest rate at which depository institutions actively trade balances held at the Federal Reserve, called federal funds, with each other, usually overnight, on an uncollateralized basis.
† Private Sector – the total nonfarm payroll accounts for approximately 80% of the workers who produce the entire gross domestic product of the United States. The nonfarm payroll statistic is reported monthly, on the first Friday of the month, and is used to assist government policy makers and economists determine the current state of the economy and predict future levels of economic activity. It doesn’t include:
- general government employees
- private household employees
- employees of nonprofit organizations that provide assistance to individuals
- farm employees
The economic forecasts set forth in the presentation may not develop as predicted and there can be no guarantee that strategies promoted will be successful. Stock investing involves risk including loss of principal. International investing involves special risks, such as currency fluctuation and political instability, nd may not be suitable for all investors.
The Federal Open Market Committee action known as Operation Twist began in 1961. The intent was to flatten the yield curve in order to promote capital inflows and strengthen the dollar. The Fed utilized open market operations to shorten the maturity of public debt in the open market. The action has subsequently been reexamined in isolation and found to have been more effective than originally thought. As a result of this reappraisal, similar action has been suggested as an alternative to quantitative easing by central banks.
The Federal Open Market Committee (FOMC), a committee within the Federal Reserve System, is charged under the United States law with overseeing the nation’s open market operations (i.e., the Fed’s buying and selling of United States Treasure securities).
The index of leading economic indicators (LEI) is an economic variable, such as private-sector wages, that tends to show the direction of future economic activity.
International Monetary Fund (IMF) is an international organization created for the purpose of promoting global monetary and exchange stability, facilitating the expansion and balanced growth of international trade, and assisting in the establishment of a multilateral system of payments for current transactions.
_____________________________________________________________________________________________________________
INDEX DESCRIPTIONS
Purchasing Managers Index (PMI) is an indicator of the economic health of the manufacturing sector. The PMI index is based on five major indicators: new orders, inventory levels, production, supplier deliveries and the employment environment.
The Richmond Manufacturing Index is a composite index that represents a weighted average of the shipments, new orders and employment indexes. Each index is a diffusion index, i.e., it is equal to the percentage of responding firms reporting increases minus the percentage reporting decreases, with results based on responses from 80 out of 110 firms surveyed.
This research material has been prepared by LPL Financial.
To the extent you are receiving investment advice from a separately registered independent investment advisor, please note that LPL Financial is
not an affiliate of and makes no representation with respect to such entity.
Not FDIC/NCUA Insured | Not Bank/Credit Union Guaranteed | May Lose Value | Not Guaranteed by any Government Agency | Not a Bank/Credit Union Deposit
Member FINRA/SIPC
