Archive for the ‘Gasoline Prices’ Category

The Rest of 2013
November 19, 2013

The LPL Financial Research Outlook 2014 comes out next week, so this week is a great opportunity to take a shorter-term look at the rest of 2013. It has been an amazing year for stock market investors with the strongest gain in a decade and a record for the annual outperformance of stocks over bonds, measured by the S&P 500 Index and the Barclays Aggregate Bond Index since its inception in 1976. But it may get even better. After all, November marks the turn in the calendar to what has been the best six months of the year for equity markets, on average, following the weakest six-month period from May to October, whose start is marked by the adage, “Sell in May and go away.” In fact, the S&P 500 has been up 20% by the start of November seven times since WWII. Every time, the index has always added to those gains — by an average of 6%.

What may drive additional gains? The market will focus on several things:  holiday shopping, seasonal patterns, and the December Federal Reserve (Fed) meeting.

Holiday Shopping

As Black Friday approaches, market participants turn their attention to holiday shopping as a barometer of the health of the economy and as an indicator for potential leadership by the companies in the consumer discretionary sector.

The National Retail Federation projects 2013 holiday sales to rise 3.9% this year, slightly ahead of last year’s 3.5% increase. We believe this expectation for a close-to-average year  holiday sales have increased 3.3%, on average, for the last 10 years) will likely be exceeded for a few reasons:

  • The wealth effect.   History shows that this year’s gain for the S&P 500 suggests a high-single-digit gain for retail sales [Figure 1]. When people feel wealthier, they tend to spend more. Adding to this wealth effect, home prices are up double digits too.
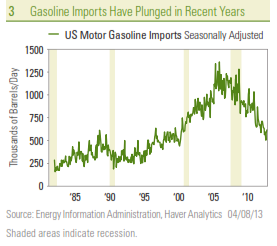
  • More discretionary income.  Gasoline prices are down by about 5 – 10% from last year, and 1.3 million more people have full-time jobs than a year ago, according to the Bureau of Labor Statistics.
  • Fading drags.  We are starting to see a rebound in weekly retail sales from the shutdown-induced stall in October. And the year-over-year comparisons will benefit from the November 2012 impact of Superstorm Sandy.

Figure_1

Seasonal Patterns

End-of-year seasonal patterns are frequently a focus of market participants due to the tendency of fund managers and individuals to tidy up portfolios for tax and other reasons around year end. However, there is not likely to be much tax loss selling this year, given the broad and powerful gains, but we can expect a lot of capital gains distributions from funds that could prompt some volatility.

The “January effect” of outperformance by smaller company stocks has tended to start in mid-December in recent years after they have been dumped for tax loss selling and other reasons.

But what may lead the market higher? Based on the above analysis, it could be the consumer discretionary sector. This sector typically has a pretty consistent pattern of outperformance in November and December. The industrials sector also tends to outperform historically, while financials and energy tend to lag.

Fed Meeting

The Fed meeting on December 17 – 18 may be the biggest event during the rest of 2013, and it will be closely watched by market participants. Although it is a long shot that the Fed will announce tapering its bond-buying program at that meeting, the statement, accompanying economic projections, and press conference will be scrutinized for insights regarding whether tapering will begin in January, March, or beyond.

Bond yields may rise in response to improving economic data ahead of the meeting, continuing the slow-but-steady rise in yield from the 2.5% on the 10-year Treasury seen in late October. However, we are unlikely to see a sharp rise that would have a strong negative impact on the stock market.

A Strong Close

A strong close to a strong year may be in store for stocks. A pass on tapering by the Fed may boost stocks headed into year-end, meaning the S&P 500 finishes the year with a “Santa Claus rally” — the tendency for the stock market to post gains between Christmas and New Year’s Day, a period that has averaged a 1.5% return since WWII.

______________________________________________________________________________________________________________________________

IMPORTANT DISCLOSURES

The opinions voiced in this material are for general information only and are not intended to provide specific advice or recommendations for any individual. To determine which  investment(s) may be appropriate for you, consult your financial advisor prior to investing. All performance reference is historical and is no guarantee of future results. All indices are unmanaged and cannot be invested into directly. Unmanaged index returns do not reflect fees, expenses, or sales charges. Index performance is not indicative of the performance of any investment. Past performance is no guarantee of future results.

The economic forecasts set forth in the presentation may not develop as predicted and there can be no guarantee that strategies promoted will be successful.

Stock and mutual fund investing involves risk including loss of principal.

Bonds are subject to market and interest rate risk if sold prior to maturity. Bond values and yields will decline as interest rates rise and bonds are subject to availability and change in price.

The Consumer Discretionary Sector: Companies that tend to be the most sensitive to economic cycles. Its manufacturing segment includes automotive, household durable goods, textiles and apparel, and leisure equipment. The service segment includes hotels, restaurants and other leisure facilities, media production and services, consumer retailing and services, and education services.

Energy Sector: Companies whose businesses are dominated by either of the following activities: The construction or provision of oil rigs, drilling equipment and other energy-related service and equipment, including seismic data collection. The exploration, production, marketing, refining and/or transportation of oil and gas products, coal and consumable fuels.

Financials Sector: Companies involved in activities such as banking, consumer finance, investment banking and brokerage, asset management, insurance and investment, and real estate, including REITs.

Industrials Sector: Companies whose businesses manufacture and distribute capital goods, including aerospace and defense, construction, engineering and building products, electrical equipment and industrial machinery. Provide commercial services and supplies, including printing, employment, environmental and office services. Provide transportation services, including airlines, couriers, marine, road and rail, and transportation infrastructure.

______________________________________________________________________________________________________________________________

INDEX DESCRIPTIONS

The Standard & Poor’s 500 Index is a capitalization-weighted index of 500 stocks designed to measure performance of the broad domestic economy through changes in the aggregate market value of 500 stocks representing all major industries.

The Barclays Capital U.S. Aggregate Index represents securities that are SEC-registered, taxable, and dollar denominated. The index covers the U.S. investment-grade fixed rate bond market, with index components for government and corporate securities, mortgage pass-through securities, and asset-backed securities.

______________________________________________________________________________________________________________________________

This research material has been prepared by LPL Financial.

To the extent you are receiving investment advice from a separately registered independent investment advisor, please note that LPL Financial is not an affiliate of and makes no representation with respect to such entity.

Not FDIC or NCUA/NCUSIF Insured | No Bank or Credit Union Guarantee | May Lose Value | Not Guaranteed by any Government Agency | Not a Bank/Credit Union Deposit

Member FINRA/SIPC

What’s Fueling Gasoline?
April 10, 2013

This week, markets digest a variety of reports on the U.S. economy in February, March, and April 2013. Of particular interest to market participants will be the reports on producer prices and retail sales for March — both due out on Friday, April 12. The Consumer Price Index (CPI) is due out next Tuesday, April 16, 2013. The price of gasoline will feature prominently in all three reports. This time of year, gasoline prices typically garner plenty of attention from the media with the approach of the unofficial summer driving season right around the corner. Readers often want to know:

  • How have gasoline prices behaved thus far in 2013, and what might they do in the months ahead?
  • How much gasoline do we use in the United States?
  • How big an influence do gas prices have on consumer spending and the overall economy?

How Have Gasoline Prices Behaved So Far in 2013?

Gasoline prices are a product of global oil prices, federal, state, and local taxes, the cost of transporting the gasoline from refinery to filling station, and marketing costs. Prices can vary widely from region to region within the United States, and all prices in this report reflect the national average retail price for gasoline. Refinery shutdowns, refinery capacity, and differences in transportation and pipeline costs account for the U.S. regional differences in gasoline prices.  In the latest week, retail gasoline prices were $3.65 per gallon, and have declined by 20 cents per gallon over the past six weeks. While retail gasoline prices have increased by 28 cents per gallon this year, they remain 51 cents per gallon below the all-time high set in July 2008 at $4.16 per gallon. In a typical year, gasoline prices rise from January through the end of May, hit a plateau in the summer driving months of June, July, and August, and prices decline from the beginning of September through year-end.  Figure 1 shows that the price increase in gasoline in the first two months of 2013 was steeper than usual, but here in early April, the year-to-date price rise in gasoline prices has been more muted than usual.  Wholesale prices can often provide a window into what gasoline prices at the retail level will look like in a few weeks. Like gold, silver, copper, corn, wheat, etc., wholesale gasoline trades on commodity exchanges. Prices in the wholesale market have dropped 51 cents per gallon since mid February 2013, suggesting that the retail price is poised to drop by another $0.30 – 0.35 cents per gallon in the coming weeks, barring any major refinery outages or other disruptions. Wholesale gasoline prices are driven by global oil prices and supply and demand in the market place for gasoline from retail consumers, businesses, and government.

1_-_Gasoline_Prices_Have_Risen

How Much Gasoline Does the United States Use?

Each week, the Department of Energy produces the Weekly Petroleum Status Report (WPSR). The report has a variety of information on the nation’s petroleum industry, including  production, inventories, imports, exports, and prices. A key statistic in that report is the “gasoline supplied” figure, a good proxy for gasoline use (by all end users — consumers, businesses, industry, and government). On balance, the data reveals that the United States is using far less gasoline today than it did in 2007 [Figure 2]. In the last week of March 2013, the nation used 8.5 million barrels of gasoline per day, down 1 million barrels per day from the peak in January 2007, when the economy used 9.5 million barrels of gasoline per day. A combination of slowing economic growth, a slight increase in fuel economy among the nation’s vehicle fleet, and a sharp slowdown in miles driven (in part driven by an aging population) has helped to curtail U.S. gasoline use.

2_-_US_Economy_Using_10%_Less

Gasoline imports (and exports) are also captured in the WPSR [Figure 3]. In March 2013, gasoline imports were around 600,000 barrels per day, levels not seen since the early 2000s. Some of the drop in imports in recent years is due to environmental standards and ethanol mandates, but our reliance on foreign gasoline is waning. Still, the vast majority (95%) of the gasoline we use is produced domestically.

3_-_Gasoline_Imports_Have_Plunged

Gasoline carries a weight of 5.5% in the CPI, an 8% weight in the Producer Price Index (PPI), and sales at gasoline service stations account for about 11% of retail sales. Although gasoline represents only a small portion of the most widely watched price indices and measures of consumer spending, spending on gasoline and gasoline prices garner plenty of attention in the media and from politicians. Why? Gasoline is one of those items (like groceries) that consumers see the price of almost every day, and most of us fill up our gas tanks regularly. Even small changes in gasoline prices can elicit plenty of news coverage and consumer backlash.

How Much Does Gasoline Influence Consumer Spending and the Overall Economy?

What consumers spend on gasoline is carefully measured by the U.S. Commerce Department’s personal income and spending report released each month. The last report (for February 2013) was released on March 28, 2013. This report revealed that consumers spent an annualized $431 billion on gasoline in February 2013. This was equal to 3.8% of total consumer spending ($1.1 trillion) in February 2013, and 3.2% of personal income ($1.4 trillion). At the peak of oil prices in 2008, 4.3% of U.S. consumer spending

LPL_Financial_Research_Weekly_Calendar

went to gasoline, and gasoline purchases were 3.2% of personal income. Both of these figures were well below the all-time peaks on these metrics hit during the early 1980s [Figure 4]. Another surge in energy prices relative to consumer income and spending remains a threat to the health and longevity of the current expansion, which will turn four years old in June 2013.

4_-_A_Spike_in_Consumer_Energy

To put economy-wide gasoline use in perspective, in 1991, the U.S. economy used 7 million barrels per day of gasoline and produced gross domestic product (GDP) of $5.9 trillion, or put another way, produced $2,288 of GDP per gallon of gasoline used. In the first quarter of 2013, the U.S. economy used 8.7 millions of barrels of gasoline per day and produced $16 trillion in GDP, as the economy produced $5,036 in GDP for every gallon of gasoline used. Thus, looking back over the past 20-plus years, the U.S. economy’s output has nearly tripled, as gasoline usage increased by just 22%. In short, the U.S. economy has become much more gasoline efficient in the past 20 years, and this trend has been in place since the late 1970s/early 1980s [Figure 5]. Still, even with the emerging energy renaissance now underway, it may be years, or even decades — if ever — where the average U.S. consumer does not know (or care) what a gallon of gasoline costs.

5_-_US_Economy_is_Much_Less_Reliant

_________________________________________________________________________

IMPORTANT DISCLOSURES
The opinions voiced in this material are for general information only and are not intended to provide specific advice or recommendations for any individual. To determine which investment(s) may be appropriate for you, consult your financial advisor prior to investing. All performance reference is historical and is no guarantee of future results. All indices are unmanaged and cannot be invested into directly.

The economic forecasts set forth in the presentation may not develop as predicted and there can be no guarantee that strategies promoted will be successful.

Gross Domestic Product (GDP) is the monetary value of all the finished goods and services produced within a country’s borders in a specific time period, though GDP is usually calculated on an annual basis. It includes all of private and public consumption, government outlays, investments and exports less imports that occur within a defined territory.

Stock investing involves risk including loss of principal.

Commodity-linked investments may be more volatile and less liquid than the underlying instruments or measures, and their value may be affected by the performance of the overall commodities baskets as well as weather, disease, and regulatory developments.

The fast price swings in commodities and currencies will result in significant volatility in an investor’s holdings. Job Openings and Labor Turnover Survey (JOLTS) is a survey done by the United States Bureau of Labor Statistics to help measure job vacancies. It collects data from employers including retailers, manufacturers and different offices each month. Respondents to the survey answer quantitative and qualitative questions about their businesses’ employment, job openings, recruitment, hires and separations. The JOLTS data is published monthly and by region and industry.

______________________________________________________________________________________

INDEX DESCRIPTIONS
Producer Price Index is an inflationary indicator published by the U.S. Bureau of Labor Statistics to evaluate wholesale price levels in the economy.

The Consumer Price Index (CPI) is a measure of the average change over time in the prices paid by urban consumers for a market basket of consumer goods and services.

______________________________________________________________________________________

This research material has been prepared by LPL Financial.

To the extent you are receiving investment advice from a separately registered independent investment advisor, please note that LPL Financial is
not an affiliate of and makes no representation with respect to such entity.

Not FDIC/NCUA Insured | Not Bank/Credit Union Guaranteed | May Lose Value | Not Guaranteed by any Government Agency | Not a Bank/Credit Union Deposit

The Market’s March Madness
March 21, 2013

It has been a sweet sixteen weeks for the S&P 500. The broad stock market index has had only three down weeks out of the past sixteen. While
this stretch is tied by the same period a year ago, it is important to note that there has not been a sixteen-week period with fewer weeks of losses in
over 20 years — since the period ending September 1, 1989.

March has been maddening for investors in the past few years (2010 – 2012) as the S&P 500 raced higher in March only to reverse all of those gains in a pullback of about 10% that began in late March or April. It later took stocks at least five months to climb back to the peaks of March.

As the NCAA tournament gets down to its own sweet sixteen at the end of this week, it is a good time to reflect on the competing drivers of the markets that may make for an exciting showdown in the weeks and months to come.

March Madness Bracket

As we narrow down stocks’ “sweet sixteen” potential drivers this year, the four “regions” of market-moving factors vying for investor attention are: economy, policy, fundamentals, and market dynamics.

Economy

  • „Employment – Job growth has been picking up with more than 200,000 jobs created in three of the past four months and first-time filings for unemployment benefits have started to fall after stabilizing around 350,000 for over a year.
  • Housing – The powerfully rebounding housing market, as seen in data such as housing starts and building permits, is a positive for growth.
  • Confidence – Last week’s University of Michigan data showed that consumer confidence fell sharply in the preliminary reading for March to the lowest level in over a year.
  • Gasoline Prices – Retail gasoline prices are back up near the “danger zone” that coincided with stock market pullbacks in each of the past few years.

Policy

  • „Federal Reserve – “Don’t Fight the Fed” rally is intact, but as the Federal Reserve publicly contemplates ending the latest stimulus program, the stock market may suffer the same sell-off that surrounded the ending of prior quantitative easing programs, so-called QE1 and QE2.
  • Europe – With the Eurozone back in recession, an inconclusive election leaving no government in Italy, a political scandal hampering the ability to implement needed reforms in Spain, Greece unlikely to meet the terms of its own bailout, and Germany pushing hard terms on any aid ahead of its fall elections, the events in Cyprus could provide the catalyst for another Europe-driven spring slide in the world’s stock markets.
  • Geopolitics – The hot spots are heating up again given the power grab following the death of Chavez in Venezuela, the coming elections in Iran, different factions vying for power in war-torn Syria, and North Korea annulling its cease fire agreement.
  • Fiscal Cliff – A fiscal drag on gross domestic product (GDP) of about 2%, and showdowns over the continuing resolution funding the government and the debt ceiling still to come, may weigh on investor sentiment as the recently implemented sequester threatens to halt labor market improvement with an estimated cost of 750,000 jobs, according to the Congressional Budget Office.

Fundamentals

  • „Earnings – Earnings are the most fundamental of all drivers of stocks.  Earnings growth has been the most consistent factor driving the markets in recent years, but growth has now slowed to the low-single digits for S&P 500 companies.
  • Valuations – The price-to-earnings ratio of the S&P 500, at around 15 on the past four quarters’ earnings, is well below the 17 – 18 seen at the end of all prior bull markets since WWII.
  • Credit – Demand for credit has improved and credit spreads have

    narrowed; both trends are key supports to growth.

  • Corporate Cash – Strong cash balances provide a cheap source of

    capital to invest and incentive to buy back shares to boost earnings per s

    hare growth.

Market Dynamics

  • „Momentum – Stocks have been on a strong winning streak that could continue.
  • Volume – Trading volume in the markets has been light this year, 10 – 15% below last year, traditionally seen as a sign that a trend has become vulnerable.
  • Volatility – Investors have once again become net sellers of U.S. stock mutual funds in the past two weeks, according to data from the Investment Company Institute (ICI), despite strong and steady gains. A return to more volatile markets may further undermine individual investor support.
  • Interest Rates – Interest rates are on the rise, potentially acting as a drag on everything from housing to the U.S. budget, but from very low levels.

There are quite a few listed here, but these certainly are not all the factors that are influencing the markets.

The key message for investors in considering these factors is: don’t be too confident in any particular outcome. Respect the complexity of the situation. This is a time for caution and taking some profits, not for indiscriminate selling. It is a time to nibble at opportunities as they emerge; it is not a time to jump in with both feet.

Investing is not a game, but it is important also to remember that forecasting is not an exact science, and many factors can affect outcomes that are hard to predict. Two years ago, the Japanese earthquake had a big impact on markets and natural disasters — despite tremendous advances in technology — are very hard to predict with any degree of accuracy. Geopolitical outcomes can also be hard to foresee as we look to the stresses in the Middle East. For example, the outcome of the Arab Spring uprisings and the changes they have led to in countries including Syria and Egypt were hard to foresee. The markets rarely offer perfect clarity on their direction because they are driven by these factors as well as many others. Even this week’s NCAA March Madness can be seen as a reminder of how it can be notoriously hard to predict winners. Historically, a team’s ranking has meant nothing after getting down to the elite eight.

These factors will play out in the markets over the course of the year, not just in the coming weeks. This means there will likely be some upsets that result in volatility and pullbacks as these factors face off against each other. In the end, we expect a positive year with many opportunities for investors.

____________________________________________________________________________________________________________________________________________

IMPORTANT DISCLOSURES
The opinions voiced in this material are for general information only and are not intended to provide specific advice or recommendations for any individual. To determine which investment(s) may be appropriate for you, consult your financial advisor prior to investing. All performance reference is historical and is no guarantee of future results. All indices are unmanaged and cannot be invested into directly.

The economic forecasts set forth in the presentation may not develop as predicted and there can be no guarantee that strategies promoted will be successful.

Stock and mutual fund investing involves risk, including the risk of loss.

The Standard & Poor’s 500 Index is an unmanaged index, which cannot be invested into directly. Past performance is no guarantee of future results.

Quantitative easing is a government monetary policy occasionally used to increase the money supply by buying government securities or other securities from the market. Quantitative easing increases the money supply by flooding financial institutions with capital in an effort to promote increased lending and liquidity.

The Congressional Budget Office is a non-partisan arm of Congress, established in 1974, to provide Congress with non-partisan scoring of budget proposals.

The P/E ratio (price-to-earnings ratio) is a measure of the price paid for a share relative to the annual net income or profit earned by the firm per share. It is a financial ratio used for valuation: a higher P/E ratio means that investors are paying more for each unit of net income, so the stock is more expensive compared to one with lower P/E ratio.

Earnings per share (EPS) is the portion of a company’s profit allocated to each outstanding share of common stock. EPS serves as an indicator of a company’s profitability. Earnings per share is generally considered to be the single most important variable in determining a share’s price. It is also a major component used to calculate the price-to-earnings valuation ratio.
The Investment Company Institute (ICI) is the national association of U.S. investment companies, including mutual funds, closed-end funds, exchange-traded funds (ETFs) , and unit investment trusts (UITs). Members of ICI manage total assets of $11.18 trillion and serve nearly 90 million shareholders.

The credit spread is the yield the corporate bonds less the yield on comparable maturity Treasury debt. This is a market-based estimate of the amount of fear in the bond market Bass-rated bonds are the lowest quality bonds that are considered investment-grade, rather than high-yield. They best reflect the stresses across the quality spectrum.

International and emerging market investing involves special risks such as currency fluctuation and political instability and may not be suitable for all investors.

____________________________________________________________________________________________________________________________________________

INDEX DESCRIPTIONS
The Standard & Poor’s 500 Index is a capitalization-weighted index of 500 stocks designed to measure performance of the broad domestic economy through changes in the aggregate market value of 500 stocks representing all major industries.

____________________________________________________________________________________________________________________________________________
„This research material has been prepared by LPL Financial.

To the extent you are receiving investment advice from a separately registered independent investment advisor, please note that LPL Financial is not
an affiliate of and makes no representation with respect to such entity.

Not FDIC or NCUA/NCUSIF Insured | No Bank or Credit Union Guarantee | May Lose Value | Not Guaranteed by any Government Agency | Not a Bank/Credit Union Deposit