The Federal Reserve (Fed) reintroduced interest rate risk in the bond market
last week. Corporate bonds, particularly lower-rated high-yield bonds,
weathered the rise in rates better than most sectors. Bond prices overall
are generally higher so far in 2014, and high-yield bonds remain expensive
relative to history, but that does not mean that the sector cannot still offer
value for investors. Credit quality is generally good, funding conditions are
favorable, and defaults may remain low — all of which support higher-than average
valuations. High-yield bond valuations must also be taken in the
context of a bond market with limited opportunities. High-yield bonds and
lower-rated debt may still offer attractive opportunities in the bond market.
The earnings reporting season for the fourth quarter of 2013 (with
results released over the first quarter of 2014) broadly showed that the
fundamentals underlying corporate America remain strong. Fourth quarter
earnings increased by nearly 10% on an annualized basis, an acceleration
versus the third quarter of 2013 and an improvement from the mid-single digit
pace of the prior several quarters. Revenue growth improved at a much
more modest 1.0% annualized growth rate but is still supportive of good
credit metrics underlying corporate bonds. Please see the discussion below
for a closer look at these important indicators of corporate credit quality.
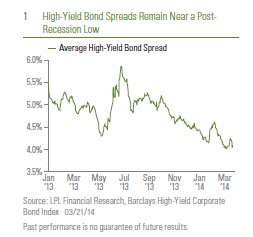
Good credit quality metrics and low defaults may help support corporate bond
valuations in 2014 — a trend that may continue. However, the combination
has led to the lowest yield advantage, or spread, of high-yield bonds relative
to Treasuries since the end of the financial crisis [Figure 1]. The lower (or
narrower) the yield spread, the more expensive the valuation. The current
average yield spread of 4% is below the 5.8% long-term average.
It is not uncommon for high-yield spreads to stay narrow for an extended
time. After a period of improving credit quality, the gains achieved by
corporate bond issuers have lasting impacts leading to long periods
of stable credit quality [Figure 2]. In a typical credit cycle, as credit
quality weakens and/or default risks increase, usually in response to a
weakening economy, yield spreads widen and high-yield bonds historically
underperform as investors demand greater yield compensation. Once the
economy rebounds, yield spreads contract as credit quality improves and
risks subside. At a certain point, additional credit quality improvements are
difficult to achieve, and credit quality merely remains stable.
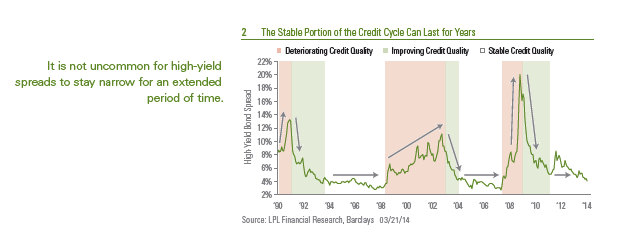
Periods of stable credit quality can persist for years. Stability persisted for
approximately six years during the 1990s and nearly four years in the past
decade (2000 – 09). Note that the average high-yield spread narrowed to
3% or below at prior high-yield bond market peaks, more than a percentage
point below the current level. While we do not think such a narrow yield
spread can be achieved in the current cycle due to the lower level of overall
interest rates, the current level of yield spreads may persist for most of 2014
and perhaps beyond.
Credit Quality
Using data from the Fed’s Flow of Funds database, we can take a closer
look at broad corporate credit quality metrics for non-financial corporations
that may help reveal whether the stable portion of the credit cycle may be
approaching an end. The degree of financial leverage, measured by the
amount of debt relative to corporate profits, among corporate bond issuers
is a focal measure for investors, since highly leveraged corporations are
more likely to default and may cause corporate bond prices, especially high yield
bond prices, to rise. The current level is below peaks witnessed during
the past several recessions (early 90s, early 2000s, 2007 – 09) but is on the
rise, which is a negative for corporate bond investors even though corporate
profits are at all-time highs [Figure 3].

But looking at leverage alone does not reveal the whole picture. The cost to
service that debt is important and quite manageable [Figure 4]. Non-financial
corporations can cover their interest payment obligations several times over.
Although interest coverage metrics have likely plateaued, it still indicates a
substantial ability for the timely payment of interest income to investors.
Financial regulation has forced banks to bolster bank balance sheets, and
financial system leverage, as measured by the market value of their equity
relative to assets, remains low [Figure 5]

Leading Indicators
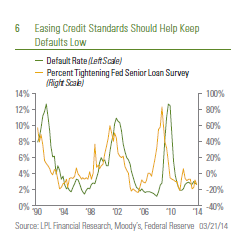
Aside from credit quality, funding conditions generally remain healthy. The
ability to obtain funding at a critical juncture can override credit quality
metrics — either good or bad. The Fed’s Senior Loan Officer Survey reveals
the percentage of banks that are either tightening or loosening lending
standards. The survey can be a leading indicator of defaults [Figure 6], which
in turn can have a dramatic impact on high-yield bond valuations. Thanks to
an expanding economy, most banks are easing lending standards as they
compete to win new loan business, which should help keep defaults low.
On the negative side, the desire for yield in a low-yield environment has
led to companies issuing debt with weaker investor protections, known as
covenants. Since late 2013, Moody’s rating agency has reported several
times that covenant protections are near historic lows based upon their
proprietary rating scale. Poorly underwritten new bond structures do
not immediately impact the high-yield bond market and usually require a
catalyst. Still, weak covenants and more speculative issuance can sow the
seeds of a future rise in defaults and a decline in high-yield bond prices.
The timing of such an event is difficult to predict but historically occurs
from months to years after such a surge and depends on the health of the
economy as well as the ease of obtaining funding in the marketplace.
Conclusion
News of corporate bond defaults in China has caused some investors to
refocus attention on elevated high-yield bond valuations here in the United
States. But China’s issues are unique and a result of its own debt bubble,
fueled by speculative deals often backed by commodities. Domestic high-
yield bond valuations, on the other hand, remain high for a reason — backed
by good credit quality and low defaults, both may continue and should help
support the sector. An increase in more speculative issuance may pose a
future risk but does not override current investment merits. An expanding
economy and easier lending standards provide an additional boost. With
bond market valuations still broadly expensive, the added yield of high-yield
bonds will likely enable the sector to be one of the more attractive options
for investors in 2014.
IMPORTANT DISCLOSURES
The opinions voiced in this material are for general information only and are not intended to provide specific
advice or recommendations for any individual. To determine which investment(s) may be appropriate for you,
consult your financial advisor prior to investing. All performance reference is historical and is no guarantee
of future results. All indices are unmanaged and cannot be invested into directly. Unmanaged index returns
do not reflect fees, expenses, or sales charges. Index performance is not indicative of the performance of
any investment.
This information is not intended to be a substitute for specific individualized tax advice. We suggest that you
discuss your specific tax issues with a qualified tax advisor.
The economic forecasts set forth in the presentation may not develop as predicted and there can be no
guarantee that strategies promoted will be successful.
Bonds are subject to market and interest rate risk if sold prior to maturity. Bond values and yields will decline
as interest rates rise, and bonds are subject to availability and change in price.
The Fed funds rate is the interest rate on loans by the Fed to banks to meet reserve requirements.
Government bonds and Treasury Bills are guaranteed by the U.S. government as to the timely payment of
principal and interest and, if held to maturity, offer a fixed rate of return and fixed principal value. However,
the value of fund shares is not guaranteed and will fluctuate.
High yield/junk bonds (grade BB or below) are not investment grade securities, and are subject to higher
interest rate, credit, and liquidity risks than those graded BBB and above. They generally should be part of a
diversified portfolio for sophisticated investors.
Bank loans are loans issued by below investment grade companies for short term funding purposes with
higher yield than short-term debt and involve interest rate, credit/default and liquidity risk.
INDEX DESCRIPTIONS
The Barclays U.S. Corporate High Yield Index covers the USD-denominated, non-investment grade, fixedrate,
taxable corporate bond market. Securities are classified as high-yield if the middle rating of Moody’s,
Fitch, and S&P is Ba1/BB+/BB+ or below. The index excludes Emerging Markets debt. The index was
created in 1986, with index history backfilled to January 1, 1983. The U.S. Corporate High Yield Index is part
of the U.S. Universal and Global High Yield Indices.
The Barclays Municipal Bond Index is a market capitalization-weighted index of investment-grade municipal
bonds with maturities of at least one year.
This research material has been prepared by LPL Financial.
To the extent you are receiving investment advice from a separately registered independent investment advisor, please note that LPL Financial is
not an affiliate of and makes no representation with respect to such entity.
Not FDIC/NCUA Insured | Not Bank/Credit Union Guaranteed | May Lose Value | Not Guaranteed by any Government Agency | Not a Bank/Credit Union Deposit
Member FINRA/SIPC