On March 28, 2013, the Bureau of Economic Analysis (BEA) of the U.S. Department of Commerce reported that corporate profits of all U.S.-based corporate entities — as measured in the National Income and Product Accounts (NIPA) — hit an all-time high in the fourth quarter of 2012. The bulk of companies in the S&P 500, a subset of the companies in the NIPA profits data, will report their earnings for the first quarter of 2013 in the coming weeks.

Strong overseas economies (especially in emerging markets), restrained hiring, modest wage gains, low interest rates, solid worker productivity, and an economic cycle that is just three months shy of its fourth birthday have all contributed to the record level of profits.
Economy-wide, corporate cash levels remain at all-time highs, as firm managements remain reluctant to commit to more hiring, spending, and expansion, given the severity of the Great Recession, the sluggish pace of economic growth in the current recovery, and the uncertainty surrounding the legislative and regulatory outlook in Washington.
Putting Profits and Cash to Work
Companies can choose many paths in putting their profits and cash to use. Choices include, but are not limited to:
- Starting or increasing dividend payments to shareholders;
- Buying back shares;
- Buying other companies;
- Increasing hiring;
- Ramping up research and development; and Investing in new plant and equipment or, as it is commonly known, business capital spending.
The official name for business capital spending in the government’s gross domestic product (GDP) accounts is gross private nonresidential investment. In plain English, business capital spending is what businesses spend on:
- Structures: Factories, office buildings, office parks, utilities, shopping malls, amusement parks, hotels, restaurants, mines, and oil wells.
- Equipment and software: Computers, computer software, communication equipment, medical equipment, industrial equipment, engines and turbines, transportation equipment, furniture, construction machinery, etc.
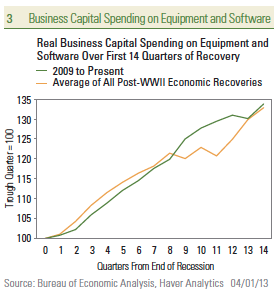
Most Business Capital Spending Has Been on New Equipment and Software
To put business capital spending into perspective, in recent quarters, 75% of business capital spending has been on equipment and software, with only 25% of business spending on structures, according to NIPA. Overall business capital spending (on both equipment and software and structures) accounts for around 11% of GDP. The all-time peak, hit in the mid-2000s, was 12%. Although real GDP is back to an all-time high, overall business capital spending has not yet recovered its pre-Great Recession peak. Of the other major components of GDP (consumer spending, business spending, housing, exports, imports, and government spending), business capital spending joins housing and government spending as components that have not yet recovered their pre-Great Recession highs.

Overall business capital spending has not yet hit new all-time highs. However, the equipment and software portion of business capital spending hit a new all-time high in early 2012, driven primarily by spending on upgrading computers and software, to help make existing employees more productive. Spending on industrial equipment and transportation equipment — used by businesses to make and transport goods — has yet to recover its pre-Great Recession peak. Businesses remain reluctant to spend on these big ticket items, and for those firms without big cash stockpiles, banks remain reluctant to lend to small and medium-sized businesses to make these big ticket purchases.
Mining and Power Generation Lead Spending on Structures
Over on the structures side of business capital spending (malls, office parks, warehouses, factories, utilities, hotels, mining, and oil exploration, etc.), the only areas where business capital spending is back to pre-Great Recession peaks are in mining and power generation. These areas are of course benefitting from the nascent energy renaissance in the United States, which has led to increased production of natural gas and oil supplies. Spending on traditional business structures — largely dependent on rising employment — like offices, manufacturing facilities, and warehouses, remains moribund. Business spending on new malls, restaurants, hotels and recreational facilities like amusement parks also remains quite depressed in some cases at just 50 – 60% of pre-Great Recession peaks, as the economy continues to work down the excesses of the decade-and-a-half long housing boom that ended in the mid-2000s.

Caution Ahead?
Looking ahead, profit growth — a key driver of future business capital spending — is poised to slow, after surging in the past four years from the depths of the Great Recession. Increases in the equity market are also one of the key drivers of future business capital spending. Just last week, the S&P 500 — a broad measure of equity prices in the United States, hit a new all-time high. The S&P 500 is up more than 10% over the past year and is up nearly 130% since March 2009. Low interest rates, and willingness of banks (and markets) to lend to businesses are also key drivers of business spending. Thanks to the Federal Reserve (Fed), interest rates remain low, providing low borrowing costs for corporations looking to borrow via bank loans or the bond market to fund business capital spending. Although borrowing costs are low, demand by businesses — especially small businesses — for bank loans remains muted. In addition, banks’ lending standards for small businesses for loans to finance capital spending remain tighter than they were during the mid-2000s economic recovery.
Pent-up demand and lack of business capital spending in recent years — especially in structures, where spending has lagged — should lead to stronger spending in the coming years. For example, the average age of business structures is nearly 22 years, the highest since the mid-1960s. The recent ramp-up in energy production also suggests more spending in this area in the coming years to update and improve the nation’s energy infrastructure (pipelines, terminals, etc.).
While most of the indicators point to an ongoing improvement in capital spending in the coming quarters and years, the looming uncertainty in Washington, along with the sluggish pace of hiring, suggests that businesses are likely to remain cautious in deploying their profits and cash. The mechanics of business capital spending, including the long lead times for many business spending projects, are also at play. Since the end of World War II, the average economic expansion has lasted about five years, although the expansions since 1982, on average, lasted for almost eight years. Still, this June will mark the fourth anniversary of the current economic recovery. Although, in our view, there are few signs that the recovery is in any danger, firms may not want to commit to multi-year projects if managements believe another recession is right around the corner.
____________________________________________________________________________________________
IMPORTANT DISCLOSURES
The opinions voiced in this material are for general information only and are not intended to provide specific advice or recommendations for any individual. To determine which investment(s) may be appropriate for you, consult your financial advisor prior to investing. All performance reference is historical and is no guarantee of future results. All indices are unmanaged and cannot be invested into directly.
The economic forecasts set forth in the presentation may not develop as predicted and there can be no guarantee that strategies promoted will be successful.
Gross domestic product (GDP) is the monetary value of all the finished goods and services produced within a country’s borders in a specific time period, though GDP is usually calculated on an annual basis. It includes all of private and public consumption, government outlays, investments and exports less imports that occur within a defined territory.
The National Income and Product Accounts (NIPA) is the official government system of collecting, processing, and reporting assorted production and income measures used to track aggregate activity in the macroeconomy. This system of accounts, maintained by the Bureau of Economic Analysis in the Department of Commerce, is the source of official estimates of gross domestic product, net domestic product, national income, personal income, disposable income, gross national product, and related measures that are published quarterly and annually.
INDEX DESCRIPTIONS
The Standard & Poor’s 500 Index is a capitalization-weighted index of 500 stocks designed to measure performance of the broad domestic economy through changes in the aggregate market value of 500 stocks representing all major industries.
____________________________________________________________________________________________
This research material has been prepared by LPL Financial.
To the extent you are receiving investment advice from a separately registered independent investment advisor, please note that LPL Financial isnot an affiliate of and makes no representation with respect to such entity.
Not FDIC/NCUA Insured | Not Bank/Credit Union Guaranteed | May Lose Value | Not Guaranteed by any Government Agency | Not a Bank/Credit Union Deposit
____________________________________________________________________________________________
Member FINRA/SIPC
Page 5 of 5
RES 4120 0413
Tracking #1-155202 (Exp. 04/14)
____________________________________________________________________________________________
Stay Connected with Us!


