Archive for the ‘Quantitative Easing’ Category

The Employment Situation: Slow Climb Back
February 4, 2014

This Friday, February 7, 2014, the U.S. Department of Labor will release its monthly Employment Situation report. Though a lagging indicator of the economy, the report will likely garner plenty of attention from market participants, policymakers, politicians, pundits, the news media, and the public.

In December 2007 and January 2008, U.S. private sector jobs peaked at 115.7 million. The Great Recession and its aftermath saw the private sector economy shed 8.9 million jobs, and by February 2010, the private sector economy was down to 106.8 million jobs. Since then, the private sector economy has created 8.2 million jobs, and as 2013 ended, needed just under 700,000 net new jobs to get back to the pre-recession peak. We expect that to occur sometime in the first six months of 2014 [Figure 1].

Figure_1
Prior to the disappointing December 2013 employment report (released in early January 2014), which revealed that the private sector economy had created only 87,000 net new jobs in the weather-impacted month of December 2013, the economy had consistently been creating between 175,000 and 200,000 net new jobs per month [Figure 2]. We expect this pace of job creation to continue in 2014, with some variation around the trend due to fundamentals and weather. (See below for a discussion of weather’s impact on the January 2014 report.)

Figure_2

Weather and Revisions:  Sources of Uncertainty

The consensus of economists as surveyed by Bloomberg News is looking for a 190,000 gain in private sector payrolls in January 2014, after the 87,000 gain in December 2013. The range of estimates — the difference between the high and low estimate — is unusually wide for the January report. In recent years, the range of estimates has been around 120,000; for January’s report it is 200,000. The unusually wide range reflects the uncertainty around the impact of the weather on both the December 2013 and January 2014 reports, and also the revisions to the employment data made each year at this time.

While not all of the weakness in the December 2013 employment report was due to an unusually cold and snowy December, a sizable portion was. In January 2014, the population-adjusted average temperature was two degrees above normal. In December 2013, the same metric was two degrees colder than usual. The anomaly was even worse during the survey week (the week containing the 12th of the month) for the December 2013 employment report. It was six degrees colder than usual during the survey week in December 2013, and two degrees warmer than usual during the survey week in January 2014. In addition, the Department of Labor said that 273,000 people were “unable to work because of bad weather” in December 2013, the most for any December since 1977. This metric will be very closely watched again in January.

Another source of uncertainty surrounding the January 2014 employment report is revisions. In February of each year, the Labor Department releases revised data on the number of employees on payrolls. The revisions are based on new information gathered from businesses records and tax returns. Because of these revisions, the monthly changes in the payroll job count over the past year will be adjusted, but the pattern of employment is unlikely to change very much.

As noted in our Outlook 2014: The Investor’s Almanac, our view for this year is that U.S. economic growth will accelerate to 3.0% from the 2.0% pace seen in 2013. We expect both the federal government’s lifting of fiscal drags and increased state and local government spending to boost economic growth this year. In all of 2013, state and local government spending subtracted a small amount (0.02 percentage points) from gross domestic product (GDP) growth, but all of that drag occurred in the first quarter of 2013. By contrast, state and local governments added 54,000 jobs in 2013, marking the first year since 2008 that the sector added jobs. This sector added jobs in eight of the final 11 months of 2013, and we expect that trend to persist well into 2014 and beyond.

Fedlines and Labor Market Health Points

Of course, financial markets pay so much attention to this report because policymakers at the Federal Reserve (Fed) have tied the pace of quantitative easing (QE), and indeed the Fed’s guidance on rates, to the health of the labor market. “Maximum employment” in the context of price stability is the Fed’s goal, and the new Fed chairwoman, Janet Yellen, has cited several labor market metrics in public appearances over the past several years. Next week, Tuesday, February 11, 2014, Yellen will deliver the Fed’s semiannual Monetary Policy testimony (also known as the Humphrey-Hawkins testimony) to Congress, providing the market with her views on policy, the economy, and the labor market for the first time as Fed chairwoman.

In its most recent (January 29, 2014) statement, the Federal Open Market Committee (FOMC), the Fed’s policy making arm, reaffirmed that:

The current exceptionally low target range for the federal funds rate of 0 to 1/4 percent will be appropriate at least as long as the unemployment rate remains above 6-1/2 percent, inflation between one and two years ahead is projected to be no more than a half percentage point above the Committee’s 2 percent longer-run goal, and longer-term inflation expectations continue to be well anchored.

In addition, in his final press conference as chairman in December 2013, Ben Bernanke discussed the unemployment rate, saying:

And so we were comfortable setting a 6.5 percent unemployment rate as the point at which we would begin to look at a more broad set of labor market indicators. However, precisely because we don’t want to look just at the unemployment rate, we want to — once we get to 6½ — we want to look at hiring, quits, vacancies, participation, long-term unemployment, et cetera, wages. We couldn’t put it in terms of another unemployment rate level, specifically. So, I expect there will be some time past the 6½ percent before all of the other variables that we’ll be looking at will line up in a way that will give us confidence that the labor market is strong enough to withstand the beginning of increases in rates.

The metrics Bernanke noted, including hiring, quits, vacancies, and participation, have been cited by Yellen in the past as indicators she was watching to gauge the health of the labor market. This week’s employment report for January 2014 will provide updates of several of these metrics (the participation rate, long-term unemployment, wages, hiring), and market participants will closely watch these as they gauge the pace of tapering and the Fed’s guidance on rates.

On the other hand, the data on “quits” and “vacancies” are found in the monthly Job Openings and Labor Turnover Survey (JOLTS). The JOLTS report (for December 2013) is due out on the same day (and at the same time) that Janet Yellen delivers her first Humphrey-Hawkins testimony to Congress, next Tuesday, February 11, 2014. Figure 3 shows that the “quit rate” — the percentage of job leavers who leave their jobs voluntarily (presumably because they have better prospects elsewhere) — climbed to near-record highs in late 2013. However, some of the other labor market metrics noted recently by Bernanke and Yellen are still at depressed levels.

Figure_3

On balance, the January 2014 employment report will garner plenty of attention from market participants, the media, and the public as the labor market continues its slow climb back to its pre-recession peak.

___________________________________________________________________________________________________________________________

IMPORTANT DISCLOSURES
The opinions voiced in this material are for general information only and are not intended to provide specific advice or recommendations for any individual. To determine which investment(s) may be appropriate for you, consult your financial advisor prior to investing. All performance reference is historical and is no guarantee of future results. All indices are unmanaged and cannot be invested into directly.

The economic forecasts set forth in the presentation may not develop as predicted and there can be no guarantee that strategies promoted will be successful.

Stock investing involves risk including loss of principal.

The Federal Open Market Committee (FOMC), a committee within the Federal Reserve System, is charged under the United States law with overseeing the nation’s open market operations (i.e., the Fed’s buying and selling of U.S. Treasury securities).

Quantitative easing is a government monetary policy occasionally used to increase the money supply by buying government securities or other securities from the market.  quantitative easing increases the money supply by flooding financial institutions with capital in an effort to promote increased lending and liquidity.

Job Openings and Labor Turnover Survey (JOLTS) is a survey done by the United States Bureau of Labor Statistics to help measure job vacancies. It collects data from employers including retailers, manufacturers and different offices each month. Respondents to the survey answer quantitative and qualitative questions about their businesses’ employment, job openings, recruitment, hires and separations. The JOLTS data is published monthly and by region and industry.

Gross Domestic Product (GDP) is the monetary value of all the finished goods and services produced within a country’s borders in a specific time period, though GDP is usually  calculated on an annual basis. It includes all of private and public consumption, government outlays, investments and exports less imports that occur within a defined territory.

____________________________________________________________________________________________________________________________

This research material has been prepared by LPL Financial.
To the extent you are receiving investment advice from a separately registered independent investment advisor, please note that LPL Financial is
not an affiliate of and makes no representation with respect to such entity.

Not FDIC/NCUA Insured | Not Bank/Credit Union Guaranteed | May Lose Value | Not Guaranteed by any Government Agency | Not a Bank/Credit Union Deposit

Member FINRA/SIPC

Ben’s Top 10
December 23, 2013

The Federal Reserve’s (Fed) policymaking arm, the Federal Open Market Committee (FOMC), announced that it will begin tapering, or scaling back, its bond-buying program known as quantitative easing (QE) at its final meeting of the year last week. The Fed will now purchase $75 billion per month in QE — $10 billion less than the current monthly $85 billion, citing less fiscal drag and the “cumulative progress toward maximum employment and the improvement in the outlook for labor market conditions.”

We believe the Fed made somewhat of a “trade” with the bond market. On one side, the Fed reduced QE by $10 billion per month. Conversely, the Fed delivered a bullish and confident view on the U.S. economy — signaling that it would keep interest rates lower for longer. The stock market was more than willing to forego $10 billion in purchases now (via the taper) in exchange for a bullishly confident Fed that will likely keep rates lower for longer and saw this as a good trade. After all, it is the Fed’s zero interest rate policy, not its soonto- be tapered bond purchases, that has the biggest impact on maintaining lower rates and boosting economic growth.

Fedlines: Ben’s Top 10

Unless the Fed decides to hold a press conference at its next policy meeting in late January 2014, last week’s press conference was outgoing Fed Chairman Ben Bernanke’s last. During that final press conference, Bernanke was asked about — and weighed in on — several key topics that will likely impact financial markets and the economy throughout 2014. Below, we examine Bernanke’s top 10 answers in his own words at his final press conference as Fed Chairman.

1. Is tapering tightening?

“And so I do want to reiterate that this is not intended to be a tightening.”

2. What advice do you have for Janet Yellen? (If confirmed by the Senate, Yellen will replace Bernanke as Fed Chairman in early 2014.)

“Well, I think the first thing to agree to is that Congress is our boss. The Federal Reserve is a(n) independent agency within the government. It’s important that we maintain our policy independence in order to be able to make decisions without short-term political interference.”

3. At what pace will the Fed taper?

“Sure, on the first issue of 10 billion (dollars), again, we say we are going to take further modest steps subsequently, so that would be the general range.”

4. Would the Fed do more if the economy falters? Would you increase purchases?

“But there are things that we can do. We can strengthen the guidance in various ways. And while the view of the committee was that the best way forward today was in this more qualitative approach, which incorporates elements both of the unemployment threshold and the inflation floor, that further strengthening would be possible and it’s something that is certainly not been ruled out.

And of course, asset purchases are still there to be used. We do have tools to manage a large balance sheet. We’ve made a lot of progress on that. So while — again, while we think that we can provide a high level of accommodation with a somewhat slower place, but still very high pace of asset purchases and our interest rate policy, we do have other things we can do if we need to ramp up again. That being said, we’re hopeful that the economy will continue to make progress and that we’ll begin to see the whites of the eyes of the end of the recovery and the beginning of the more normal period of economic growth.”

“Under some circumstances, yes, … we could stop purchases if the economy disappoints, we could pick them up somewhat if the economy is stronger.”

5. Why Has Recovery Been So Slow?

“It’s — of course that’s something for econometricians and historians to grapple with, but there have been a number of factors which have contributed to slower growth. They  include, for example, the observation of financial crises tend to disrupt the economy, may affect innovation, new products, new firms.

We had a big housing bust, and so the construction sector of course has been quite depressed for a while. We’ve had continuing financial disturbances in Europe and elsewhere. We’ve had very tight — on the whole, except for in 2009, we’ve had very tight fiscal policy.

People don’t appreciate how tight fiscal policy has been. At this stage in the last recession, which was a much milder recession, state, local and federal governments had hired 400,000 additional workers from the trough of the — of the recession. At the same point in this recovery, the change in state, local and federal government workers is minus 600,000.

So there’s about a million workers’ difference in how many people are — been employed at all levels of government. So fiscal policy has been tight, contractionary. So there have been a lot of headwinds. All that being said, we have been disappointed in the pace of growth, and we don’t fully understand why. Some of it may just be a slower pace of underlying potential, at least temporarily. Productivity has been disappointing. It may be that there’s been some bad luck, for example, the effects of the European crisis and the like. But compared to other advanced industrial countries, Europe, U.K., Japan — compared to other countries — advanced industrial countries recovering from financial crises, the U.S. recovery has actually been better than most.

It’s not been good. It’s not been satisfactory. Obviously, we still have a labor market where it’s not easy for people to find work. A lot of young people can’t get the experience and entree into the labor market. But I think given all of the things that we’ve faced, it’s perhaps, at least in retrospect, not shocking that the recovery has been somewhat tepid.”

6. What impact has QE had on the economy? Has QE worked?

”Well, it’s very hard to know — in terms of the study it’s very hard to know — it’s an imprecise science to try to measure these effects. You have to obviously ask yourself, you know, what would have happened in the absence of the policy. I think that study — I think it was a very interesting study, but it was on the upper end of the estimates that people have
gotten in a variety of studies looking at the effects of asset purchases.

That being said, I’m pretty comfortable with the idea that this program did, in fact, create jobs. I cited some figures. To repeat one of them, the Blue Chip forecast for unemployment in this current quarter made before we began our program was on the order of 7.8 percent, and that was before the fiscal cliff deal, which even — created even more fiscal head
winds for the economy. And of course, we’re now at 7 percent. I’m not saying that asset purchases made all that difference, but it made some of the difference. And I think it has helped to create jobs.

And you can see how it works. I mean, the asset purchases brought down long-term interest rates, brought down mortgage rates, brought down corporate bond yields, brought down car loan interest rates. And we’ve seen response in those areas as the economy has done better. Moreover, again, this has been done in the face of very tight, unusually tight fiscal policy for a recovery period. So I do think it’s been effective, but the precise size of the impact is something I think that we can very reasonably disagree about and the work will continue on. As I said before, the uncertainty about the impact and the uncertainty about the effects of ending programs and so on is one of the reasons why we have treated
this as a supplementary tool rather than as our primary tool.”

7. Are you concerned about deflation?

“Now, it is true that while we have passed the — or made significant progress on the labor market and growth hurdles, there is still this question about inflation, which is a bit of a concern, more than a bit of concern, as we indicated in our statement. Our outlook is still for inflation to go back to 2 percent. I gave you some reasons why I think that will happen. But we take that very seriously. And if inflation does not show signs of returning to target, we will take appropriate action.”

8. What impact has fiscal policy had on the recovery?

“We’ve had very tight — on the whole, except for in 2009, we’ve had very tight fiscal policy. People don’t appreciate how tight fiscal policy has been. At this stage in the last recession, which was a much milder recession, state, local and federal governments had hired 400,000 additional workers from the trough of the — of the recession. At the same point in this recovery, the change in state, local and federal government workers is minus 600,000. So there’s about a million workers’ difference in how many people are being employed at all levels of government. So fiscal policy has been tight, contractionary.”

9. What is your view on the recent budget deal?
“I will say a couple of things about this deal. One is that, relative to where we were in September and October, it certainly is nice that there has been a bipartisan deal and that it looks like it’s going to pass both houses of Congress. It’s also, at least directionally, what I have recommended in testimony, which is that it eases a bit the fiscal restraint in the next couple
of years, a period where the economy needs help to finish the recovery. And in place of that it achieves savings further out in the — in the 10-year window. So those things are positive things. Of course there’s a lot more work to be done. I have no doubt about that. But it’s certainly a better situation than we had in September and October, or in January during the fiscal cliff, for that matter. And I think it will be good for confidence if fiscal policy and congressional leaders work together to — even if — even if the outcomes are small, as this one was, it’s a good thing that they are working cooperatively and making some progress.

10. Has the large budget deficit weighed on the recovery?

“I mean, investment is driven by sales, by the need for capacity. And, you know, with a slow-growing GDP, slow-growing economy, most firms yet — do not yet feel that much pressure on their capacity to do major new projects. There’s also a variety of uncertainties out there — fiscal, regulatory tax and so on — that no doubt affects some of these calculations…I think there are a lot of factors. Usually you think that the way that a deficit or a long-term debt would affect investment would be through what’s called
crowding out, that it’s raising interest rates. But high interest rates — we may have many problems, but high interest rates is not our problem right now. There’s plenty of — particularly for larger firms, there’s plenty of credit available at low interest rates.”

Fed Watch: Employment Metrics
Outside of “Ben’s Top 10,” we learned that the Fed is indeed watching the employment metrics that we have written about several times this year:

  • The quit rate;
  • The hiring rate;
  • Job openings;
  • Wages;
  • Long-term unemployment; and
  • The participation rate.

Fed Watch: Inflation Factors
On the inflation front, Bernanke opined that some special factors are holding inflation back now and that inflation may pick up in the coming months. He said the FOMC is watching:

  • Health care costs;
  • Inflation expectations (as measured by markets and surveys of individuals and professionals);
  • Wage inflation;
  • U.S. and international GDP growth.

Figure_1_001

The Fed delivered a holiday surprise for the market — a bullish forecast via a signal that it will remain “highly accommodative” with low interest rates for longer . As we have discussed, we view the Fed’s decision as reaffirming our outlook for accelerating economic and profit growth in 2014. We continue to believe 2014 marks a return to a focus on the fundamentals of investing.

___________________________________________________________________________________________________________________________

IMPORTANT DISCLOSURES
The opinions voiced in this material are for general information only and are not intended to provide specific advice or recommendations for any individual. To determine which investment(s) may be appropriate for you, consult your financial advisor prior to investing. All performance reference is historical and is no guarantee of future results. All indices are unmanaged and cannot be invested into directly.

The economic forecasts set forth in the presentation may not develop as predicted and there can be no guarantee that strategies promoted will be successful.

Stock investing involves risk including loss of principal.

This research material has been prepared by LPL Financial.
To the extent you are receiving investment advice from a separately registered independent investment advisor, please note that LPL Financial is
not an affiliate of and makes no representation with respect to such entity.

Not FDIC/NCUA Insured | Not Bank/Credit Union Guaranteed | May Lose Value | Not Guaranteed by any Government Agency | Not a Bank/Credit Union Deposit

Member FINRA/SIPC

Navigating the Markets
November 26, 2013

Compass Changes

  • No Changes

Investment Takeaways

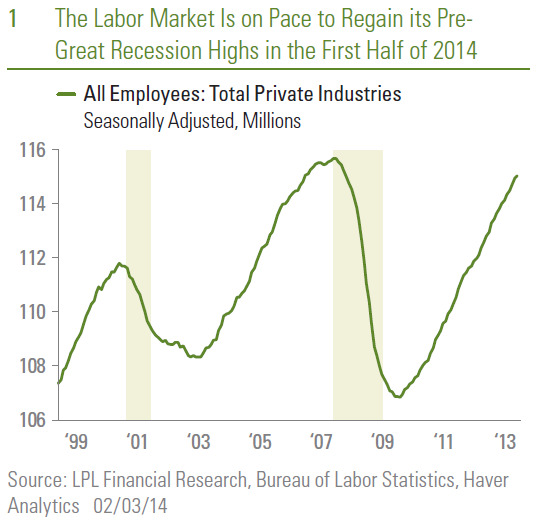
  • We expect the S&P 500 Index to grind higher through year-end, supported by durable U.S. economic growth, accommodative Federal Reserve (Fed) policy, and earnings gains.

  • Our positive small cap view reflects our U.S. focus and potential to capture further stock market gains.

  • We continue to favor the more U.S.-focused, consumer-oriented sectors over the global, export-focused sectors.

  • We find bond valuations roughly fair and expect yields to remain largely range-bound through year-end.

  • Higher-yielding, fundamentally sound segments of the bond market such as high-yield bonds, bank loans, and preferred securities remain among the more attractive fixed income options.

  • Among high-quality bonds, we favor investment-grade corporate bonds due to the potential for higher yields and good fundamentals.

  • We find high-yield municipal bonds attractive, but high-quality municipal bonds possess more attractive valuations and compelling taxable-equivalent yields.

  • From a technical perspective, the S&P 500 Index price continues to make new all-time highs, establishing a new bullish price objective at 1845.

Broad Asset Class Views

LPL Financial Research’s views on stocks, bonds, cash, and alternatives are illustrated below. The positions of negative, neutral, or positive are indicated by the solid black compass needle, while an outlined needle shows a previous view.

Figure_1_001

Equity & Alternative Asset Classes

Favor Small Caps for U.S. Focus Potential for Further Stock Market Gains

  • We expect the S&P 500 Index to continue to grind higher over the balance of the year, supported by durable U.S. economic growth, accommodative Fed policy, and earnings gains.
  • We favor small caps for their potential to capture further stock market gains.

  • We favor U.S. stocks relative to emerging markets (EM) and developed foreign, as Europe struggles to grow, and the growth trajectory in several key EM countries has been uneven. The recent pickup in China’s growth is encouraging.

  • We maintain a preference for growth over value due to growth’s tendency to outperform in slow-growth environments and our positive consumer discretionary view.

  • We believe further downside to crude oil (WTI) may be limited in the near term from a technical perspective, though the latest inventory data and relative calm in the Middle East are bearish.

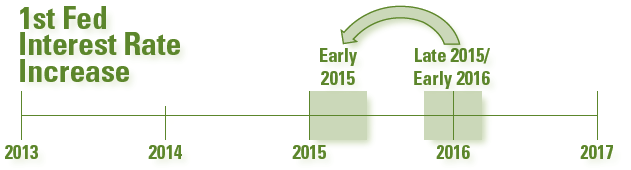
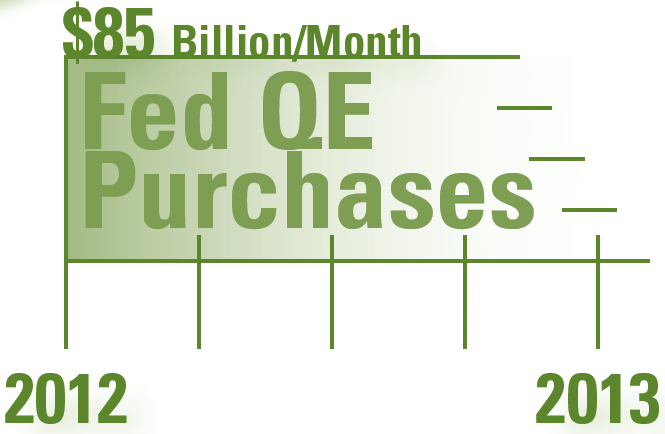
  • The potential for the Fed not to taper its bond purchases until after the New Year may provide near-term support for gold.

Figure_2

Equity Sectors

Maintain Preference for U.S. and Consumer-Focused Cyclical Sectors

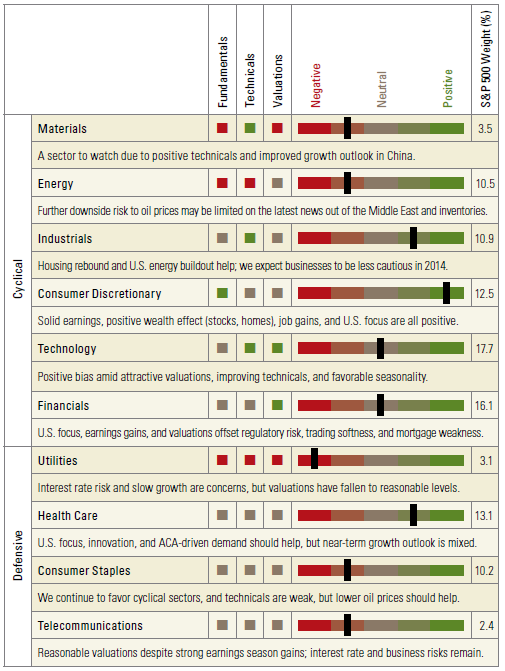
  • We continue to favor the more U.S.- focused, consumer-oriented sectors over the global, export-focused sectors.

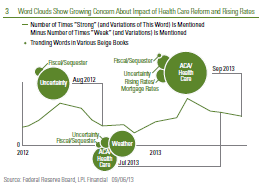
  • Our consumer discretionary view remains positive as spending continues to increase, albeit modestly, and the housing recovery continues despite higher mortgage rates.

  • Our financials view is neutral. We see the U.S. focus, earnings gains, and valuations as positives, although mortgage activity, fixed income trading, and regulation remain concerns.

  • Our modestly positive health care view reflects our U.S. focus, robust pace of product innovation, and demand uptick from the Affordable Care Act (ACA).

  • The materials sector is one to watch for a potentially more positive view due to positive technicals and evidence of a pickup in growth in China.

  • We expect a potential pickup in business spending and improving growth in China to help industrials sector performance.

  • We remain cautious on telecom and utilities due to their interest rate sensitivity, though telecom valuations have become more reasonable in recent months.

  • Our recent downgrade in our consumer staples view was driven by above-average valuations and weakening technicals, but lower oil prices help the outlook.

Figure_3

Fixed Income

A New Yield Range

  • We find bond valuations roughly fair and expect bond prices and yields to continue to be largely range-bound between now and year-end 2013.

  • We believe intermediate maturity bonds provide a better risk/return trade-off compared to short-term bonds.

  • We find high-yield municipal bonds attractive, but high-quality municipal bonds possess more attractive valuations and compelling taxable-equivalent yields.

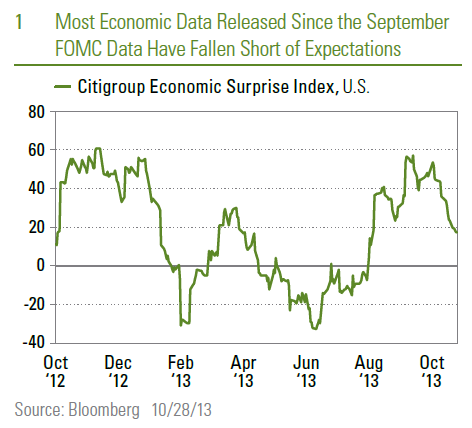
  • A modest rise in yields to start November shows the bond market remains sensitive to tapering fears, but clarity from economic data, Washington, and the Fed may take months to become evident.

  • Higher-yielding, fundamentally sound segments of the bond market such as high-yield bonds, bank loans, and preferred securities remain among the more attractive fixed income options.

  • Among high-quality bonds, we favor investment-grade corporate bonds due to the potential for higher yields and good fundamentals.

Figure_4

Figure_5

All performance referenced herein is as of November 19, 2013, unless otherwise noted.

Global macro strategies risk include but are not limited to imperfect knowledge of macro events, divergent movement from macro events, loss of principal, and related geopolitical risks.

Real estate/REITs may result in potential illiquidity and there is no assurance the objectives of the program will be attained. The fast price swings of commodities will result in significant volatility in an investor’s holdings. International and emerging markets involve special risks such as currency fluctuation and political instability. The price of small and mid-cap stocks are generally more volatile than large cap stocks. Value investments can perform differently from the market as a whole. They can remain undervalued by the market for long periods of time. Precious metal investing is subject to substantial fluctuation and potential for loss. These securities may not be suitable for all investors. Alternative strategies may not be suitable for all investors and should be considered as an investment for the risk capital portion of the investor’s portfolio. The strategies employed in the management of alternative investments may accelerate the velocity of potential losses. Stock investing may involve risk including loss of principal.

Because of their narrow focus, sector investing will be subject to greater volatility than investing more broadly across many sectors and companies.

For the purposes of this publication, intermediate-term bonds have maturities between three and 10 years, and short-term bonds are those with maturities of less than three years.

All bonds are subject to market and interest rate risk if sold prior to maturity. Bond values will decline as interest rates rise and are subject to availably and change in price. High-yield/junk bonds are not investment-grade securities, involve substantial risks, and generally should be part of the diversified portfolio of sophisticated investors. Municipal interest income may be subject to the alternative minimum tax. Federally tax-free but other state and local taxes may apply. Corporate bonds are considered higher risk than government bonds but normally offer a higher yield and are subject to market, interest rate and credit risk as well as additional risks based on the quality of issuer coupon rate, price, yield, maturity, and redemption features.

______________________________________________________________________________________________________________________________

DEFINITIONS:

EQUITY AND ALTERNATIVES ASSET CLASSES

Large Growth: Stocks in the top 70% of the capitalization of the U.S. equity market are defined as Large Cap. Growth is defined based on fast growth (high growth rates for earnings,

sales, book value, and cash flow) and high valuations (high price ratios and low dividend yields).

Large Value: Stocks in the top 70% of the capitalization of the U.S. equity market are defined as Large Cap. Value is defined based on low valuations (low price ratios and high dividend yields) and slow growth (low growth rates for earnings, sales, book value, and cash flow).

Mid Growth: The U.S. mid-cap range for market capitalization typically falls between $1 billion and $8 billion and represents 20% of the total capitalization of the U.S. equity market. Growth is defined based on fast growth (high growth rates for earnings, sales, book value, and cash flow) and high valuations (high price ratios and low dividend yields).

Mid Value: The U.S. Mid Cap range for market capitalization typically falls between $1 billion and $8 billion and represents 20% of the total capitalization of the U.S. equity market. Value is defined based on low valuations (low price ratios and high dividend yields) and slow growth (low growth rates for earnings, sales, book value, and cash flow).

Small Growth: Stocks in the bottom 10% of the capitalization of the U.S. equity market are defined as Small Cap. Growth is defined based on fast growth (high growth rates for earnings, sales, book value, and cash flow) and high valuations (high price ratios and low dividend yields).

Small Value: Stocks in the bottom 10% of the capitalization of the U.S. equity market are defined as Small Cap. Value is defined based on low valuations (low price ratios and high dividend yields) and slow growth (low growth rates for earnings, sales, book value, and cash flow).

U.S. Stocks: Stock of companies domiciled in the U.S.

Large Foreign: Large-cap foreign stocks have market capitalizations greater than $5 billion. The majority of the holdings in the large foreign category are in the MSCI EAFE Index.

Small Foreign: Small-cap foreign stocks typically have market capitalizations of $250M to $1B. The majority of the holdings in the small foreign category are in the MSCI Small Cap EAFE Index.

Emerging Markets: Stocks of a single developing country or a grouping of developing countries. For the most part, these countries are in Eastern Europe, Africa, the Middle East, Latin America, the Far East and Asia.

REITs: REITs are companies that develop and manage real-estate properties. There are several different types of REITs, including apartment, factory-outlet, health-care, hotel, industrial, mortgage, office, and shopping center REITs. This would also include real-estate operating companies.

Commodities – Industrial Metals: Stocks in companies that mine base metals such as copper, aluminum and iron ore. Also included are the actual metals themselves. Industrial metals companies are typically based in North America, Australia, or South Africa.

Commodities – Precious Metals: Stocks of companies that do gold- silver-, platinum-, and base-metal-mining. Precious-metals companies are typically based in North America, Australia, or South Africa.

Commodities – Energy: Stocks of companies that focus on integrated energy, oil & gas services, oil & gas exploration and equipment. Public energy companies are typically based in North

America, Europe, the UK, and Latin America.

Merger Arbitrage is a hedge fund strategy in which the stocks of two merging companies are simultaneously bought and sold to create a riskless profit. A merger arbitrageur looks at the risk that the merger deal will not close on time, or at all. Because of this slight uncertainty, the target company’s stock will typically sell at a discount to the price that the combined company will have when the merger is closed. This discrepancy is the arbitrageur’s profit.

Long/Short is an investment strategy generally associated with hedge funds. It involves buying long equities that are expected to increase in value and selling short equities that are expected to decrease in value.

______________________________________________________________________________________________________________________________

EQUITY SECTORS

Materials: Companies that engage in a wide range of commodity-related manufacturing. Included in this sector are companies that manufacture chemicals, construction materials, glass, paper, forest products and related packaging products, metals, minerals and mining companies, including producers of steel.

Energy: Companies whose businesses are dominated by either of the following activities: The construction or provision of oil rigs, drilling equipment and other energy-related service and equipment, including seismic data collection or the exploration, production, marketing, refining and/or transportation of oil and gas products, coal and consumable fuels.

Industrials: Companies whose businesses: Manufacture and distribute capital goods, including aerospace and defense, construction, engineering and building products, electrical equipment and industrial machinery; provide commercial services and supplies, including printing, employment, environmental and office services; provide transportation services, including airlines, couriers, marine, road and rail, and transportation infrastructure.

Consumer Discretionary: Companies that tend to be the most sensitive to economic cycles. Its manufacturing segment includes automotive, household durable goods, textiles and apparel, and leisure equipment. The service segment includes hotels, restaurants and other leisure facilities, media production and services, consumer retailing and services and education services.

Technology: Companies that primarily develop software in various fields such as the Internet, applications, systems and/or database management and companies that provide information technology consulting and services. Technology hardware & equipment include manufacturers and distributors of communications equipment, computers and peripherals, electronic equipment and related instruments, and semiconductor equipment and products.

Financials: Companies involved in activities such as banking, consumer finance, investment banking and brokerage, asset management, insurance and investment, and real estate, including REITs.

Utilities: Companies considered electric, gas or water utilities, or companies that operate as independent producers and/or distributors of power.

Health Care: Companies in two main industry groups: Healthcare equipment and supplies or companies that provide healthcare-related services, including distributors of healthcare products, providers of basic healthcare services, and owners and operators of healthcare facilities and organizations or companies primarily involved in the research, development, production and marketing of pharmaceuticals and biotechnology products.

Consumer Staples: Companies whose businesses are less sensitive to economic cycles. It includes manufacturers and distributors of food, beverages and tobacco, and producers of nondurable household goods and personal products. It also includes food and drug retailing companies.

Telecommunications: Companies that provide communications services primarily through a fixed line, cellular, wireless, high bandwidth and/or fiber-optic cable network.

______________________________________________________________________________________________________________________________

FIXED INCOME

Credit Quality: An individual bond’s credit rating is determined by private independent rating agencies such as Standard & Poor’s, Moody’s and Fitch. Their credit quality designations range from high (‘AAA’ to ‘AA’) to medium (‘A’ to ‘BBB’) to low (‘BB’, ‘B’, ‘CCC’, ‘CC’ to ‘C’).

Duration: A measure of the sensitivity of the price (the value of principal) of a fixed-income investment to a change in interest rates. Duration is expressed as a number of years. Rising interest rates mean falling bond prices, while declining interest rates mean rising bond prices. The bigger the duration number, the greater the interest-rate risk or reward for bond prices.

Munis – Short-term: Bonds issued by various state and local governments to fund public projects. The income from these bonds is generally free from federal taxes. These bonds generally have maturities of less than three years.

Munis – Intermediate: Bonds issued by various state and local governments to fund public projects. The income from these bonds is generally free from federal taxes. These bonds generally have maturities of between 3 and 10 years.

Munis – Long-term: Bonds issued by various state and local governments to fund public projects. The income from these bonds is generally free from federal taxes. These bonds generally have maturities of more than 10 years.

Munis – High-yield: Bonds issued by various state and local governments to fund public projects. The income from these bonds is generally free from federal taxes. These bonds generally offer higher yields than other types of bonds, but they are also more vulnerable to economic and credit risk. These bonds are rated BB+ and below.

Treasuries: A marketable, fixed-interest U.S. government debt security. Treasury bonds make interest payments semi-annually and the income that holders receive is only taxed at the federal level.

TIPS (Treasury Inflation Protected Securities): A special type of Treasury note or bond that offers protection from inflation. Like other Treasuries, an inflation-indexed security pays interest every six months and pays the principal when the security matures. The difference is that the underlying principal is automatically adjusted for inflation as measured by the consumer price index (CPI).

Mortgage-Backed Securities: A type of asset-backed security that is secured by a mortgage or collection of mortgages. These securities must also be grouped in one of the top two ratings as determined by a accredited credit rating agency, and usually pay periodic payments that are similar to coupon payments. Furthermore, the mortgage must have originated from a regulated and authorized financial institution.

Investment-Grade Corporates: Securities issued by corporations with a credit ratning of BBB- or higher. Bond rating firms, such as Standard & Poor’s, use different designations consisting of upper- and lower-case letters ‘A’ and ‘B’ to identify a bond’s investment-grade credit quality rating. ‘AAA’ and ‘AA’ (high credit quality) and ‘A’ and ‘BBB’ (medium credit quality) are considered investment-grade.

Preferred Stocks: A class of ownership in a corporation that has a higher claim on the assets and earnings than common stock. Preferred stock generally has a dividend that must be paid out before dividends to common stockholders and the shares usually do not have voting rights.

High-Yield Corporates: Securities issued by corporations with a credit rating of BB+ and below. These bonds generally offer higher yields than investment-grade bonds, but they are also more vulnerable to economic and credit risk.

Bank Loans: In exchange for their credit risk, these floating-rate bank loans offer interest payments that typically float above a common short-term benchmark such as the London interbank offered rate, or LIBOR.

Foreign Bonds – Hedged: Non-U.S. fixed income securities generally from investment-grade issuers in developed countries, with hedged currency exposure.

Foreign Bonds – Unhedged: Non-U.S. fixed income securities normally denominated in major foreign currencies.

Emerging Market Debt: The debt of sovereigns, agencies, local issues, and corporations of emerging markets countries and subject to currency risk.

______________________________________________________________________________________________________________________________

IMPORTANT DISCLOSURES

The opinions voiced in this material are for general information only and are not intended to provide or be construed as providing specific investment advice or recommendations for any individual. To determine which investments may be appropriate for you, consult your financial advisor prior to investing. All performance referenced is historical and is no guarantee of future results. All indexes are unmanaged and cannot be invested into directly.

Past performance is no guarantee of future results.

Stock investing involves risk including loss of principal.

Preferred stock investing involves risk, which may include loss of principal.

Distressed investing involves significant risks, including a total loss of capital. The risks associated with distressed investing arise from several factors including: limited diversification, the use of leverage, limited liquidity, and the possibility that investors may be required to accept cash or securities with a value less than their original investment and/or may be required to accept payment over an extended period of time.

The Standard & Poor’s 500 Index is a capitalization-weighted index of 500 stocks designed to measure performance of the broad domestic economy through changes in the aggregate market value of 500 stocks representing all major industries.

Quantitative easing is a government monetary policy occasionally used to increase the money supply by buying government securities or other securities from the market. Quantitative easing increases the money supply by flooding financial institutions with capital in an effort to promote increased lending and liquidity.

______________________________________________________________________________________________________________________________

This research material has been prepared by LPL Financial.

To the extent you are receiving investment advice from a separately registered independent investment advisor, please note that LPL Financial is not an affiliate of and makes no representation with respect to such entity.

Not FDIC or NCUA/NCUSIF Insured | No Bank or Credit Union Guarantee | May Lose Value | Not Guaranteed by any Government Agency | Not a Bank/Credit Union Deposit

Member FINRA/SIPC

Fall FOMC FAQ
October 29, 2013

Will the Fed announce tapering at this week’s FOMC meeting?

The Fed is unlikely to announce that it is ready to begin scaling back/tapering its bond-purchase program, known as quantitative easing (QE), at this week’s meeting. The Federal Reserve (Fed) will hold its seventh (of eight) Federal Open Market Committee (FOMC) meetings this year on Tuesday and Wednesday, October 29 and 30, 2013.

Why is the Fed not likely to taper at this week’s FOMC meeting?

The main reason is the lack of visibility on the economy for Fed policymakers, due largely to the 16-day government shutdown that ended in mid-October 2013. The shutdown delayed a large number of crucial economic reports that Fed policymakers would like to have seen prior to this week’s meeting. In addition, the data that have been released since the September 17 – 18 FOMC meeting have generally been disappointing relative to expectations.

How has the economy evolved since the last FOMC meeting in mid-September 2013?

Figure_1

Figure 1 shows the Citigroup Economic Surprise Index for the United States over the past 12 months. The index measures data surprises relative to market expectations. A rising line means that data releases have been stronger than expected, and a falling line means that data releases have been worse than expected. The recent peak in the index came in early September 2013, just prior to the mid-September FOMC meeting. The reports released since mid-September that have fallen short of expectations include:

  • Housing starts (August)
  • Richmond Fed Index (September)
  • Consumer Confidence (September)
  • Durable goods orders and shipments (September)
  • Pending home sales (August)
  • Markit PMI – Manufacturing (September)
  • Vehicle sales (September)
  • ISM – Non-Manufacturing (September)
  • Small Business Sentiment Index (September)
  • Empire State Manufacturing Index (October)
  • Existing home sales (September)
  • Payroll employment (September)
  • Markit PMI – Manufacturing (October)
  • Durable goods orders and shipments (October)

How have financial conditions changed since the last FOMC meeting?

The Fed cited tightening financial conditions as one of the reasons it chose not to begin tapering at the September 17 – 18, 2013 FOMC meeting.  Figure 2 shows financial conditions – as measured by the Federal Reserve Bank of Chicago’s Financial Conditions Index — have eased since the September FOMC meeting, after tightening over the spring and summer of 2013. Note that despite tightening financial conditions between May and September 2013, they never even got close to where they were during the 2007 – 2009 financial crisis.

Figure_2

Will the FOMC specifically mention the government shutdown in its statement?

There is a strong likelihood that the FOMC statement will mention the recent government shutdown, and the minutes of this week’s FOMC meeting — due out in mid-November 2013 — will almost certainly mention it. The statements released during and just after the 21-day government shutdown in December 1995 and January 1996 did not specifically mention the shutdown, but in those days, FOMC statements were not as verbose as they are today. However, a quick look at the minutes from the December 19, 1995 and January 30 – 31, 1996 meetings finds that both sets of minutes did mention the shutdown and its impact on the economy. The minutes of the January 31, 1996 meeting mentioned the shutdown’s impact on the availability of economic data.

Excerpt from the minutes of the December 19, 1995 FOMC meeting:

The decline in federal purchases in part represented the transitory effects of government shutdowns and the restraining effects of spending cuts imposed by continuing resolutions and by curtailed appropriations in bills that already had been enacted into law.

Excerpts from the minutes of the January 30 – 31, 1996 FOMC meeting:

Only a limited amount of new information was available for this meeting because of delays in government releases…

…these buildups, together with the disruptions from government shutdowns…

The weakness in business activity this winter was to some extent the result of the partial shutdown of the federal government…

What else will we hear from the FOMC this week?

The only communication from the Fed at the conclusion of the meeting will be the FOMC statement, which will be released at 2 PM ET on Wednesday, October 30, 2013. There will be no new economic and interest rate forecast from members of the FOMC, nor will Fed Chairman Ben Bernanke hold a press conference. Market participants will have to wait until the conclusion of the December 17 – 18, 2013 FOMC meeting for the next economic and interest rate forecasts from the FOMC. The press conference following that meeting will be Ben Bernanke’s last as Fed Chairman. We expect that in the near future, the FOMC will strongly consider holding a press conference at each of its eight meetings per year. Many other major central banks across the globe hold press conferences and release forecasts at the conclusion of all of their meetings. In addition, most global central banks hold meetings once a month.

It’s nearly two months away, but what about the next FOMC meeting (December 17 – 18)?

As we noted in last week’s (October 21, 2013) Weekly Economic Commentary: The Lowdown on the ShutdownThe Impact on the Economy and the Fed, the 16-day government shutdown caused delays in the government’s data collection and reporting process for economic data. Since the government’s economic data calendar will not be back to normal until early December, it is unlikely Fed policymakers will announce tapering at the December 17 – 18 FOMC meeting.

An additional hurdle to tapering is the timing of the next government shutdown and debt ceiling debate. Under the terms of the bill passed by Congress in mid-October 2013 to end the shutdown and lift the debt ceiling, the government could shut down again in mid-January 2014, and the Treasury could hit its borrowing limit by early February 2014. While we see this as unlikely, as has been the case in the past few years,these deadlines create uncertainty for the public, market participants, and policymakers and could weigh on economic activity.

In addition, a special bipartisan House-Senate conference committee charged with breaking the impasse on the budget is scheduled to issue a report on December 13, 2013, just days before the December 17 – 18, 2013 FOMC meeting. While a “grand bargain” on the budget might pave the way for the Fed to taper in December 2013, the more likely outcome is that the rancor surrounding this report will only add to the fiscal uncertainty, which argues for a Fed taper in early 2014 and not at the December 17 – 18, 2013 meeting. Of course, if Congress can agree in the next few weeks (for example, by Thanksgiving) on a deal that would eliminate the possibility of another shutdown and bruising debate about the debt ceiling in early 2014, a December taper becomes more likely.

______________________________________________________________________________________________________________________________

IMPORTANT DISCLOSURES

The opinions voiced in this material are for general information only and are not intended to provide specific advice or recommendations for any individual. To determine which investment(s) may be appropriate for you, consult your financial advisor prior to investing. All performance reference is historical and is no guarantee of future results. All indices are unmanaged and cannot be invested into directly.

The economic forecasts set forth in the presentation may not develop as predicted and there can be no guarantee that strategies promoted will be successful.

Stock investing involves risk including loss of principal.

Quantitative easing is a government monetary policy occasionally used to increase the money supply by buying government securities or other securities from the market. Quantitative easing increases the money supply by flooding financial institutions with capital in an effort to promote increased lending and liquidity.

The Federal Open Market Committee (FOMC), a committee within the Federal Reserve System, is charged under the United States law with overseeing the nation’s open market operations (i.e., the Fed’s buying and selling of U.S. Treasury securities).

______________________________________________________________________________________________________________________________

INDEX DESCRIPTIONS

Citigroup Economic Surprise Index (CESI) measures the variation in the gap between the expectations and the real economic data.

The National Financial Conditions Index (NFCI) measures risk, liquidity and leverage in money markets and debt and equity markets as well as in the traditional and “shadow” banking systems. Positive values of the NFCI indicate financial conditions that are tighter than average, while negative values indicate financial conditions that are looser than average.

___________________________________________________________________________________________________________________

This research material has been prepared by LPL Financial.

To the extent you are receiving investment advice from a separately registered independent investment advisor, please note that LPL Financial is not an affiliate of and makes no representation with respect to such entity.

Not FDIC/NCUA Insured | Not Bank/Credit Union Guaranteed | May Lose Value | Not Guaranteed by any Government Agency | Not a Bank/Credit Union Deposit

Member FINRA/SIPC


Communication Breakdown?
September 24, 2013

Communication Breakdown?

In our recent Weekly Economic Commentary: Trust (September 9, 2013), we argued that there was not a clear-cut case for tapering based only on the economic or inflation backdrop. Instead, our view was that concerns expressed by Federal Reserve (Fed) officials over the past six months or so — that additional quantitative easing (QE) could potentially disrupt the smooth functioning of securities markets, cause investors to take on excessive risk and “reach for yield,” and add to financial instability in the global economy — would tip the scales in favor of a taper. Perhaps more important, in our view, were shifting market expectations since Fed Chairman Ben Bernanke’s testimony before the Joint Economic Committee of Congress in May of this year, when he said:

If we see continued improvement, and we have confidence that that is going to be sustained, in the next few meetings we could take a step down in our pace of purchases.

Financial market participants had since come to expect that the Fed would begin to taper this month, absent a major downshift in the economy. Our view was that if the Fed did not follow through on tapering, it risked losing the market’s hard-earned trust, and any trust the markets have in the Fed today will likely come in handy when the Fed has to begin removing stimulus and raising rates in the years ahead.

“The Song Remains the Same”

Ultimately, however, the trust argument did not win the day. The Fed surprised almost everyone last week (September 16 – 20) as the Fed’s policymaking arm, the Federal Open Market Committee (FOMC), voted to maintain its current pace of combined purchases at $85 billion of Treasuries and agency mortgage-backed securities (MBS) as part of its QE program. In making the decision, the FOMC cited tightening financial conditions (likely largely in the form of higher mortgage rates and the flow of credit to small- and medium-sized businesses), the looming fiscal debates, the still-sluggish economy (real gross domestic product [GDP] growth is tracking below 2.0% in the third quarter of 2013), and the sluggish labor market as the reasons for continuing purchases at the same level. In addition to maintaining the current pace of QE, the FOMC strengthened its commitment to keeping its fed funds rate target — currently near zero — at that level until well after it finally winds down its QE program.

2013-09-24_Figure_1

The FOMC’s actions surprised market participants, who expected the FOMC to begin tapering its purchases to around $70 or $75 billion per month, from the current $85 billion per month, and also to confirm that QE would end by mid-2014. Instead, the FOMC backed away from its earlier guidance about ending QE in mid-2014, suggesting a later start date for tapering and a later end date for QE, likely late 2014. In his prepared remarks prior to his post-FOMC meeting press conference on Wednesday, September 18, 2013, and during the Q&A period of the press conference itself, Bernanke worked hard to convince markets that tapering was not tightening, noting:

…even after asset purchases are wound down — which we will do in a manner that is both deliberate and dependent on the incoming economic data — the Federal Reserve’s rate guidance and its ongoing holdings of securities will ensure that monetary policy remains highly accommodative.

“Good Times, Bad Times”

A quick review of the public appearances made by Bernanke and his colleagues on the FOMC since early May 2013, as well as the FOMC statements and minutes from the June and July FOMC meetings, do show that Fed officials essentially repeated that same mantra — predicating a tapering this fall on better data. Markets, especially fixed income and many emerging markets, reacted swiftly to (some of) Bernanke’s words during the spring and summer and drove bond yields sharply higher, largely ignoring the data dependent part of the Fed’s case.
Looking ahead, market participants may need to recalibrate how they listen to the Fed, and the Fed may need to rethink how it communicates with the markets and the public. In an effort to aid the market, and be more transparent, Bernanke laid out the Fed’s action plan for the next several FOMC meetings in several key passages from last week’s post-FOMC press conference [“Ramble On”]. In addition, Bernanke specifically mentioned several metrics the FOMC will be watching in the coming months as it decides whether or not to taper. The indicators he mentioned were:

Inflation

  • The personal consumption deflator excluding food and energy (also known as the core PCE deflator)

The Labor Market

  • Private sector job count
  • Unemployment rate
  • Initial claims for unemployment insurance
  • Aggregate hours worked
  • Consumers’ assessment of whether jobs were easy or hard to get
  • The labor market participation rate
  • The median duration of unemployment
  • Real wages
  • Discouraged workers

Financial Conditions

  • The Federal Reserve Bank of Chicago’s Financial Conditions Index

Fiscal Policy

  • Rasmussen Consumer Sentiment Index, as a proxy for the public’s concern over the looming debates in Congress over the government shutdown(September 30, 2013) and the debt ceiling (mid- to late-October)

2013-09-24_Figure_22013-09-24_Figure_2a

In Figures 1 – 4, we show the recent performance of these important metrics. Inflation remains well below the Fed’s 2% target. Our view is that there are still plenty more factors pushing down on inflation than pushing it up. The next core personal consumption expenditure (PCE) reading (for August 2013) is due out this Friday, September 27, 2013. In Figure 2, we’ve grouped the labor market metrics mentioned by Bernanke into two categories. On the left side of the page are the indicators that Bernanke mentioned as showing some improvement in recent months. The indicators on the right side of the page detail the labor market metrics that have underperformed the Fed’s expectations. While the claims data are released weekly, and the jobs easy-to-get/hard-to-get metric is released along with the consumer confidence data (due out Tuesday, September 24), the market will have to wait until October 4 for the September employment report. With just one more report on the labor market prior to the October 30, 2013 FOMC meeting, it is unlikely that the FOMC would have enough additional evidence that the labor market was improving to take any action on tapering.

Figure 3 does show that financial conditions have tightened since May, and Bernanke’s comments last week suggest that most of this tightening was unwelcome by Fed policymakers. We chose this particular metric (from the Chicago Fed National Financial Conditions Index) to highlight because Bernanke has mentioned it recently, but there are many other measures of financial conditions (St. Louis Fed Financial Stress Index, Senior Loan Officers Survey, and Bloomberg Financial Conditions Index, to name a few) that we and the market will be tracking closely in the weeks ahead. If financial conditions are tighter in late October than they are today, it is unlikely that the Fed would opt to taper at the October 30 FOMC meeting.

2013-09-24_Figure_3

“When the Levee Breaks”

Also arguing against an October taper is the fiscal situation. We chose to use the Rasmussen Consumer Sentiment chart to illustrate consumers’ concerns with the fiscal debate in Congress [Figure 4]. Although this data point is available daily, we chose to present the monthly chart. The chart clearly shows that consumer sentiment has turned lower in recent months, posting back-to-back monthly declines for the first time since mid-2011, the last time the debt ceiling debate dominated the headlines.

2013-09-24_Figue_4

On balance, the FOMC decided at its September 2013 meeting that the weaker-than-expected readings on the economy and inflation, tightening financial conditions (partially as a result of its own communication breakdown with markets since May), and the looming fiscal debate in Congress trumped the trust argument, and chose to maintain the current pace of QE. In our view, Bernanke made a clear case to markets last week that tapering remains data dependent, and he even provided markets with specific metrics the FOMC was watching to gauge progress. One of the key takeaways from last week for markets was Bernanke’s assertion during the Q&A portion of his press conference:

…we can’t let market expectations dictate our policy actions. Our policy actions have to be determined by our best assessment of what’s needed for the economy.

Our view remains that while the Fed may not need the markets’ trust right now, it will down the road as it eventually begins to unwind all the monetary stimulus it has put into the system since 2007.

__________________________________________________________________________________________________________________________________________________________________________________

IMPORTANT DISCLOSURES

The opinions voiced in this material are for general information only and are not intended to provide specific advice or recommendations for any individual. To determine which investment(s) may be appropriate for you, consult your financial advisor prior to investing. All performance reference is historical and is no guarantee of future results. All indices are unmanaged and cannot be invested into directly.

The economic forecasts set forth in the presentation may not develop as predicted and there can be no guarantee that strategies promoted will be successful.

Government bonds and Treasury bills are guaranteed by the U.S. government as to the timely payment of principal and interest and, if held to maturity, offer a fixed rate of return and fixed principal value. However, the value of fund shares is not guaranteed and will fluctuate Mortgage-backed securities are subject to credit, default risk, prepayment risk that acts much like call risk when you get your principal back sooner than the stated maturity, extension risk, the opposite of prepayment risk, and interest rate risk.

Stock investing involves risk including loss of principal.

Quantitative easing (QE) is a government monetary policy occasionally used to increase the money supply by buying government securities or other securities from the market. Quantitative easing increases the money supply by flooding financial institutions with capital in an effort to promote increased lending and liquidity.

The Federal Open Market Committee (FOMC), a committee within the Federal Reserve System, is charged under the United States law with overseeing the nation’s open market operations (i.e., the Fed’s buying and selling of United States Treasure securities).

Gross domestic product (GDP) is the monetary value of all the finished goods and services produced within a country’s borders in a specific time period, though GDP is usually calculated on an annual basis. It includes all of private and public consumption, government outlays, investments and exports less imports that occur within a defined territory.

This research material has been prepared by LPL Financial.

To the extent you are receiving investment advice from a separately registered independent investment advisor, please note that LPL Financial is not an affiliate of and makes no representation with respect to such entity.

Not FDIC/NCUA Insured | Not Bank/Credit Union Guaranteed | May Lose Value | Not Guaranteed by any Government Agency | Not a Bank/Credit Union Deposit

Member FINRA/SIPC

Trust
September 13, 2013

Trust

The latest Beige Book (released Wednesday, September 4, 2013) and the August employment report (released Friday, September 6, 2013) likely provided Fed policymakers enough “cover” to begin scaling back QE. Figure 1 compares the latest readings on the LPL Financial Beige Book Barometer, as well as key metrics from the employment report, to the readings from September 2012, when the Federal Open Market Committee (FOMC) voted to commence the latest round of QE, dubbed QE3.

2013-09-10_Figure_2A

Data shows that the economy is not booming, the labor market is still struggling, and the Fed’s preferred measure of inflation has decelerated in recent months. All this suggests that although there is not a clear cut economic case for the Fed to begin slowing QE at the September 17 – 18 FOMC meeting, the overall economy (according to the Beige Book) and the labor market have improved modestly in the 12 months since the FOMC voted to embark on QE3.

Instead, comments over the past few months on the unintended consequences of QE from many Fed officials, including Fed Chairman Ben Bernanke, suggest that the FOMC may be questioning the efficacy of continuing to pursue QE. Therefore, they are ready to begin to taper sooner rather than later. In particular, Fed officials have expressed concerns that additional QE could potentially disrupt the smooth functioning of securities markets, cause investors to take on excessive risk and “reach for yield” in certain segments of the fixed income markets, and add to financial instability in the global economy.

Perhaps more importantly, in our view, since Fed Chairman Bernanke’s testimony before the Joint Economic Committee of Congress in May of this year, financial market participants have come to expect that the Fed would begin to taper this month, absent a major downshift in the economy. If the Fed does not follow through on tapering, it risks losing the market’s hard-earned trust; and any trust the markets have in the Fed today will likely come in handy when the Fed has to begin removing stimulus and raising rates in the years ahead.

In our view, the “trust” argument for the Fed to begin tapering QE next week is stronger than either the economic argument, or the “risks” argument; and as a result, the Fed is likely to announce modest tapering of QE next week. The latest consensus of market participants is that the Fed will trim QE by $10 – 15 billion, from $85 billion per month, to $70 – 75 billion per month. At the same time, the Fed is likely to place more emphasis on its promise to keep its key policy rate, the Fed funds rates, lower for longer; and, to rely more on this strengthened rate guidance than on QE as a policy tool in the period ahead.

Beige Book: Window on Main Street

The latest edition of the Federal Reserve’s (Fed) Beige Book, released on September 4, 2013, once again described the economy as increasing at a modest-to-moderate pace, with little wage or inflation pressures. Autos and housing, despite the recent rise in interest rates, were mentioned as key drivers of growth. As noted above, the tone of the latest Beige Book report suggests that the Fed is still on track to begin scaling back QE, but that it remains a long way from tightening monetary policy by raising its fed funds rate target.

In order to provide one snapshot of the entire Beige Book collage of data, we created our proprietary Beige Book Barometer (BBB) [Figure 2]. The barometer ticked down to +70 in September 2013 from +79 in July 2013, and +82 in June 2013. Despite the downtick since April 2013, the BBB remains well above its Superstorm Sandy-related dip to +30 in November 2012. Note that the April 2013 reading (+112) was both a post-Great Recession high and also the highest reading since 2005, suggesting a broadening and deepening of the economic expansion. The move down to +70 from +112 between the April and July 2013 editions of the Beige Books came as the number of positive words dropped and the number of negative words hit a fresh seven-year low in September 2013. The drop in the number of negative words in the Beige Book to a seven-year low can be viewed as reflecting the diminishing pace of headwinds (e.g., fiscal policy, Europe, China, housing, and general economic uncertainty ) that have hampered the U.S. economic
recovery over the past four years.

2013-09-10_Figure_2B

Our BBB, a diffusion index that measures the number of times the word “strong” or its variants (stronger, strength, strengthen, etc.) appear in the Beige Book less the number of times the word “weak” or its variants (weaken, weaker, etc.) appear, is displayed in Figure 2. The barometer is an easy-to-use, quantitative way to measure small shifts in the outlook and capture shades between strong and weak in the predominately qualitative Beige Book report.

Beige Book: How It Works

The Beige Book compiles qualitative observations made by community bankers and business owners about economic (labor market, prices, wages, housing, nonresidential construction, tourism, manufacturing) and banking (loan demand, loan quality, lending conditions) conditions in each of the 12 Fed districts (Boston, New York, Philadelphia, Kansas City, etc.). This local color that makes up each Beige Book is compiled by one of the 12 regional Federal Reserve districts on a rotating basis—the report is much more “Main Street” than “Wall Street” focused. It provides a window into economic activity around the nation using plain, everyday language. The report is prepared eight times a year ahead of each of the eight Federal Open Market Committee (FOMC) meetings. The next FOMC meeting is September 17 – 18, 2013.

The previous word clouds or text clouds, which are a visual format useful for quickly perceiving the most important words in a speech, text, report, or other transcript, are culled from the Fed’s Beige Books published last week (September 4, 2013), the prior report (July 17, 2013) and in August 2012. In general, the more often a word appears in a speech, text, report or other transcript, the larger that word appears in the word cloud. The word clouds show the top 50 words for each of the two Beige Books mentioned above. Similar words are grouped together and common words like “the,” “and,” “a,” and “is” are excluded, as are words that appear frequently in all Beige Books (federal, district, loan, level, activity, sales, conditions, firms, etc.).

How the Barometer Works

The Beige Book Barometer is a diffusion index that measures the number of times the word “strong” or its variations appear in the Beige Book less the number of times the word “weak“ or its variations appear. When the Beige Book Barometer is declining, it suggests that the economy is deteriorating. When the Beige Book Barometer is rising, it suggests that the economy is improving.

2013-09-10_Figure_3A

Word Clouds Show Growing Concern About Impact of Health Care Reform and Rising Rates

The word clouds in Figure 4 are dominated by words describing the tone of the economy when the Beige Books were published. Although not picked up in the nearby word cloud, the most notable trend in the latest Beige Book was the large uptick in the number of mentions of “health care,” “health insurance,” and the “Affordable Care Act” (ACA). There were 26 mentions of these words in the September Beige Book, up from just 15 in July. Clearly, heath care remains a major issue for Main Street as the ACA begins to be implemented. Health care, health insurance, and the Affordable Care Act were mentioned 28 times in June 2013, 26 times in April 2013, and 18 times in the March 2013 Beige Book. The topic warranted just eight mentions in the January 2013 Beige Book. In contrast, those words were found just a handful of times in the Beige Book released a year ago (July and August 2012). We will continue to monitor these health care words closely in the upcoming Beige Books, as the economy continues to adjust to the impact of the ACA. We expect this set of words to grow in importance in the coming months.

2013-09-10_Figure_4A

There were nine mentions of “mortgage rates”/”rising rates” in the September 4, 2013 Beige Book, up from just five in July 2013. There were no mentions of rising rates in the June 2013 Beige Book nor in the Beige Books in July or August 2013. Despite the rise in rates, the Beige Book noted that “attractive financing conditions and pent-up demand supported a robust pace of automobile sales in most Districts” and that “rising home prices and mortgage interest rates may have spurred a pickup in recent market activity, as many ‘fence sitters’ were prompted to commit to purchases.” Rising rates and their impact across all sectors of the economy will be important to monitor in the coming quarters as the Fed begins to scale back quantitative easing.

_________________________________________________________________________________________________________________________________________________________________________________

IMPORTANT DISCLOSURES

The opinions voiced in this material are for general information only and are not intended to provide specific advice or recommendations for any individual. To determine which investment(s) may be appropriate for you, consult your financial advisor prior to investing. All performance reference is historical and is no guarantee of future results. All indices are unmanaged and cannot be invested into directly.

The economic forecasts set forth in the presentation may not develop as predicted and there can be no guarantee that strategies promoted will be successful.

Stock investing involves risk including loss of principal.

Quantitative easing (QE) is a government monetary policy occasionally used to increase the money supply by buying government securities or other securities from the market. Quantitative easing increases the money supply by flooding financial institutions with capital in an effort to promote increased lending and liquidity.

The Federal Open Market Committee (FOMC), a committee within the Federal Reserve System, is charged under the United States law with overseeing the nation’s open market operations (i.e., the Fed’s buying and selling of United States Treasure securities).

This research material has been prepared by LPL Financial.

To the extent you are receiving investment advice from a separately registered independent investment advisor, please note that LPL Financial is not an affiliate of and makes no representation with respect to such entity.

Not FDIC/NCUA Insured | Not Bank/Credit Union Guaranteed | May Lose Value | Not Guaranteed by any Government Agency | Not a Bank/Credit Union Deposit

Member FINRA/SIPC

Sizzling Summer Fed FAQ
June 18, 2013

What Is the Schedule of Events for the Fed This Week?

The Federal Reserve (Fed) holds its fourth (of eight this year) Federal Open Market Committee (FOMC) meeting this Tuesday and Wednesday, June 18 – 19. The meeting will be followed by an FOMC statement, and the FOMC’s latest economic and Fed funds projections at 2 PM ET. Fed Chairman Ben Bernanke’s second (of four) press conference of 2013 begins at 2:30 PM ET.

Will the Fed Raise Rates at This Meeting?

Since mid-May 2013, the market has moved up the date of the first Fed rate hike from late 2015/early 2016 to early 2015. In our view, the Fed is likely to keep rates lower for longer than the market now anticipates. This should help keep a lid on longer-term interest rates, such as the 10-year Treasury, and on instruments like mortgage rates, which are closely tied to the yield on Treasuries.

1st_Fed_Interest_Rate_Increase

If the Fed Is Tapering Quantitative Easing (QE), Is It Tightening Monetary Policy?

No. As long as the Fed’s balance sheet is expanding, the Fed is easing monetary policy. In late 2010, President of the New York Fed William Dudley suggested in a speech that: “…$500 billion of purchases would provide about as much stimulus as a reduction in the federal funds rate of between half a point and three quarters of a point (50 to 75 basis points). “So, at $85 billion a month, the Fed is doing the equivalent of cutting the Fed funds rate (which has been near zero since late 2008) by 10 basis points per month. Even if the FOMC were to decide to taper purchases to $40 – $45 billion per month, it would still be “cutting” the Fed funds rate by around 5 basis points per month.

Fed_QE_Purchases

Will the Fed Act to Calm Financial Markets, Especially the Bond Market?

Since Ben Bernanke’s testimony to the Joint Economic Committee(JEC) of Congress on May 22, 2013, volatility has moved higher in financial markets. Bernanke’s appearance at the JEC, and especially the question and answer portion of the testimony suggested to the market that the FOMC was preparing to begin scaling back its purchases of Treasuries and mortgage backed securities (MBS). Prior to the testimony, markets generally thought that the FOMC would purchase $85 billion per month of Treasuries and MBS through at least the end of 2013. Since the JEC testimony, markets have begun to question that timing and are now expecting the Fed to begin tapering its purchases in September 2013. In our view, the decision for the Fed to continue with the current pace of QE is data dependent. Based on our forecast for the labor market, inflation, and the economy, the Fed is likely to continue its bond purchases through at least September 2013. At that time, the Fed may “test” run a temporary tapering with markets….

When Will the Fed Stop QE?

Even if the Fed does signal that it is prepared to begin tapering its purchases of Treasuries and MBS, it will, in our view, likely continue to pursue QE for some time, and perhaps until the end of 2014. While the Fed has provided “thresholds” for when it would consider raising its Fed funds rate: “… (low rates) will be appropriate at least as long as the unemployment rate remains above 6-1/2 percent, inflation between one and two years ahead is projected to be no more than a half percentage point above the Committee’s 2 percent longer-run goal, and longer-term inflation expectations continue to be well anchored.” it has stopped short of providing specific thresholds for ending QE. Instead, the Fed has said: “The Committee will continue its purchases of Treasury and agency mortgage-backed securities, and employ its other policy tools as appropriate, until the outlook for the labor market has improved substantially in a context of price stability.”

Fig_1_6-18-2013

Can Congress Make the Fed Stop Quantitative Easing?

Yes. Congress, can, at any time, vote to take away or restrict the Fed’s dual mandate to: “…maintain long run growth of the monetary and credit aggregates commensurate with the economy’s long run potential to increase production, so as to promote effectively the goals of maximum employment, stable prices and moderate long-term interest rates.” There are many voices in Congress — especially in the House — that are unhappy with the Fed’s pursuit of QE, and legislation has been introduced in both houses of Congress over the past several years that would limit the Fed’s mandate. It is highly unlikely that such legislation would pass the Senate in the current session of Congress.

What Is the Fed’s Number on the Labor Market?

The QE debate among market participants — and likely among Fed policymakers as well — centers around the labor market and whether or not it has seen “real and sustainable” improvement. Over the past year, the U.S. economy has consistently created around 175,000 net new jobs per month. Some Fed policymakers have hinted that 150,000 jobs per month is the best the economy can do, and any job growth stronger than that could trigger inflation. Other Fed policymakers have suggested that 200,000 jobs per month is the right number to target, and that the Fed still has some work to do to get there. For some, 175,000 net new jobs per month could be the right number. Markets have their own view of what the “right number” is too. However, market participants looking for the FOMC to provide a specific target on job creation may be disappointed this week.

Labor

How Has the Labor Market Performed Since the Last FOMC Meeting in May 2013?

The FOMC has seen two jobs reports since the last FOMC meeting on May 1, 2013. The May 1, 2013 FOMC meeting was held a few days before the release of the April 2013 employment report. The May 2013 employment report was released on June 7, 2013. The April 2013 employment report showed that the economy created 165,000 jobs in April — far more than the 140,000 expected. The May 2013 employment report revealed that the economy added 175,000 jobs in May, in line with expectations and that the job counts over the prior two months were revised downward by a total of 12,000. The unemployment rate was 7.5% in April 2013 and 7.6% in May 2013. Several other labor market metrics the Fed is known to be watching (see our Weekly Economic Commentary: Watch What the Fed Watches, March 25, 2013, for more details)have been mixed at best since the last FOMC meeting. In our view, the labor market is improving, but the recent pace of job creation (around 175,000 per month) seems likely to persist until the economy can grow more robustly than 2.0% to 2.5%.

Fig_2_6-18-2013

Isn’t the FOMC Worried About Inflation Anymore?

As has been the case since Congress amended the Federal Reserve Act to grant the Fed’s dual mandate (see above), the FOMC’s job has been to promote full employment and stable prices. In recent years, the FOMC has been much more concerned with deflation — a prolonged period of falling wages and prices — than it has been about inflation. Recent readings on the Fed’s preferred measure of inflation, the personal consumption deflator excluding food and energy (core PCE deflator), have been decelerating. In March 2012, the year-over-year reading on the Fed’s preferred measure of inflation was 2.0%. The latest reading (April 2013) shows that core inflation is now at 1.0%, which matches the lowest reading ever in the 53+ year history of the data series. In our view, there are still more factors pushing down on inflation than pushing up on inflation (see the Weekly Economic Commentary from March 18, 2013 for more details) and the Fed’s primary focus right now is on the other side of its dual mandate.

____________________________________________________________________________________________________________________________________

IMPORTANT DISCLOSURES
The opinions voiced in this material are for general information only and are not intended to provide specific advice or recommendations for any individual. To determine which investment(s) may be appropriate for you, consult your financial advisor prior t0 investing. All performance reference is historical and is no guarantee of future results. All indices are unmanaged and cannot be invested into directly.

The economic forecasts set forth in the presentation may not develop as predicted and there can be no guarantee that strategies promoted will be successful.

Gross domestic product (GDP) is the monetary value of all the finished goods and services produced within a country’s borders in a specific time period, though GDP is usually calculated on an annual basis. It includes all of private and public consumption, government outlays, investments and exports less imports that occur within a defined territory.

Government bonds and Treasury Bills are guaranteed by the U.S. government as to the timely payment of principal and interest and, if held to maturity, offer a fixed rate of return and fixed principal value. However, the value of fund shares is not guaranteed and will fluctuate.

Mortgage-Backed Securities are subject to credit, default risk, prepayment risk that acts much like call risk when you get your principal back sooner than the stated maturity, extension risk, the opposite of prepayment risk, and interest rate risk.

Stock investing involves risk including loss of principal.

Federal Funds Rate is the interest rate at which depository institutions actively trade balances held at the Federal Reserve, called federal funds, with each other, usually overnight, on an uncollateralized basis.

The Federal Open Market Committee (FOMC), a committee within the Federal Reserve System, is charged under the United States law with overseeing the nation’s open market operations (i.e., the Fed’s buying and selling of United States Treasure securities).

Quantitative easing (QE) is a government monetary policy occasionally used to increase the money supply by buying government securities or other securities from the market. Quantitative easing increases the money supply by flooding financial institutions with capital in an effort to promote increased lending and liquidity.

___________________________________________________________________________________________________________________________________

INDEX DESCRIPTIONS

The “core” PCE price index is defined as personal consumption expenditures (PCE) prices excluding food and energy prices. The core PCE price index measures the prices paid by consumers for goods and services without the volatility caused by movements in food and energy prices to reveal underlying inflation trends.

Purchasing Managers’ Index (PMI) is an indicator of the economic health of the manufacturing sector. The PMI index is based on five major indicators: new orders, inventory levels, production, supplier deliveries and the employment environment.

________________________________________________________________________________________________________________________________

This research material has been prepared by LPL Financial. To the extent you are receiving investment advice from a separately registered independent investment advisor, please note that LPL Financial is not an affiliate of and makes no representation with respect to such entity.

Not FDIC/NCUA Insured | Not Bank/Credit Union Guaranteed | May Lose Value | Not Guaranteed by any Government Agency | Not a Bank/Credit Union Deposit

Member FINRA/SIPC

Tapering Tantrum Take Two
May 28, 2013

The bond market suffered through another week of tapering tantrums with yields closing higher for a fourth consecutive week and near the highs of 2013. Federal Reserve (Fed) Chairman Ben Bernanke did little to clear the uncertainty over the timing of reducing, or tapering, bond purchases in Congressional testimony last week. Although his prepared testimony was very dovish and suggested a continuation of current bond purchases, investors focused on responses in the question and answer portion of his testimony, which fueled additional uncertainty. Bernanke suggested that tapering could begin “in the next few meetings” if labor market data continued to improve, and when asked whether the Fed may taper purchases before Labor Day, Bernanke said he did not know and that it depended on the economic data. Bernanke’s comments echoed those of the normally dovish Bill Dudley, the influential New York Fed President, who also seemed to acknowledge there is ongoing debate among Fed members about when to taper bond purchases.

The response from financial markets, as is typically the case when investors are presented with uncertainty, was lower prices and bonds, across the board, were not spared. Treasury yields continued their ascent, with the 10-year Treasury breaching the 2% yield barrier before closing the week at 2.01%, just below the 2.06% peak of 2013.

The response from financial markets, as is typically the case when investors are presented with uncertainty, was lower prices and bonds, across the board, were not spared. Treasury yields continued their ascent, with the 10-year Treasury breaching the 2% yield barrier before closing the week at 2.01%, just below the 2.06% peak of 2013.

Unlike prior rounds of bond purchases, such as QE1 and QE2, which were marked by specific end dates, QE3 is open-ended and allows for a reduction in the pace of purchases. This presents a new twist for the bond market, and pushing yields higher appeared to be a precautionary move by investors. However, the bond market is adapting quickly. Primary dealers, financial firms that are required to make markets in all Treasury securities, began to move their forecasts for timing QE tapering to the September 2013 Fed meeting, up from a prior consensus of the December 2013 Fed meeting.

A press conference follows the September 2013 Fed meeting and would allow the Fed Chairman to explain the rationale for tapering purchases. A press conference also follows the June 2013 Fed meeting, but it appears unlikely the Fed will move that soon, given the benign remarks in Bernanke’s testimony and the relatively dovish tone of meeting minutes from the May 1, 2013 Fed meeting. Should the Fed announce that tapering will begin at the end of June or in July, bond prices may decline further, and yields may rise more since the bond market has not fully priced in that outcome.

Uncertainty is likely to linger for at least another week and may exert additional upward pressure on bond yields. The current week is very light on economic data, and there are few Fed speakers of note. Investors will likely have to wait until the May 2013 employment report, which will be released on Friday, June 7, 2013, to receive additional clarity. The Fed is clearly focused on labor market gains regarding when to begin tapering bond purchases.

The past week’s events suggest the Fed appears to be focusing more on labor market improvements rather than the lower inflation witnessed so far in 2013, as measured by both the core Consumer Price Index (CPI) and core Consumer Personal Expenditures Index, which may decelerate to a record 1.0% when personal income data for April are released Friday, May 31, 2013, according to the Bloomberg consensus forecast.

We do not expect the Fed to announce a tapering of bond purchases at the June 2013 Fed meeting and therefore expect any additional rise in rates to be limited. Still-high long-term valuations suggest that Treasury weakness could continue. The sooner the Fed begins to reduce bond purchases and the more quickly bond purchases come to an ultimate end, the more rapid the potential rise in bond yields. Nonetheless, we expect the Fed to take a gradualist approach. The following factors also suggest that any rise in rates may also be limited.

  • A change in the relationship between economic data and bond yields. Recent economic data have frequently failed to meet consensus forecasts, as reflected by the Citigroup Economic Surprise Index [Figure 1]. The strength of the economy can be an important driver of bond yields. Note the close relationship between Treasury yields and whether economic data is surprising higher or lower over the years. A gap developed between the two series starting in 2011, due to the Fed’s extraordinary measures (e.g., its commitment to refrain from raising interest rates for a specified period of time), but directionally the pace of economic data is still evident as a driver of Treasury yields. Recently, the relationship between Treasury yields and economic data changed as bond investors have focused on tapering. We do not believe this change will last long and the bond market will refocus on economic data, which in our view is still too sluggish to reflect sharply lower bond prices and higher yields.

Figure_1

  • The Fed remains on hold. Fed interest rate hikes, or cuts, have been one of the key drivers of bond yields. Without an actual rate hike, the increase to short and intermediate yields in particular may be limited.
  • A tapering does not mean an end to easing. Even in the event of a tapering, the Fed will still be providing stimulus, and downward pressure on interest rates, by continuing bond purchases even if at a reduced rate.
  • Prior QE conclusions resulted in lower Treasury yields. Bond yields actually declined following the end of prior QE bond purchases [Figure 2]. Investors feared an economic slowdown absent the Fed’s stimulus, and stocks and high-yield bond prices declined while Treasury prices gained.

Figure_2

Should the rise in bond yields continue without corroboration by weaker economic data or additional clues that the Fed may reduce bond purchases as early as June 2013, a buying opportunity may emerge among high-quality bonds. In the meantime, the cautionary bond market tone may persist over the short term.

___________________________________________________________________________________________________________________________________________

IMPORTANT DISCLOSURES
The opinions voiced in this material are for general information only and are not intended to provide specific advice or recommendations for any individual. To determine which investment(s) may be appropriate for you, consult your financial advisor prior to investing. All performance referenced is historical and is no guarantee of future results. All indexes are unmanaged and cannot be invested into directly.

The economic forecasts set forth in the presentation may not develop as predicted and there can be no guarantee that strategies promoted will be successful.

Yield is the income return on an investment. This refers to the interest or dividends received from a security and is usually expressed annually as a percentage based on the investment’s cost, its current market value or its face value.

Bonds are subject to market and interest rate risk if sold prior to maturity. Bond values and yields will decline as interest rates rise, and bonds are subject to availability and change in price.

Bonds given an investment grade rating indicate a relatively low risk of default.

High-yield/junk bonds are not investment-grade securities, involve substantial risks, and generally should be part of the diversified portfolio of sophisticated investors.

Government bonds and Treasury bills are guaranteed by the U.S. government as to the timely payment of principal and interest and, if held to maturity, offer a fixed rate of return and fixed principal value. However, the value of fund shares is not guaranteed and will fluctuate.

Intermediate bonds are characterized by a maturity that is set to occur in the next three to 10 years.

Treasuries are marketable, fixed-interest U.S. government debt securities. Treasury bonds make interest payments semi-annually, and the income that holders receive is only taxed at the federal level.

Quantitative easing is a government monetary policy occasionally used to increase the money supply by buying government securities or other securities from the market. Quantitative easing increases the money supply by flooding financial institutions with capital in an effort to promote increased lending and liquidity.

This information is not intended to be a substitute for specific individualized tax, legal or investment planning advice. We suggest that you discuss your specific tax issues with a qualified tax advisor.

_____________________________________________________________________________________________________________________________________________

INDEX DESCRIPTIONS
Personal Consumption Expenditures is the measure of price changes in consumer goods and services. Personal consumption expenditures consist of the actual and imputed expenditures of households; the measure includes data pertaining to durables, non-durables and services. It is essentially a measure of goods and services targeted toward individuals and consumed by individuals.

Citigroup Economic Surprise Index (CESI) measures the variation in the gap between the expectations and the real economic data. This research material has been prepared by LPL Financial.

The Consumer Price Index (CPI) is a measure of the average change over time in the prices paid by urban consumers for a market basket of consumer goods and services.

______________________________________________________________________________________________________________________________________________

This research material has been prepared by LPL Financial.

To the extent you are receiving investment advice from a separately registered independent investment advisor, please note that LPL Financial is
not an affiliate of and makes no representation with respect to such entity.

Not FDIC/NCUA Insured | Not Bank/Credit Union Guaranteed | May Lose Value | Not Guaranteed by any Government Agency | Not a Bank/Credit Union Deposit

Listening to the leaders
May 14, 2013

Leading Indicators Continue to Point to Slow Economic Growth, but no Recession

The April Index of Leading Economic Indicators (LEI), due out on Friday, May 17, 2013, caps off a busy week for economic reports in the United States. This week includes reports on:

  • The consumer: Retail sales for April 2013 and the University of MichiganIndex of Consumer Sentiment for early May 2013;
  • Housing: Housing starts and building permits for April 2013 and the National Association of Homebuilders sentiment index for May 2013;
  • Manufacturing: Empire State Manufacturing Index for May, the Philadelphia Fed Manufacturing Index for May 2013, industrial production and capacity utilization for April 2013; and
  • Inflation: Consumer Price Index (CPI) and Producer Price Index (PPI) for April 2013.

On balance, these reports are likely to continue to show that the U.S. economy is growing at around 2.0% in the second quarter of 2013, that inflation remains muted, and that the odds of a recession in the next year to 18 months remains low. Policymakers at the Federal Reserve (Fed) will digest all of this data, and likely conclude that its quantitative easing (QE) program — the purchase of $85 billion per month of Treasury securities — should continue over the remainder of 2013.

1-We_Continue_to_Expect_the_Facts

LEI Updates

If you have not seen the LEI lately, there have been several changes made to its components, although as before, virtually all of the components of the LEI are known before the data are actually released. So in theory, the LEI itself should not be a surprise to market participants, the media, or pundits. Of course, that will not prevent anyone from ascribing movements in financial markets on Friday, May 17 to the LEI data, but we are always quick to point out that the S&P 500 itself is a component in the LEI.

In December 2011, the Conference Board, the private “think tank” that compiles and releases the data each month, made four changes to the LEI:

  • The Conference Board’s proprietary “Leading Credit Index” (LCI), an aggregate of several well-known financial market and credit market metrics like swap spreads, investor sentiment, margin account, etc., replaced the inflation adjusted M2 money supply.
  • The Institute for Supply Management’s (ISM) New Orders Index replaced the ISM’s Supplier Deliveries Index.
  • The U.S. Department of Census’ new orders for non-defense capital goods excluding aircraft replaced new orders for non-defense capital goods.
  • A combination of consumer expectations and business and economic conditions replace the University of Michigan’s Consumer Expectations Index.

LEI Places Very Low Odds of Recession in Next 12 Months

According to the consensus estimates compiled by Bloomberg News, the LEI is expected to post a 0.2% month-over-month gain in April 2013. The expected 0.2% month-over-month gain would put the year-over-year gain in the LEI at 2.1%. The LEI is designed to predict the future path of the economy, with a lead time of between six and 12 months. Since 1960 — 640 months or 53 years and four months — the year-over-year increase in the LEI has been at least 2.1% in 397 months. Not surprisingly, the U.S. economy was not in recession in any of those 397 months. Thus, it is highly unlikely that the economy was in recession in April 2013, despite the impact of the sequester, the fiscal cliff (spending cuts, payroll tax increases, income tax rate increases, etc.), the recession in Europe, or the slowdown in China.

But the LEI is designed to tell market participants what is likely to happen to the U.S. economy, not what has already happened. Three months after each of the 397 months that the LEI was up 2.1% or more, the economy was in recession in just two of the 397 months — both in 1973. Six months after the LEI was up by 2.1% or more on a year-over-year basis, the U.S. economy has been in recession in just six of the 397 months or 2% of the time. Looking out 12 months after the LEI was up 2.1% or more, the economy was in recession in just 27 of the 397 months, or 7% of the time. Based on this relationship, the odds of a recession within the next 18 months and two years increase to between 10% and 15%.

2_-_LEI_Suggests_a_Low_Probability_of_Recession

LPL_Financial_Research_Weekly_Calendar

On balance, the LEI says the risk of recession in the next 12 months is negligible (7%), but not zero. We would agree. But, the still-fragile state of the economy, and the uncertainty surrounding domestic fiscal policy, the recession in Europe, and the ongoing slowdown in China are telling us that the risk of recession is much higher than 7%. Our view remains that — aided by the Fed’s QE program, the early stages of a housing recovery, and a nascent manufacturing recovery — the U.S. economy is likely to grow at around 2.0% this year. The full impact of the sequester, the looming debate over the federal debt ceiling, weak exports, and ongoing contraction in both federal and state and local government spending are all acting to restrain growth, and these factors are likely to be in place for most of this year. A dramatic deterioration of the fiscal and financial situation in Europe, a fiscal or monetary policy mistake here in the United States or abroad, or an exogenous event (a major terror attack, natural disaster, etc.), among other events, may cause us to change our view.

______________________________________________________________________________________________________________________________________________

IMPORTANT DISCLOSURES
The opinions voiced in this material are for general information only and are not intended to provide specific advice or recommendations for any individual. To determine which investment(s) may be appropriate for you, consult your financial advisor prior to investing. All performance reference is historical and is no guarantee of future results. All indices are unmanaged and cannot be invested into directly.

* Over the last three quarters (third quarter of 2012, fourth quarter of 2012, and first quarter of 2013) , real GDP growth has averaged 2.0%.

Gross domestic product (GDP) is the monetary value of all the finished goods and services produced within a country’s borders in a specific time period, though GDP is usually calculated on an annual basis. It includes all of private and public consumption, government outlays, investments and exports less imports that occur within a defined territory.

The economic forecasts set forth in the presentation may not develop as predicted and there can be no guarantee that strategies promoted will be successful.

Stock investing involves risk including loss of principal.

Quantitative easing is a government monetary policy occasionally used to increase the money supply by buying government securities or other securities from the market. Quantitative easing increases the money supply by flooding financial institutions with capital in an effort to promote increased lending and liquidity.

The Federal Open Market Committee (FOMC) , a committee within the Federal Reserve System, is charged under the United States law with overseeing the nation’s open market operations (i.e., the Fed’s buying and selling of U.S. Treasury securities).

The Congressional Budget Office is a non-partisan arm of Congress, established in 1974, to provide Congress with non-partisan scoring of budget proposals.

______________________________________________________________________________________________________________________________________________

INDEX DESCRIPTIONS
The Consumer Price Index (CPI) is a measure of the average change over time in the prices paid by urban consumers for a market basket of consumer goods and services.

The Empire State Manufacturing Index is a seasonally-adjusted index that tracks the results of the Empire State Manufacturing Survey. The survey is distributed to roughly 175 manufacturing executives and asks questions intended to gauge both the current sentiment of the executives and their six-month outlook on the sector.

The Institute for Supply Management (ISM) index is based on surveys of more than 300 manufacturing firms by the Institute of Supply Management. The ISM Manufacturing Index monitors employment, production inventories, new orders, and supplier deliveries. A composite diffusion index is created that monitors conditions in national manufacturing based on the data from these surveys.

The index of leading economic indicators (LEI) is an economic variable, such as private-sector wages, that tends to show the direction of future economic activity.

The Leading Credit Index constitutes financial market indicators including bond market yield curve data, interest rate swaps, and Fed bank lending survey data.

The NAHB/Wells Fargo Housing Market Index gauges builder perceptions of current single-family home sales and sales expectations for the next six months as “good,” “fair” or “poor.” The survey also asks builders to rate traffic of prospective buyers as “high to very high,” “average,” or “low to very low.” Scores from each component are then used to calculate a seasonally adjusted index where any number over 50 indicates that more builders view conditions as good than poor.

The Philadelphia Fed Manufacturing Index is a survey produced by the Federal Reserve Bank of Philadelphia, which questions manufacturers on general business conditions. The index covers the Philadelphia, New Jersey, and Delaware region. Higher survey figures suggest higher production, which contribute to economic growth. Results are calculated as the difference between percentage scores with zero acting as the centerline point. As such, values greater than zero indicate growth, while values less than zero indicate contraction.

The Producer Price Index (PPI) program measures the average change over time in the selling prices received by domestic producers for their output. The prices included in the PPI are from the first commercial transaction for many products and some services.

Purchasing Managers’ Index (PMI) is an indicator of the economic health of the manufacturing sector. The PMI index is based on five major indicators: new orders, inventory levels, production, supplier deliveries, and the employment environment.

The University of Michigan Consumer Sentiment Index (MCSI) is a survey of consumer confidence conducted by the University of Michigan. The Michigan Consumer Sentiment Index (MCSI) uses telephone surveys to gather information on consumer expectations regarding the overall economy.

______________________________________________________________________________________________________________________________________________

This research material has been prepared by LPL Financial.
To the extent you are receiving investment advice from a separately registered independent investment advisor, please note that LPL Financial is
not an affiliate of and makes no representation with respect to such entity.

Not FDIC/NCUA Insured | Not Bank/Credit Union Guaranteed | May Lose Value | Not Guaranteed by any Government Agency | Not a Bank/Credit Union Deposit

Clearing up confusion on common queries
May 7, 2013

In this week’s commentary we attempt to clear up some of the confusion around some of the most common questions we encounter regularly, including:

  • The Federal Reserve (Fed), its balance sheet, its role in the economy,and its impact on inflation;
  • The federal budget deficit;
  • The federal debt outstanding, and the debt-to-GDP ratio; and
  • The trade deficit and a related topic, the US dollar.

In many ways, the items above are related. But oftentimes, pundits, politicians, newsletter writers, bloggers, Tweeters, and even the “traditional media” will confuse or conflate one or more of these issues, and that’s usually when we get a call about it in the LPL Financial Research Department.

The Federal Reserve

The Federal Reserve (Fed) was created in 1913 by an act of Congress, The Federal Reserve Act, to provide “the nation with a safer, more flexible, and more stable monetary and financial system.” The Fed was created after a series of financial panics, bank runs, credit crunches, and booms and busts in the late 1800s and early 1900s. Over time, the Fed’s role in the economy has expanded, and currently, the Fed has a “dual mandate” from Congress (via the Full Employment and Balanced Growth Act of 1978) to conduct monetary policy that aims to promote “full employment and reasonable price stability.” In plain English, Congress created the Fed to run monetary policy, and could, at any time, vote to take away or modify the Fed’s dual mandate. In fact, Congress could run monetary policy themselves if they voted to do so, although it would be an understatement to say that markets would not embrace that outcome were it occur.

As part of its mandate from Congress, the Fed’s policymaking arm, the Federal Open Market Committee (FOMC) can raise or lower the interest rate banks charge each other for overnight loans, and expand and contract its balance sheet (quantitative easing, or QE) to achieve its goals. Since 2008, the Fed has pursued several rounds of QE — the purchase of Treasury and mortgage-backed securities (MBS) in the marketplace — by creating “reserve credits.” The Fed’s balance sheet currently stands at just over $3 trillion, and it is likely to continue to grow over the remainder of 2013 and perhaps beyond.

1_The_Fed's_balance_Sheet

The Fed’s balance sheet does not add to the federal deficit (see below), nor does the Fed set interest rates in the marketplace — beyond interest rates on overnight lending. Interest rates on everything from 3-month T-bills to 30-year Treasury bonds are set by the market, not the Fed. While the Fed is not responsible for fiscal policy or the budget deficit (see below), an argument has been made that the Fed is encouraging fiscal policymakers to overspend by buying the debt issued by the Treasury to fund the spending. In all likelihood however, Congress would be spending more than it takes in, and the Treasury would be issuing the debt to fund this overspending anyway. The difference is that instead of the Fed buying the Treasuries, other entities (the U.S. public, bond funds, pension funds, insurance companies, foreign entities, etc.) would be buying the debt, albeit at a slightly higher yield, and a slightly higher cost to the Treasury.

Our view remains that the Fed will continue its program of QE over the remainder of 2013, and keep rates at or near zero until at least 2015.

The risk of inflation from the Fed’s policies would arise if all the money the Fed is pumping into the system (mainly onto commercial banks’ balance sheets) would be lent out all at once by those banks to businesses and consumers across the country and around the world. While there has been some lending, lending activity has not been robust, and indeed the velocity of money — the rate at which money sloshes around in the economy — has fallen by a third since the onset of the financial crisis in 2007 – 08, and shows no signs of reversing. (Please see the Weekly Economic Commentary:  (Inflation Situation Revisited from March 18, 2013 for more on our view on inflation).

In short, the Fed runs monetary policy and is given that mandate by Congress. Our view remains that the Fed will continue its program of QE over the remainder of 2013, and will keep rates at or near zero until at least 2015.

Federal Budget Deficit

The federal budget deficit is the difference between what the Treasury collects in taxes (personal income taxes, payroll taxes, excise taxes, corporate taxes) and fees, less what the federal government spends (on defense, social programs, roads, education, etc.). Deficits increase when the federal government, authorized by Congress, spends more than it takes in, and deficits decrease when the federal government takes in more revenue than it spends in a year. A large percentage of federal spending is set on autopilot via mandatory spending on programs like Social Security, Medicare, and Medicaid (see the Weekly Economic Commentary from October 29, 2012), although smaller portions of the budget (interest payments on the federal debt and spending on non-mandatory items) are determined by Congress annually.

2_The_Federal_Budget_Deficit

Fiscal Policy

Fiscal policy (decisions on how the government should raise revenue and/or manage spending) is made by Congress, with the President having veto power over what Congress decides. The federal budget deficit (in dollar terms and as a percent of gross domestic product [GDP]), is headed lower, at least over the medium term, helped by tax increases, the sequester spending cuts, the fading impact of the $787 billion American Recovery and Reinvestment Act (ARRA) of 2009, and the improving economy, leading to higher revenues and lower spending for items such as unemployment insurance. While this improvement in the overall budget picture is welcome, and somewhat of a surprise to many, it may lead to complacency, and prevent the policymakers responsible for fiscal policy from taking the needed actions to begin to address our longer-term budget problems. While the Fed has no role in setting fiscal policy, the Fed’s own policies do impact the deficit. The Fed’s operations historically earn a profit, as the revenue it takes in via open market operations as well as by check and electronic payments processing for the financial system, far exceed its operating costs. The Fed promptly returns all profits back to the Treasury. In 2012, the Fed paid $88 billion into the Treasury, and it has consistently returned profits to the Treasury since the mid-1930s. The Fed’s monetary policy can also impact what the federal government pays in interest on the public debt. By keeping short-term rates low, the Fed is helping to keep interest payments owed by the federal government low. By keeping a lid on inflation, the Fed has a hand in keeping intermediate- and long-term interest rates low, which in turn helps to keep the interest paid by the federal government on intermediate- and longer-dated Treasuries low.

LPL_Financial_Research_Weekly_Calendar

Federal Debt

The federal debt is simply the federal deficit accumulated over the years. When the deficit increases in a given year because the federal government spends more than it takes in, the debt increases. There are several measures of federal debt, the broadest being total public debt outstanding, which was $16.8 trillion at the end of March 2013. Of that, $11.9 trillion was marketable and held by the public (and half of that is held by foreigners), while $4.9 trillion is owned by entities within the federal government. The debt-to-GDP ratio is calculated by dividing the debt (total, held by public, etc.) by nominal GDP (See the Weekly Economic Commentary: The ABCs of GDP from May 6, 2013), which stands at $16 trillion. So the United States’ debt-to-GDP ratio measured by total debt outstanding ($16.8 trillion) divided by nominal GDP ($16 trillion) is 105%. However, most market participants exclude the federal debt owed to other federal government entities and calculate the debt-to-GDP ratio as debt owned by the public ($11.9 trillion) divided by nominal GDP ($16.0) trillion for a debt-to-GDP ratio of just over 74%. The nonpartisan Congressional Budget Office projects that public debt outstanding as a percent of GDP (currently at 74% of GDP) will rise gradually to 77% of GDP by 2023, assuming current law and trend-like 2.8% real GDP growth over the next 10 years.

The structural and demographic problems that will drive the deficit over the next several decades remain in place, and the longer policymakers wait to address the problems, the more difficult (and painful) it becomes to address the problems later on.

3_The_Nonpartisan_CBO

The real problem posed by the federal debt, however, is the structural deficits in the Social Security, Medicare, and Medicaid programs, which won’t be helped much by an improving economy. The biggest risk on the federal debt is that the recent improvement in the deficit (and relative stability in the debt-to-GDP ratio) allows complacency to set in among policymakers in Washington. The structural and demographic problems that will drive the deficit over the next several decades remain in place, and the longer policymakers wait to address the problems, the more difficult (and painful) it becomes to address the problems later on.

Trade Deficit

The difference between what we export in goods and services to other countries, and what we import in goods and services from other countries is our trade deficit. Many factors influence the trade deficit, including, but not limited to:

  • The value of the dollar;
  • The relative strength of our economy to economies outside the United States;
  • The quality of goods and services made here relative to the quality of the goods and services created overseas; and
  • Trade barriers and tariffs.

The United States is still likely to run a substantial trade deficit in the years ahead, and the trade sector will continue to weigh on overall GDP growth and the value of the dollar.

We currently run a very large deficit on goods (importing $2.3 trillion and exporting just $1.6 trillion over the past 12 months), but we run a small net trade surplus (importing $435 billion and exporting $636 billion) on the service side. Congress and the President can impact trade directly (via trade agreements, tariffs) and indirectly (via enacting industry and product-specific tax and regulatory measures). A nation’s fiscal policy can have an influence on the trade deficit as well, if the fiscal policy impacts economic growth, the value of the dollar, etc. The Fed’s main impact on the trade deficit is via interest rates and the dollar. Typically, if the Fed is cutting interest rates or maintaining “easy” monetary policy, the dollar may decline in response, making our exports less expensive to the rest of the world. The nascent revival of the U.S. manufacturing sector along with the now ample supply of natural gas and related products will help to hold the trade deficit in check by reducing our dependence on foreign manufactured goods and imported energy and energy products. Despite these positives however, the United States is still likely to run a substantial trade deficit in the years ahead, and the trade sector will continue to weigh on overall GDP growth and the value of the dollar.

The Dollar

Aside from two periods in the early 1980s and late 1990s, the US dollar has been declining since it went off the gold standard in the early 1970s. The value of the dollar is set in the open market, although the Fed, Congress, and the President can have an impact on the dollar. Of the three, the Fed probably has the most direct impact on the value of the dollar, as it sets short-term interest rates, which often have a big influence on the value of a nation’s currency. The Fed’s current program of QE is increasing the number of dollars in the world, and helping to put downward pressure on the dollar. Trade policy, broad economic policy, and even foreign policy — set by Congress and/or the President — can also impact the value of the dollar. Our “twin deficits” (trade and budget) have put downward pressure on the dollar over the past several decades, and will continue to do so for the foreseeable future.

4_Aside_from_the_early_1980's

Since the United States is the world’s largest economy, most global trade is denominated in dollars, making the dollar the world’s “reserve currency.” Central banks and governments of most nations outside the United States hold reserves in dollars, although the rise of China’s economy and the sheer size of the Eurozone’s economy has eroded the dollar’s “reserve currency” status in recent years. Still, the dollar is still viewed as a “safe haven,” and in times of economic and political uncertainty around the globe, the dollar normally rises in value.

5_-_Our__Twin_Deficit_

While our “twin deficits” and the Fed’s actions to stimulate the economy are putting downward pressure on the dollar, the dollar’s status as the world’s reserve currency, and the United States’ position as the world’s largest economy and the world’s largest exporter with a diversified and dynamic economy and labor force, suggests that a sudden, sharp decline in the value of the dollar is unlikely. We continue to believe the dollar will slowly depreciate over time — continuing the trend that has been in place since the early 1970s.

_____________________________________________________________________________________________________________________________________________

IMPORTANT DISCLOSURES
The opinions voiced in this material are for general information only and are not intended to provide specific advice or recommendations for any individual. To determine which investment(s) may be appropriate for you, consult your financial advisor prior to investing. All performance reference is historical and is no guarantee of future results. All indices are unmanaged and cannot be invested into directly. Gross domestic product (GDP) is the monetary value of all the finished goods and services produced within
a country’s borders in a specific time period, though GDP is usually calculated on an annual basis. It includes all of private and public consumption, government outlays, investments and exports less imports that occur within a defined territory.

The economic forecasts set forth in the presentation may not develop as predicted and there can be no guarantee that strategies promoted will be successful.

Stock investing involves risk including loss of principal.

Quantitative easing is a government monetary policy occasionally used to increase the money supply by buying government securities or other securities from the market. Quantitative easing increases the money supply by flooding financial institutions with capital in an effort to promote increased lending and liquidity.

The Federal Open Market Committee (FOMC) , a committee within the Federal Reserve System, is charged under the United States law with overseeing the nation’s open market operations (i.e., the Fed’s buying and selling of U.S. Treasury securities).

The Congressional Budget Office is a non-partisan arm of Congress, established in 1974, to provide Congress with non-partisan scoring of budget proposals.

Government bonds and Treasury Bills are guaranteed by the U.S. government as to the timely payment of principal and interest and, if held to maturity, offer a fixed rate of return and fixed principal value. However, the value of fund shares is not guaranteed and will fluctuate.

Mortgage-Backed Securities are subject to credit, default risk, prepayment risk that acts much like call risk when you get your principal back sooner than the stated maturity, extension risk, the opposite of prepayment risk, and interest rate risk.

____________________________________________________________________________________________________________________________________________

INDEX DESCRIPTIONS
The Consumer Price Index (CPI) is a measure of the average change over time in the prices paid by urban consumers for a market basket of consumer goods and services.

Purchasing Managers’ Index (PMI) is an indicator of the economic health of the manufacturing sector. The PMI index is based on five major indicators: new orders, inventory levels, production, supplier deliveries and the employment environment.

____________________________________________________________________________________________________________________________________________

This research material has been prepared by LPL Financial.
To the extent you are receiving investment advice from a separately registered independent investment advisor, please note that LPL Financial is
not an affiliate of and makes no representation with respect to such entity.

Not FDIC/NCUA Insured | Not Bank/Credit Union Guaranteed | May Lose Value | Not Guaranteed by any Government Agency | Not a Bank/Credit Union Deposit