Archive for the ‘Superstorm Sandy’ Category

The Rest of 2013
November 19, 2013

The LPL Financial Research Outlook 2014 comes out next week, so this week is a great opportunity to take a shorter-term look at the rest of 2013. It has been an amazing year for stock market investors with the strongest gain in a decade and a record for the annual outperformance of stocks over bonds, measured by the S&P 500 Index and the Barclays Aggregate Bond Index since its inception in 1976. But it may get even better. After all, November marks the turn in the calendar to what has been the best six months of the year for equity markets, on average, following the weakest six-month period from May to October, whose start is marked by the adage, “Sell in May and go away.” In fact, the S&P 500 has been up 20% by the start of November seven times since WWII. Every time, the index has always added to those gains — by an average of 6%.

What may drive additional gains? The market will focus on several things:  holiday shopping, seasonal patterns, and the December Federal Reserve (Fed) meeting.

Holiday Shopping

As Black Friday approaches, market participants turn their attention to holiday shopping as a barometer of the health of the economy and as an indicator for potential leadership by the companies in the consumer discretionary sector.

The National Retail Federation projects 2013 holiday sales to rise 3.9% this year, slightly ahead of last year’s 3.5% increase. We believe this expectation for a close-to-average year  holiday sales have increased 3.3%, on average, for the last 10 years) will likely be exceeded for a few reasons:

  • The wealth effect.   History shows that this year’s gain for the S&P 500 suggests a high-single-digit gain for retail sales [Figure 1]. When people feel wealthier, they tend to spend more. Adding to this wealth effect, home prices are up double digits too.
  • More discretionary income.  Gasoline prices are down by about 5 – 10% from last year, and 1.3 million more people have full-time jobs than a year ago, according to the Bureau of Labor Statistics.
  • Fading drags.  We are starting to see a rebound in weekly retail sales from the shutdown-induced stall in October. And the year-over-year comparisons will benefit from the November 2012 impact of Superstorm Sandy.

Figure_1

Seasonal Patterns

End-of-year seasonal patterns are frequently a focus of market participants due to the tendency of fund managers and individuals to tidy up portfolios for tax and other reasons around year end. However, there is not likely to be much tax loss selling this year, given the broad and powerful gains, but we can expect a lot of capital gains distributions from funds that could prompt some volatility.

The “January effect” of outperformance by smaller company stocks has tended to start in mid-December in recent years after they have been dumped for tax loss selling and other reasons.

But what may lead the market higher? Based on the above analysis, it could be the consumer discretionary sector. This sector typically has a pretty consistent pattern of outperformance in November and December. The industrials sector also tends to outperform historically, while financials and energy tend to lag.

Fed Meeting

The Fed meeting on December 17 – 18 may be the biggest event during the rest of 2013, and it will be closely watched by market participants. Although it is a long shot that the Fed will announce tapering its bond-buying program at that meeting, the statement, accompanying economic projections, and press conference will be scrutinized for insights regarding whether tapering will begin in January, March, or beyond.

Bond yields may rise in response to improving economic data ahead of the meeting, continuing the slow-but-steady rise in yield from the 2.5% on the 10-year Treasury seen in late October. However, we are unlikely to see a sharp rise that would have a strong negative impact on the stock market.

A Strong Close

A strong close to a strong year may be in store for stocks. A pass on tapering by the Fed may boost stocks headed into year-end, meaning the S&P 500 finishes the year with a “Santa Claus rally” — the tendency for the stock market to post gains between Christmas and New Year’s Day, a period that has averaged a 1.5% return since WWII.

______________________________________________________________________________________________________________________________

IMPORTANT DISCLOSURES

The opinions voiced in this material are for general information only and are not intended to provide specific advice or recommendations for any individual. To determine which  investment(s) may be appropriate for you, consult your financial advisor prior to investing. All performance reference is historical and is no guarantee of future results. All indices are unmanaged and cannot be invested into directly. Unmanaged index returns do not reflect fees, expenses, or sales charges. Index performance is not indicative of the performance of any investment. Past performance is no guarantee of future results.

The economic forecasts set forth in the presentation may not develop as predicted and there can be no guarantee that strategies promoted will be successful.

Stock and mutual fund investing involves risk including loss of principal.

Bonds are subject to market and interest rate risk if sold prior to maturity. Bond values and yields will decline as interest rates rise and bonds are subject to availability and change in price.

The Consumer Discretionary Sector: Companies that tend to be the most sensitive to economic cycles. Its manufacturing segment includes automotive, household durable goods, textiles and apparel, and leisure equipment. The service segment includes hotels, restaurants and other leisure facilities, media production and services, consumer retailing and services, and education services.

Energy Sector: Companies whose businesses are dominated by either of the following activities: The construction or provision of oil rigs, drilling equipment and other energy-related service and equipment, including seismic data collection. The exploration, production, marketing, refining and/or transportation of oil and gas products, coal and consumable fuels.

Financials Sector: Companies involved in activities such as banking, consumer finance, investment banking and brokerage, asset management, insurance and investment, and real estate, including REITs.

Industrials Sector: Companies whose businesses manufacture and distribute capital goods, including aerospace and defense, construction, engineering and building products, electrical equipment and industrial machinery. Provide commercial services and supplies, including printing, employment, environmental and office services. Provide transportation services, including airlines, couriers, marine, road and rail, and transportation infrastructure.

______________________________________________________________________________________________________________________________

INDEX DESCRIPTIONS

The Standard & Poor’s 500 Index is a capitalization-weighted index of 500 stocks designed to measure performance of the broad domestic economy through changes in the aggregate market value of 500 stocks representing all major industries.

The Barclays Capital U.S. Aggregate Index represents securities that are SEC-registered, taxable, and dollar denominated. The index covers the U.S. investment-grade fixed rate bond market, with index components for government and corporate securities, mortgage pass-through securities, and asset-backed securities.

______________________________________________________________________________________________________________________________

This research material has been prepared by LPL Financial.

To the extent you are receiving investment advice from a separately registered independent investment advisor, please note that LPL Financial is not an affiliate of and makes no representation with respect to such entity.

Not FDIC or NCUA/NCUSIF Insured | No Bank or Credit Union Guarantee | May Lose Value | Not Guaranteed by any Government Agency | Not a Bank/Credit Union Deposit

Member FINRA/SIPC

Trust
September 13, 2013

Trust

The latest Beige Book (released Wednesday, September 4, 2013) and the August employment report (released Friday, September 6, 2013) likely provided Fed policymakers enough “cover” to begin scaling back QE. Figure 1 compares the latest readings on the LPL Financial Beige Book Barometer, as well as key metrics from the employment report, to the readings from September 2012, when the Federal Open Market Committee (FOMC) voted to commence the latest round of QE, dubbed QE3.

2013-09-10_Figure_2A

Data shows that the economy is not booming, the labor market is still struggling, and the Fed’s preferred measure of inflation has decelerated in recent months. All this suggests that although there is not a clear cut economic case for the Fed to begin slowing QE at the September 17 – 18 FOMC meeting, the overall economy (according to the Beige Book) and the labor market have improved modestly in the 12 months since the FOMC voted to embark on QE3.

Instead, comments over the past few months on the unintended consequences of QE from many Fed officials, including Fed Chairman Ben Bernanke, suggest that the FOMC may be questioning the efficacy of continuing to pursue QE. Therefore, they are ready to begin to taper sooner rather than later. In particular, Fed officials have expressed concerns that additional QE could potentially disrupt the smooth functioning of securities markets, cause investors to take on excessive risk and “reach for yield” in certain segments of the fixed income markets, and add to financial instability in the global economy.

Perhaps more importantly, in our view, since Fed Chairman Bernanke’s testimony before the Joint Economic Committee of Congress in May of this year, financial market participants have come to expect that the Fed would begin to taper this month, absent a major downshift in the economy. If the Fed does not follow through on tapering, it risks losing the market’s hard-earned trust; and any trust the markets have in the Fed today will likely come in handy when the Fed has to begin removing stimulus and raising rates in the years ahead.

In our view, the “trust” argument for the Fed to begin tapering QE next week is stronger than either the economic argument, or the “risks” argument; and as a result, the Fed is likely to announce modest tapering of QE next week. The latest consensus of market participants is that the Fed will trim QE by $10 – 15 billion, from $85 billion per month, to $70 – 75 billion per month. At the same time, the Fed is likely to place more emphasis on its promise to keep its key policy rate, the Fed funds rates, lower for longer; and, to rely more on this strengthened rate guidance than on QE as a policy tool in the period ahead.

Beige Book: Window on Main Street

The latest edition of the Federal Reserve’s (Fed) Beige Book, released on September 4, 2013, once again described the economy as increasing at a modest-to-moderate pace, with little wage or inflation pressures. Autos and housing, despite the recent rise in interest rates, were mentioned as key drivers of growth. As noted above, the tone of the latest Beige Book report suggests that the Fed is still on track to begin scaling back QE, but that it remains a long way from tightening monetary policy by raising its fed funds rate target.

In order to provide one snapshot of the entire Beige Book collage of data, we created our proprietary Beige Book Barometer (BBB) [Figure 2]. The barometer ticked down to +70 in September 2013 from +79 in July 2013, and +82 in June 2013. Despite the downtick since April 2013, the BBB remains well above its Superstorm Sandy-related dip to +30 in November 2012. Note that the April 2013 reading (+112) was both a post-Great Recession high and also the highest reading since 2005, suggesting a broadening and deepening of the economic expansion. The move down to +70 from +112 between the April and July 2013 editions of the Beige Books came as the number of positive words dropped and the number of negative words hit a fresh seven-year low in September 2013. The drop in the number of negative words in the Beige Book to a seven-year low can be viewed as reflecting the diminishing pace of headwinds (e.g., fiscal policy, Europe, China, housing, and general economic uncertainty ) that have hampered the U.S. economic
recovery over the past four years.

2013-09-10_Figure_2B

Our BBB, a diffusion index that measures the number of times the word “strong” or its variants (stronger, strength, strengthen, etc.) appear in the Beige Book less the number of times the word “weak” or its variants (weaken, weaker, etc.) appear, is displayed in Figure 2. The barometer is an easy-to-use, quantitative way to measure small shifts in the outlook and capture shades between strong and weak in the predominately qualitative Beige Book report.

Beige Book: How It Works

The Beige Book compiles qualitative observations made by community bankers and business owners about economic (labor market, prices, wages, housing, nonresidential construction, tourism, manufacturing) and banking (loan demand, loan quality, lending conditions) conditions in each of the 12 Fed districts (Boston, New York, Philadelphia, Kansas City, etc.). This local color that makes up each Beige Book is compiled by one of the 12 regional Federal Reserve districts on a rotating basis—the report is much more “Main Street” than “Wall Street” focused. It provides a window into economic activity around the nation using plain, everyday language. The report is prepared eight times a year ahead of each of the eight Federal Open Market Committee (FOMC) meetings. The next FOMC meeting is September 17 – 18, 2013.

The previous word clouds or text clouds, which are a visual format useful for quickly perceiving the most important words in a speech, text, report, or other transcript, are culled from the Fed’s Beige Books published last week (September 4, 2013), the prior report (July 17, 2013) and in August 2012. In general, the more often a word appears in a speech, text, report or other transcript, the larger that word appears in the word cloud. The word clouds show the top 50 words for each of the two Beige Books mentioned above. Similar words are grouped together and common words like “the,” “and,” “a,” and “is” are excluded, as are words that appear frequently in all Beige Books (federal, district, loan, level, activity, sales, conditions, firms, etc.).

How the Barometer Works

The Beige Book Barometer is a diffusion index that measures the number of times the word “strong” or its variations appear in the Beige Book less the number of times the word “weak“ or its variations appear. When the Beige Book Barometer is declining, it suggests that the economy is deteriorating. When the Beige Book Barometer is rising, it suggests that the economy is improving.

2013-09-10_Figure_3A

Word Clouds Show Growing Concern About Impact of Health Care Reform and Rising Rates

The word clouds in Figure 4 are dominated by words describing the tone of the economy when the Beige Books were published. Although not picked up in the nearby word cloud, the most notable trend in the latest Beige Book was the large uptick in the number of mentions of “health care,” “health insurance,” and the “Affordable Care Act” (ACA). There were 26 mentions of these words in the September Beige Book, up from just 15 in July. Clearly, heath care remains a major issue for Main Street as the ACA begins to be implemented. Health care, health insurance, and the Affordable Care Act were mentioned 28 times in June 2013, 26 times in April 2013, and 18 times in the March 2013 Beige Book. The topic warranted just eight mentions in the January 2013 Beige Book. In contrast, those words were found just a handful of times in the Beige Book released a year ago (July and August 2012). We will continue to monitor these health care words closely in the upcoming Beige Books, as the economy continues to adjust to the impact of the ACA. We expect this set of words to grow in importance in the coming months.

2013-09-10_Figure_4A

There were nine mentions of “mortgage rates”/”rising rates” in the September 4, 2013 Beige Book, up from just five in July 2013. There were no mentions of rising rates in the June 2013 Beige Book nor in the Beige Books in July or August 2013. Despite the rise in rates, the Beige Book noted that “attractive financing conditions and pent-up demand supported a robust pace of automobile sales in most Districts” and that “rising home prices and mortgage interest rates may have spurred a pickup in recent market activity, as many ‘fence sitters’ were prompted to commit to purchases.” Rising rates and their impact across all sectors of the economy will be important to monitor in the coming quarters as the Fed begins to scale back quantitative easing.

_________________________________________________________________________________________________________________________________________________________________________________

IMPORTANT DISCLOSURES

The opinions voiced in this material are for general information only and are not intended to provide specific advice or recommendations for any individual. To determine which investment(s) may be appropriate for you, consult your financial advisor prior to investing. All performance reference is historical and is no guarantee of future results. All indices are unmanaged and cannot be invested into directly.

The economic forecasts set forth in the presentation may not develop as predicted and there can be no guarantee that strategies promoted will be successful.

Stock investing involves risk including loss of principal.

Quantitative easing (QE) is a government monetary policy occasionally used to increase the money supply by buying government securities or other securities from the market. Quantitative easing increases the money supply by flooding financial institutions with capital in an effort to promote increased lending and liquidity.

The Federal Open Market Committee (FOMC), a committee within the Federal Reserve System, is charged under the United States law with overseeing the nation’s open market operations (i.e., the Fed’s buying and selling of United States Treasure securities).

This research material has been prepared by LPL Financial.

To the extent you are receiving investment advice from a separately registered independent investment advisor, please note that LPL Financial is not an affiliate of and makes no representation with respect to such entity.

Not FDIC/NCUA Insured | Not Bank/Credit Union Guaranteed | May Lose Value | Not Guaranteed by any Government Agency | Not a Bank/Credit Union Deposit

Member FINRA/SIPC

Beige Book: Window on Main Street
July 23, 2013

Unseasonable Weather Still Weighing on the Economy

The latest edition of the Federal Reserve’s (Fed) Beige Book, released on July 17, 2013, described the economy as increasing at a modest-to- moderate pace, with little wage or inflation pressures. Housing and commercial real estate were mentioned as key drivers of growth. The report, along with comments made by Fed Chairman Ben Bernanke at his semi-annual Monetary Policy Testimony to Congress last week (July 15 – 19), suggest that the Fed is still on track to begin scaling back its quantitative easing (QE) program this fall, but that it remains a long way from tightening monetary policy by raising its fed funds rate target.

In order to provide one snapshot of the entire Beige Book collage of data, we created our proprietary Beige Book Barometer (BBB) [Figure 1]. The barometer ticked down to +79 in July 2013, from +82 last  month. The April 2013 reading was +112. Despite the downtick since April, the BBB remains well above its Superstorm Sandy-related dip to +30 in November 2012. Note that the April 2013 reading (+112) was  both a post-Great Recession high and also the highest reading since 2005, suggesting a broadening and deepening of the economic expansion. The move down to +79 from +112 between the April and July 2013 editions of the Beige Books came as the number of positive words dropped and the number of negative words hit a fresh seven year low in July 2013. The drop in the number of negative words in the Beige Book to a seven-year low can be viewed as reflecting the diminishing pace of headwinds (e.g., fiscal policy, Europe, China, housing) that have hampered the U.S. economic recovery over the past four years.

2013-07-24_Figure_1

Our BBB, a diffusion index that measures the number of times the word “strong” or its variations (stronger, strength, strengthen, etc.) appear in the Beige Book less the number of times the word “weak” or its variations (weaken, weaker, etc.) appear, is displayed in Figure 1. The barometer is an easy-to-use, quantitative way to derive the shades between strong and weak in the predominately qualitative Beige Book report.

Headwinds From Fiscal Policy Diminish

The word “fiscal” appeared just four times in the latest Beige Book, down from five in June 2013, and 12 in April. There were 17 mentions in the March 2013 Beige Book, and a whopping 38 in the January 2013 edition. Because of the timing of the collection of comments for the January 2013 Beige Book (comments from contacts in the business and banking community were collected throughout December 2012 and during the first few days of January 2013), we noted that with 38 mentions of the word “fiscal,” the January 2013 Beige Book likely overstated the impact of the fiscal cliff on economic activity in early 2013.

2013-07-24_Figure_2

At the start of 2013, as Congress passed legislation to avoid the worst case scenario of the fiscal cliff, but allowed the sequester (i.e., government spending cuts prescribed in the debt ceiling agreement reached in 2011) to proceed, we expected that the word “sequester” would start to appear more often in the Beige Book. Thus far, however, that has not been the case. The word sequester was not used at all in the latest two Beige Books (July and June 2013) and appeared just once in the April 2013 Beige Book. Mentions of budget or budget cuts have been almost non-existent in the recent Beige Books as well. Looking ahead, we still expect the word sequester (or related words) to show up in the next several Beige Books, but with the debt ceiling debate and possible government shutdown now pushed back until late 2013, fiscal uncertainty outside of the impact of the sequester will likely continue to fade in upcoming Beige Books. The peak of the impact of the sequester will likely be felt in the recently completed second quarter and third (current) quarter of 2013.

Word Clouds Show Unseasonably Cool Weather and Growing Concern About Impact of Health Care Reform Still Acting as Headwinds

The word clouds in Figure 3 are dominated by words describing the tone of the economy when the Beige Books were published. Below are some observations on the current Beige Book (released on July 17, 2013) relative to other recent editions of the Beige Book.

2013-07-24_Figure_3

  • In the last two Beige Books (June and July 2013), the word “weather” appeared a total of 43 times, 27 times in the June 2013 edition of the Beige Book, and 16 times in the July 2013 version. The 43 mentions were nearly double the 24 mentions of weather in the same two Beige Books in June and July 2012. All but a few of the mentions of weather in the last two (June and July 2013) were in a negative context. The words rain, wet, cool, and cold appeared a total of 22 times in the June and July 2013 Beige Books. These words did not appear at all in the June and July 2012 Beige Books. This helps to explain, in part, the poor U.S. economic data reports — both on an absolute basis and relative to expectations — for much of the spring (March, April, May, and early June), especially in housing. In corporate earnings reports for the second quarter (April, May, and June 2013), managements in the housing construction, lodging, and leisure and hospitality industries have also mentioned unseasonably cold and wet weather as having a negative impact on results. The key takeaway here is that a return to “normal” weather could provide a significant lift to weather-sensitive portions of the economy and to upcoming readings on our BBB. Indeed, the first three weeks of July 2013 have generally seen warmer-than-usual temperatures and less-than-usual amounts of rainfall across the nation.
  • In the Beige Books released in late November 2012 and early January 2013, economic uncertainty surrounding the fiscal cliff and the rebound from the economic disruption wrought by Superstorm Sandy dominated. Sandy and the fiscal cliff have since faded as concerns, and uncertainty has faded a bit as well. There were just seven mentions of the word “uncertain” in the July 2013 Beige Book, down from 13 in the June Beige Book. It was used 26 times in March 2013, and 43 in January 2013. The seven mentions of uncertain in the June 2013 Beige Book were the fewest since June 2011.
  • The word “confidence” appeared just nine times in the latest Beige Book, 10 times in the June 2013 Beige Book, seven times in the April 2013 Beige Book, and 11 times in the March 2013 Beige Book. However, unlike in 2011 and most of 2012, when the word was used in a negative context (i.e., lack of confidence, weak confidence), most of the mentions of the word confidence in the Beige Book have been in a positive context. Eight of the nine mentions in July, nine of the 10 mentions in June, five of the seven mentions in April, and nine of the 11 mentions in the March 2013 Beige Book were in a positive context. Thus, over the past few Beige Books since Superstorm Sandy, business and banking contacts have generally become more confident in the recovery, especially in housing. This suggests that a sustained, multi-year recovery in the housing market is likely underway.
  • Although the number of mentions of “health care,” “health insurance,” and the “Affordable Care Act” (ACA) totaled just 15 in the latest Beige Book, heath care remains a major issue for Main Street as the ACA begins to be implemented. Health care, health insurance, and the Affordable Care Act were mentioned 28 times in June 2013, 26 times in April, and 18 times in the March 2013 Beige Book. The topic warranted just eight mentions in the January 2013 Beige Book. In contrast, those words were found just a handful of times in the Beige Book released a year ago (June and July 2012). We will continue to monitor these health care words closely in the upcoming Beige Books, as the economy continues to adjust to the impact of the ACA. We expect this set of words to grow in importance in the coming months.
  • There were just three mentions of Europe in the latest Beige Book, down from eight mentions in the June 2013 Beige Book. Europe was mentioned nine times in the April 2013 edition of the Beige Book. The three mentions of Europe in July 2013 were the fewest since October 2012, and well below the 15 – 20 mentions seen in the summer and fall of 2012, as Europe struggled through elections in Greece and increased fears of a break-up. Not surprisingly, nearly all of the mentions of Europe in the latest Beige Book were in a negative context. Perhaps business and banking contacts on Main Street are not as exposed to Europe as some of the larger businesses and financial institutions on Wall Street are that dominate media coverage. But it is also worth noting that the European debt crisis is well into its fourth year, and Main Street may be getting used to it now. The relatively few mentions of Europe are consistent with our view that the European economy has probably stopped getting worse, even though it may not accelerate anytime soon.
  • Despite the well-publicized slowdown in China’s economy in the second quarter of 2013, the concerns around an overheated Chinese property market, and a sudden rise in overnight borrowing costs in China, China warranted just two mentions in the latest Beige Book, down from three mentions each in the April and June 2013 Beige Books. The Beige Book suggests that while China has not entirely disappeared from Main Street’s radar, it is far less of a concern than the media makes it out to be. Indeed, the last time China warranted as many as six mentions in the Beige Book was in January 2012, as fears of a “hard landing” in China began to gather steam. The Chinese economy appeared to have bottomed out in late 2012, avoiding a “hard landing,” but recent data in China suggest that it has not re-accelerated as quickly as some market participants hoped.

___________________________________________________________________________________________________________________________________

IMPORTANT DISCLOSURES

The opinions voiced in this material are for general information only and are not intended to provide specific advice or recommendations for any individual. To determine which investment(s) may be appropriate for you, consult your financial advisor prior to investing. All performance reference is historical and is no guarantee of future results. All indices are unmanaged and cannot be invested into directly.

Gross domestic product (GDP) is the monetary value of all the finished goods and services produced within a country’s borders in a specific time period, though GDP is usually calculated on an annual basis. It includes all of private and public consumption, government outlays, investments and exports less imports that occur within a defined territory.

The economic forecasts set forth in the presentation may not develop as predicted and there can be no guarantee that strategies promoted will be successful.

Quantitative easing (QE) is a government monetary policy occasionally used to increase the money supply by buying government securities or other securities from the market. Quantitative easing increases the money supply by flooding financial institutions with capital in an effort to promote increased lending and liquidity.

The Federal Open Market Committee (FOMC), a committee within the Federal Reserve System, is charged under the United States law with overseeing the nation’s open market operations (i.e., the Fed’s buying and selling of United States Treasure securities).
_____________________________________________________________________________________________________________________________________

INDEX DESCRIPTIONS

Purchasing Managers’ Index (PMI) is an indicator of the economic health of the manufacturing sector. The PMI index is based on five major indicators: new orders, inventory levels, production, supplier deliveries and the employment environment.

Beige Book Bounce-Back
March 13, 2013

Positive Tone; More Modest Expansion 

Our proprietary “Beige Book Barometer” ticked up to +66 in March 2013 (from +56 in January 2013), continuing the rebound from a Superstorm Sandy-related dip to +30 in November 2012. Despite the post-Sandy bounce, our Barometer remains well below its recent high of +101, hit in April 2012, and describes an economy that is growing — but only Screen Shot 2013-03-13 at 5.20.34 PMmodestly. The improvement in our Barometer since November 2012 has come as the number of positive words in the Beige Book surged to a nine-month high. The number of negative words ticked up slightly between the January and March 2013 Beige Books, but remains well below the levels seen just after Superstorm Sandy hit.

Our Barometer, a diffusion index that measures the number of times the word “strong” or its variations (stronger, strength, strengthen, etc.) appear in the Beige Book less the number of times the word “weak” or its variations (weaken, weaker, etc.) appear, is displayed in Figure 1. The barometer is an effective, quantitative way to derive the shades between strong and weak in the predominately qualitative Beige Book report.

Still Bouncing Back From the Fiscal Cliff and Sandy

When we wrote about the Beige Book in early December 2012, we noted that despite the tepid reading of our Barometer in November 2012 (+30), there was some reason for modest optimism on the economic outlook. First, the Barometer generally suggested the economy was stronger during the summer and early Screen Shot 2013-03-13 at 5.21.02 PMfall of 2012, prior to the impact of Superstorm Sandy and uncertainty ahead of the fiscal cliff than it was in early 2011, before the bruising debt ceiling debate. In addition, we noted that many of the factors that weighed on our Barometer in November 2012 appeared to be temporary. Indeed, with key indicators like consumer sentiment hitting a five-year high, a sustainable housing recovery in place, and the private economy adding more than 200,000 jobs per month in four of the past five months, the U.S. economy is now on a firmer footing than it was in the summer and fall of 2011. A big driver of the uncertainty in the November 2012 Beige Book was Superstorm Sandy, which had 48 mentions, and virtually all of the mentions were associated with disruptions to economic activity.

In contrast, nearly every one of the 25 mentions of Sandy in January 2013 and all but one of the 11 mentions in the March 2013 edition of the Beige Book was associated with a rebound in, or resumption of, economic activity that was disrupted by the storm in late 2012. Because of the timing of the collection of comments for the January 2013 Beige Book (comments Screen Shot 2013-03-13 at 5.21.40 PMfrom contacts in the business and banking community were collected throughout December 2012 and in the first few days of January 2013), we noted that the Beige Book likely overstated the impact of the fiscal cliff on economic activity in early 2013. Indeed, there were 38 mentions of the word “fiscal” in the January 2013 Beige Book, and almost every mention was accompanied by a word like “uncertainty.” Clearly, the uncertainty was a drag on economic activity among consumers and businesses alike as 2012 drew to a close.

The word “fiscal” appeared just 17 times in the March 2013 Beige Book, and almost all of them were used in a negative context. Looking ahead, the word “sequester” (across the board federal spending cuts that began to go into effect on March 1, 2013) is likely to make a prominent appearance in the next several Beige Books. However, with the debt ceiling debate and possible government shutdown now pushed back until August or September 2013, fiscal uncertainty outside of the impact of the sequester may fade in upcoming Beige Books. The rebound from Sandy will also likely fade in the coming months, although rebuilding from the storm may take years.

While the fiscal cliff debate and the sequester — along with the impact of Sandy may be temporary, though significant — other more persistent factors have weighed on the Barometer since it peaked in April 2012. The ongoing recession in Europe, the economic slowdown in China, the severe damage to the agricultural economy as a result of the drought, and a return to “normal” weather all helped to push the Beige Book Barometer down from +101 in April 2012 to around +50 over the summer and early fall of 2012.

As we expected, the uncertainty surrounding the fiscal cliff and the disruptions caused by Sandy have reversed in recent Beige Books, and our Barometer has returned to the +60 range seen over the spring and summer of 2012. A quick look at Figure 1, however, reveals that our Barometer remains below the range seen in 2005 and 2006, the years just prior to the Great Recession. In short, the Barometer is consistent with other more quantitative metrics on the U.S. economy that suggest that the economy rebounded from the impact of Sandy in early 2013, but is still not back to “normal,” where normal is defined as the pre-Great Recession years of 2005 – 2006, where real gross domestic product (GDP) growth averaged between 2.5% and 3.0%.

Screen Shot 2013-03-13 at 5.21.51 PM

Word Clouds Show Modest Expansion

The nearby word clouds are dominated by words describing the tone of the economy when the Beige Books were published. Screen Shot 2013-03-13 at 5.23.05 PMBelow are some observations on the current Beige Book (released on March 6, 2013) relative to other recent editions of the Beige Book.

  • The economy continued to expand at a “modest to moderate pace” in February and early March 2013. Although the Beige Book corroborates other, more quantitative evidence that the economy is expanding modestly, it is not doing so at a pace that would concern the Federal Reserve that there is upward pressure on wages or prices, which in turn might cause the Fed to slow down or stop its latest round of quantitative easing. The latest Beige Book described wages pressures as “mostly limited” and pricing pressures as “modest.”
  • In the Beige Books released in late November 2012 and early January 2013, economic uncertainty surrounding the fiscal cliff and the rebound from the economic disruption wrought by Superstorm Sandy dominated. There were 43 mentions of “uncertainty,” 25 of “Sandy,” and 38 of “fiscal” in the January 2013 Beige Book, and 26 mentions of “uncertainty,” 48 of “Sandy,” and 15 of “fiscal” in the November 2012 Beige Book. In the latest Beige Book, there were just 26 mentions of “uncertainty,” only 11 of “Sandy,” and just 17 of “fiscal.” While the battle over the sequester (and impact on the economy) is likely to begin appearing in the Beige Books released over the next few quarters, all of these words will likely fade as concerns. However, the debt ceiling debate is likely to heat up again in mid-to-late summer 2013, and could once again return fiscal uncertainty to the pages of the Beige Book.
  • The word “confidence” appeared 11 times in the latest Beige Book. However, unlike in 2011 and most of 2012, when the word was used in a negative context (i.e., lack of confidence, weak confidence), nine of the 11 mentions in the latest Beige Book were in a positive context. Thus, over the past few Beige Books since Superstorm Sandy, business and banking contacts have generally seen increased confidence in the recovery, especially in housing. This suggests that a sustained, multiyear recovery in the housing market is likely underway.
  • Health care, health insurance, and the Affordable Care Act (ACA) were mentioned a total of 15 times in the latest Beige Book, up from eight mentions in the January 2013 Beige Book. In contrast, those words were found just three times in the Beige Book released a year ago (February 2012). We will continue to monitor these health care words closely in the upcoming Beige Books, as the economy continues to adjust to the impact of the ACA.
  • In the Beige Book released in January 2013, China received no mentions, marking the first time since early 2012 that China was not mentioned by business and banking contacts. In the March 2013 edition, China had six mentions, many related to the timing of the Chinese Lunar New Year in 2013 (February) versus 2012 (January). Over the course of 2012, the financial media was chock full of stories on the economic slowdown in China and the recession and debt crisis in Europe. The Beige Book suggests that while those issues have not entirely disappeared from Main Street’s radar, they are far less of a concern than the media makes them out to be. Indeed, the last time China warranted as many as six mentions was in January 2012, as fears of a “hard landing” in China began to gather steam. The Chinese economy appeared to have bottomed out in late 2012, avoiding a “hard landing.” The recent data suggest that China’s economy is re-accelerating as 2013 begins, although, as the Beige Book points out, the timing of the Lunar New Year this year, which can impact economic data, is making it difficult to draw any conclusions about the health of the Chinese economy right now.
  • Despite the recent flare-up in Europe, related to the lack of a clear winner in the Italian presidential elections, there were only six mentions of Europe in the latest Beige Book, down from eight in January 2013’s Beige Book. The six mentions in March’s Beige Book were well below the 15 – 20 mentions seen in the summer and fall of 2012, as Europe struggled through elections in Greece and increased fears of a break-up. Not surprisingly, nearly all of the mentions of Europe in the latest Beige Book were in a negative context. Perhaps business and banking contacts on Main Street are not as exposed to Europe as some of the larger businesses and financial institutions on Wall Street that dominate media coverage. But it is also worth noting that the European debt crisis is in its fourth year, and Main Street may be getting used to it now.

_______________________________________________________________________________________IMPORTANT DISCLOSURES

The opinions voiced in this material are for general information only and are not intended to provide specific advice or recommendations for any individual. To determine which investment(s) may be appropriate for you, consult your financial advisor prior to investing. All performance reference is historical and is no guarantee of future results. All indices are unmanaged and cannot be invested into directly.

Gross domestic product (GDP) is the monetary value of all the finished goods and services produced within a country’s borders in a specific time period, though GDP is usually calculated on an annual basis. It includes all of private and public consumption, government outlays, investments and exports less imports that occur within a defined territory.

The economic forecasts set forth in the presentation may not develop as predicted and there can be no guarantee that strategies promoted will be successful.

Stock investing involves risk including loss of principal.

The Federal Open Market Committee action known as Operation Twist began in 1961. The intent was to flatten the yield curve in order to promote capital inflows and strengthen the dollar. The Fed utilized open market operations to shorten the maturity of public debt in the open market. The action has subsequently been reexamined in isolation and found to have been more effective than originally thought. As a result of this reappraisal, similar action has been suggested as an alternative to quantitative easing by central banks.

The Federal Open Market Committee (FOMC), a committee within the Federal Reserve System, is charged under the United States law with overseeing the nation’s open market operations (i.e., the Fed’s buying and selling of United States Treasure securities).

_______________________________________________________________________________________INDEX DESCRIPTIONS

Purchasing Managers Index (PMI) is an indicator of the economic health of the manufacturing sector. The PMI index is based on five major indicators: new orders, inventory levels, production, supplier deliveries and the employment environment.

The Consumer Price Index (CPI) is a measure of the average change over time in the prices paid by urban consumers for a market basket of consumer goods and services.

_______________________________________________________________________________________ This research material has been prepared by LPL Financial.

To the extent you are receiving investment advice from a separately registered independent investment advisor, please note that LPL Financial is not an affiliate of and makes no representation with respect to such entity.

Not FDIC/NCUA Insured | Not Bank/Credit Union Guaranteed | May Lose Value | Not Guaranteed by any Government Agency | Not a Bank/Credit Union Deposit

_______________________________________________________________________________________

Stay Connected with Us!


www.garrettandrobinson.com

Beige Book Rebounds
January 24, 2013

Weekly Market Commentary from Garrett and Robinson

Modest Expansion

Despite elevated levels of uncertainty surrounding the debate over the fiscal cliff in December 2012 and in the first few days of January 2013, our proprietary “Beige Book Barometer” moved up to +56 in January 2013, rebounding from a Superstorm Sandy-related dip to +30 in November 2012. Still, our Barometer remains well below its recent high of +101, hit in April 2012. The improvement in our barometer between November 2012 and January 2013 was largely the result of a drop in the number of negative words in the Beige Book; there was only a modest change in the number of positive words in the Beige Book between November 2012 and January 2013. Our Barometer, a diffusion index that measures the number of times the word “strong” or its variations (stronger, strength, strengthen, etc.) appear in the Beige Book less the number of times the word “weak” or its variations (weaken, weaker, etc.) appear, is displayed in Figure 2. The barometer is an effective, quantitative way to derive the shades between strong and weak in the predominately qualitative Beige Book report.

Bouncing Back From the Fiscal Cliff and Sandy

Uncertainty Surrounding Fiscal CliffWhen we last wrote about the Beige Book in early December 2012, we noted that despite the tepid reading of our Barometer in November 2012 (+30), there was some reason for modest optimism on the economic outlook. First, the Barometer generally suggested the economy was stronger heading into the debate around the fiscal cliff and Sandy in the summer and fall of 2012 than it was in early 2011, ahead of the bruising debt ceiling debate. In addition, many of the factors that weighed on our Barometer in November 2012 appeared to be temporary. Indeed, with key indicators like consumer sentiment hitting a five-year high and initial claims for unemployment benefits hitting a five-year low in late 2012, the U.S. economy is now on a firmer footing than it was in the summer and fall of 2011. A big driver of the uncertainty in the November 2012 Beige Book was Superstorm Sandy, which had 48 mentions, and virtually all of the mentions were associated with disruptions to economic activity.

In contrast, nearly every one of the 25 mentions of Sandy in January 2013 was associated with a rebound in, or resumption of, economic activity that was disrupted by the storm in late 2012.  Because of the timing of the collection of comments for the January 2013 Beige Book (comments from contacts in the business and banking community were collected throughout December 2012 and in the first few days of January 2013), the latest Beige Book likely overstated the impact of the fiscal cliff on economic activity in early 2013. However, there were 38 mentions of the word “fiscal” in the January 2013 Beige Book, and almost every mention was accompanied by a word like “uncertainty.” Clearly, the uncertainty was a drag on economic activity among consumers and businesses alike as 2012 drew to a close.

Figure 2 Barometer Ticks Up

While the fiscal cliff debate and the impact of Sandy may be temporary, though significant, other more persistent factors have weighed on the Barometer since it peaked in April 2012. The ongoing recession in Europe, the economic slowdown in China, the severe damage to the agricultural economy as a result of the drought, and a return to “normal” weather all helped to push the Beige Book Barometer down from +101 in April 2012 to around +50 over the summer of 2012.

Even if the uncertainty surrounding the fiscal cliff and the disruptions caused by Sandy reversed, and our Barometer returned to the +60 range seen over the spring and summer of 2012, it would still remain below the range seen in 2005 and 2006, the years just prior to the Great Recession. In short, the Beige Book Barometer is consistent with other more quantitative metrics on the U.S. economy that suggest that the economy is in recovery, and growing at around 2.0% (as measured by gross domestic product [GDP]) but is still not back to “normal,” where normal is defined as the pre- Great Recession years of 2005 – 2006, where real GDP growth averaged between 2.5% and 3.0%.

Word Clouds Show Modest Expansion

The nearby word clouds are dominated by words describing the tone of the economy when the Beige Books were published. Below are some observations on the current Beige Book (released on January 16, 2013) relative to other recent editions of the Beige Book.

Beige Book Word Cloud - 1-2013Beige Book Word Cloud - 11-2012

  • The  economy is expanding at a modest pace, perhaps a step up from the measured pace seen in November 2012, representing a rebound in activity after the disruption caused by Superstorm Sandy.
  • The latest Beige Book was dominated by uncertainty surrounding the fiscal cliff and the rebound from the economic disruption wrought by Superstorm Sandy. There were 43 mentions of “uncertainty,” 25 of “Sandy,” and 38 of “fiscal” in the January 2013 Beige Book.
  • The word “confidence,” which was used 11 times in the September 2011 Beige Book amid the worst of the situation in Europe, appeared just five times in the latest Beige Book. During the summer and fall of 2011, the word confidence appeared an average of eight times in each Beige Book. Increased uncertainty (Sandy and fiscal cliff), rather than lack of economic confidence, seems to best describe the current economic environment on Main Street in late 2012/early 2013.
  • The lack of rain and concerns over the drought in the midsection of the United States made another significant appearance in the latest Beige Book, although these concerns have faded in recent Beige Books. The word “drought” was mentioned 11 times in January 2013, 18 times in November 2012, 19 times in October 2012, and 22 times in August 2012. Drought warranted only a handful of mentions in the Beige Books released in late 2011 and early 2012. The word “crop” was mentioned 16 times in the January 2013 Beige Book after 20 mentions in the November 2012 Beige Book. Crop warranted 26 mentions in October 2012 and 22 in August 2012. A look back to the Beige Books of a year ago (July 2011 through January 2012) finds that drought was also a concern (mentioned 37 times in those four Beige Books). However, in the last five Beige Books (July 2012 through January 2013), the word drought appeared 73 times.  Looking ahead, we would expect drought and the damage to crops due to the lack of rain this past summer in the Midwest to continue to impact the Beige Book in the coming months, and the economy could begin to see higher prices for some foods as soon as this spring.
  • For the first time since the February 2012 Beige Book, China received no mentions in the Beige Book. Over the course of 2012, the financial media was chock full of stories on the economic slowdown in China and the recession and debt crisis in Europe. The Beige Book suggests that while those issues have not entirely disappeared from Main Street’s radar, they are far less of a concern than the media makes them out to be. China had no mentions in the latest Beige Book, two in the November 2012 Beige Book, and just one mention in the August 2012 and October 2012 Beige Books. The recent peak for mentions of China was six in the January 2012 Beige Book. The Chinese economy appeared to have bottomed out in late 2012, avoiding a “hard landing.” The recent data suggest that China’s economy is re-accelerating as 2013 begins.
  • There were just eight mentions of Europe in the latest Beige Book, up from seven in November 2012, but down from 12 in October 2012 and 20 in August 2012. Not surprisingly, all of the mentions of Europe in the latest Beige Book were in a negative context. Perhaps business and banking contacts on Main Street are not as exposed to Europe as some of the larger businesses and financial institutions on Wall Street that dominate media coverage. But it is also worth noting that the European debt crisis is in its fourth year, and Main Street may be getting used to it now.

_____________________________________________________________________________________________________________

IMPORTANT DISCLOSURES

The opinions voiced in this material are for general information only and are not intended to provide specific advice or recommendations for any individual. To determine which investment(s) may be appropriate for you, consult your financial advisor prior to investing. All performance reference is historical and is no guarantee of future results. All indices are unmanaged and cannot be invested into directly.

* Gross Domestic Product (GDP) is the monetary value of all the finished goods and services produced within a country’s borders in a specific time period, though GDP is usually calculated on an annual basis. It includes all of private and public consumption, government outlays, investments and exports less imports that occur within a defined territory.

^ Federal Funds Rate is the interest rate at which depository institutions actively trade balances held at the Federal Reserve, called federal funds, with each other, usually overnight, on an uncollateralized basis.

† Private Sector – the total nonfarm payroll accounts for approximately 80% of the workers who produce the entire gross domestic product of the United States. The nonfarm payroll statistic is reported monthly, on the first Friday of the month, and is used to assist government policy makers and economists determine the current state of the economy and predict future levels of economic activity. It doesn’t include:

  • general government employees
  • private household employees
  • employees of nonprofit organizations that provide assistance to individuals
  • farm employees

The economic forecasts set forth in the presentation may not develop as predicted and there can be no guarantee that strategies promoted will be successful.  Stock investing involves risk including loss of principal.  International investing involves special risks, such as currency fluctuation and political instability,  nd may not be suitable for all investors.

The Federal Open Market Committee action known as Operation Twist began in 1961. The intent was to flatten the yield curve in order to promote capital inflows and strengthen the dollar. The Fed utilized open market operations to shorten the maturity of public debt in the open market. The action has  subsequently been reexamined in isolation and found to have been more effective than originally thought. As a result of this reappraisal, similar action has been suggested as an alternative to quantitative easing by central banks.

The Federal Open Market Committee (FOMC), a committee within the Federal Reserve System, is charged under the United States law with overseeing the nation’s open market operations (i.e., the Fed’s buying and selling of United States Treasure securities).

The index of leading economic indicators (LEI) is an economic variable, such as private-sector wages, that tends to show the direction of future economic  activity.

International Monetary Fund (IMF) is an international organization created for the purpose of promoting global monetary and exchange stability, facilitating the expansion and balanced growth of international trade, and assisting in the establishment of a multilateral system of payments for current transactions.

_____________________________________________________________________________________________________________

INDEX DESCRIPTIONS

Purchasing Managers Index (PMI) is an indicator of the economic health of the manufacturing sector. The PMI index is based on five major indicators: new orders, inventory levels, production, supplier deliveries and the employment environment.

The Richmond Manufacturing Index is a composite index that represents a weighted average of the shipments, new orders and employment indexes. Each index is a diffusion index, i.e., it is equal to the percentage of responding firms reporting increases minus the percentage reporting decreases, with results based on responses from 80 out of 110 firms surveyed.

This research material has been prepared by LPL Financial.

To the extent you are receiving investment advice from a separately registered independent investment advisor, please note that LPL Financial is

not an affiliate of and makes no representation with respect to such entity.

Not FDIC/NCUA Insured | Not Bank/Credit Union Guaranteed | May Lose Value | Not Guaranteed by any Government Agency | Not a Bank/Credit Union Deposit

Member FINRA/SIPC

Market Insight – Fourth Quarter 2012
January 15, 2013

Stocks Limped to the Finish but Delivered Solid Double-Digit Returns in 2012

The U.S. economy faces the weakest global backdrop since the Great Recession of 2008 – 09, as the drag from the so-called fiscal cliff — the combination of tax increases and spending cuts — looms in 2013. Also contributing to subpar economic growth at the end of the year was the ongoing recession in Europe and the impact of Superstorm Sandy in the northeastern United States. The benefits of Federal Reserve (Fed) stimulus and the positive consumer wealth effect of the rebounding housing and stock markets provided a partial offset, but the economy remained on a path of weak economic growth as 2013 approached.

Stocks limped to the finish as 2012 ended but delivered solid double-digit returns in 2012, consistent with our forecast as laid out in our Outlook 2012 publication. Several challenges prevented the S&P 500 in the fourth quarter from building on the strong gains in the first nine months of the year, most notably the fiscal cliff. In late October, the massive disruption from Superstorm Sandy put downward pressure on the economy, followed by a post-election slide in early November ahead of the contentious lame duck session in Congress that increased stock market volatility in December.
The Barclays Aggregate Bond Index eked out a marginal 0.2% return in the fourth quarter, which brought the total return for the broad bond market index in 2012 to 4.2%, consistent with our forecast for low to mid-single-digit total returns initially noted in our Outlook 2012. The quarter and the year were led by more economically sensitive and higher yielding bond sectors, such as high-yield and investment-grade corporate bonds and emerging market debt.

Commodities were unable to build on solid third quarter gains, as the Dow Jones-UBS Commodity Index fell 6.4% during the fourth quarter. The commodity index followed the equity market for the majority of the quarter, before diverging starting in late November, as stocks grinded higher in anticipation of a budget compromise in Washington while commodities fell. For the year, commodities were essentially flat as lower crude oil prices offset gains in natural gas, metals, and agriculture.

Economy – Fiscal Cliff Uncertainty, Superstorm Sandy Weigh on Economic Growth

The U.S. economy faces the weakest global backdrop since the Great Recession of 2008 – 09, as the drag from the so-called fiscal cliff — the combination of tax increases and spending cuts — looms in 2013. Also contributing to subpar economic growth at the end of the year was the ongoing recession in Europe and the impact of Superstorm Sandy in the northeastern United States. The benefits of Federal Reserve (Fed) stimulus and the positive consumer wealth effect of the rebounding housing and stock markets provided a partial offset, but the economy remained on a path of weak economic growth as 2013 approached.

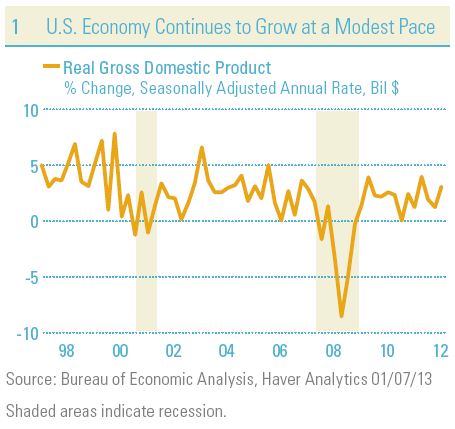
Third quarter gross domestic product (GDP) did surprise on the upside, with the latest revision showing a 3.1% annualized growth rate after an initial reading of 2.0%, and up from 1.3% in the prior (second) quarter [Figure 1]. The upward revision was driven by government spending and higher inventories, neither of which are likely to be sustained. Government spending actually grew 3.9% in the quarter, the fastest in more than three years, ahead of looming spending cuts prescribed by the Budget Control Act of 2011. Consumer spending continued to hang in, growing 1.6% in the quarter, while housing construction was a bright spot. Trade was a positive contributor to growth, as imports fell marginally and exports rose modestly as the US dollar stabilized and Europe fears abated.

Economy grows at modest paceLower business investment was a drag on growth in the third quarter. Budget uncertainty in Washington following the status quo election outcome in the White House and Congress led company management teams to sit on cash, or return it to shareholders in the form of dividends and share buybacks, rather than make longer term commitments by increasing capital expenditures. A decline in farm inventory related to the summer drought was also a drag on growth during the quarter.

Core inflation moderated from 1.7% to 1.1%, providing a favorable backdrop for additional bond purchases from the Fed announced in December. Aggressive stimulus from the Fed in the form of additional quantitative easing (fresh purchases of Treasuries and mortgage-backed securities [MBS]) has kept mortgage and other borrowing costs low while supporting exports by limiting appreciation of the US dollar versus those of our key trading partners.

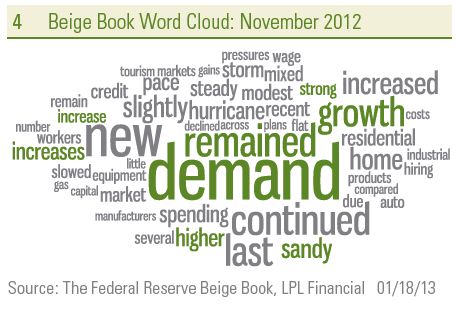
Data available for the fourth quarter suggest the sluggish growth experienced in the first half of 2012 — at or below a 2% pace — will continue. The Fed and the recovery in the housing markets remain supportive, but with higher taxes and spending cuts looming in 2013, even with greater budget certainty, any meaningful pickup in consumer or business spending beyond 2% to close out 2012 and as 2013 gets underway appears unlikely.

Consumers still hanging inThe sluggish pace of growth reflected in recent data is not sufficient to drive a meaningful pickup in the labor market. Job growth has improved marginally but remains lackluster while the unemployment rate remains stubbornly high. In addition to policy uncertainty, Superstorm Sandy has had a negative impact, although job losses from the storm should reverse in the coming months as the rebuilding effort gathers steam. The economy created an average of about 180,000 private sector jobs in September through December, still below the pace that would typically be seen at this stage of an economic recovery, but a bit better than the pace of the spring and summer months. (See our January 7, 2013 Weekly Economic Commentary: Full Speed Recovery? for a comparison of the current economic recovery versus previous recoveries.) The unemployment rate has been below 8.0% since September, but a shrinking labor force continues to drive the modest improvement (the dominator in the unemployment rate calculation). On the bright side, the December 2012 reading of 168,000 new private sector jobs represented a positive surprise.

Leading Indicators
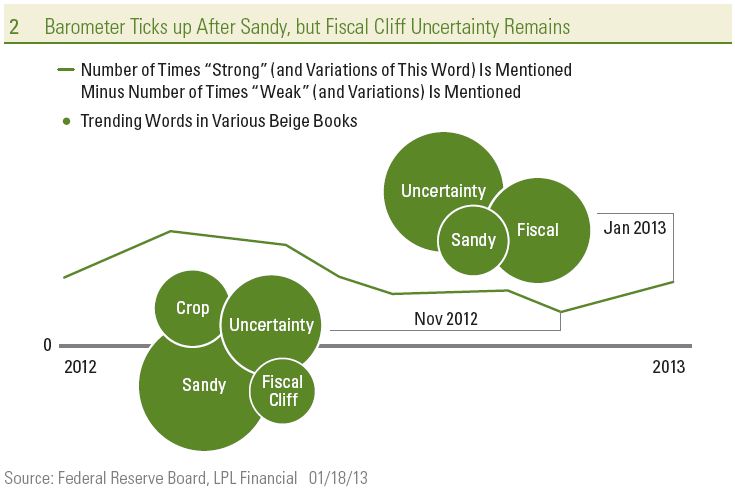
Despite sluggish job growth, marginal improvement (at best) in the stubbornly high unemployment rate, disruptions from Superstorm Sandy, and prospects for higher taxes in 2013, consumers hung in at the end of 2012 [Figure 2]. Total retail sales in November, as reported by the U.S. government, rose a respectable 3.7% year-over-year, as the wealth effect from higher stock and home prices and the start of Sandy rebuilding efforts helped offset the hit to consumer traffic in the early part of the month in the aftermath of the storm. Sales in the 2012 holiday shopping season were disappointing, only matching lowered expectations, not surprising given the impact of Sandy and the uncertainty surrounding the fiscal cliff negotiations. Looking forward, leading indicators continue to point toward growth, not recession [Figure 3].

Stock Markets – Fiscal Cliff Uncertainty Prevents Stocks From Building on 2012 Gains

Stocks limped to the finish as 2012 ended, but delivered solid double-digit returns in 2012, consistent with our forecast as laid out in our Outlook 2012 publication. Several challenges prevented the S&P 500 in the fourth quarter from building on the strong gains in the first nine months of the year [Figure 4], most notably the fiscal cliff — the combination of tax increases and spending cuts scheduled to take effect after year-end. In late October, the massive disruption from Superstorm Sandy put downward pressure on the economy, followed by a post-election slide in early November, which based on the status quo outcome, set the stage for the contentious lame duck session in Congress that increased stock market volatility in December.

S&P 500Besides complacency among market participants, the primary factor offsetting the downward pressure on the economy and markets late in 2012 was the Fed. After announcing a third round of quantitative easing (QE3) in September under which the Fed would purchase $40 billion in MBS each month, it followed that with an additional $45 billion of fresh Treasury purchases announced in mid-December, which confirmed the market’s expectation that the program would be maintained for the foreseeable future. These moves are expected to keep interest rates and borrowing costs low, and continue to push investors further out on the risk spectrum away from Treasuries and other high-quality fixed income investments, and cash. Meanwhile, looking outside the United States, relative stability in Europe and an improved growth outlook for China following its leadership transition also helped offset the drag from U.S. policy uncertainty and prevent stocks from suffering more than a modest fourth quarter decline.

The fourth quarter started off on a down note with a 1.8% decline in October — the worst month since May — amid election uncertainty and the impact of Sandy. The selling pressure then accelerated after the election, pushing the S&P 500 to its low for the quarter on November 15, 2012, at 1353. Stocks then staged an impressive turnaround, rallying 7% over the next month to the high at 1447, supported by confidence that a deal to avert the fiscal cliff would be reached before year-end. After a modestly positive November in which the S&P 500 returned 0.6%, stocks edged slightly higher in December as the market expressed confidence that a budget deal in Washington would be reached.

Strong FinishHeightened fears that the U.S. economy would go over the fiscal cliff led to an increase in stock market volatility in late December. The VIX, a measure of expected stock market volatility, remained low relative to its historical averages — in the mid-to-high teens — throughout much of the quarter before jumping to over 20 in the last week of the year for the first time since July. Looking at volatility another way, after just two days in which the S&P 500 lost more than 1% in the third quarter, investors experienced six such days in the fourth quarter, including three in the week following the election on November 6, 2012.

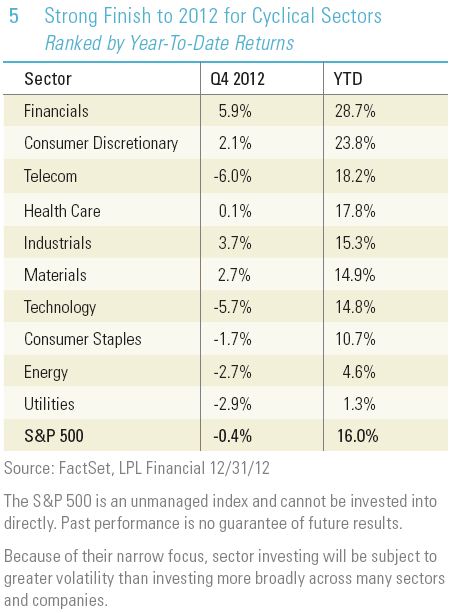
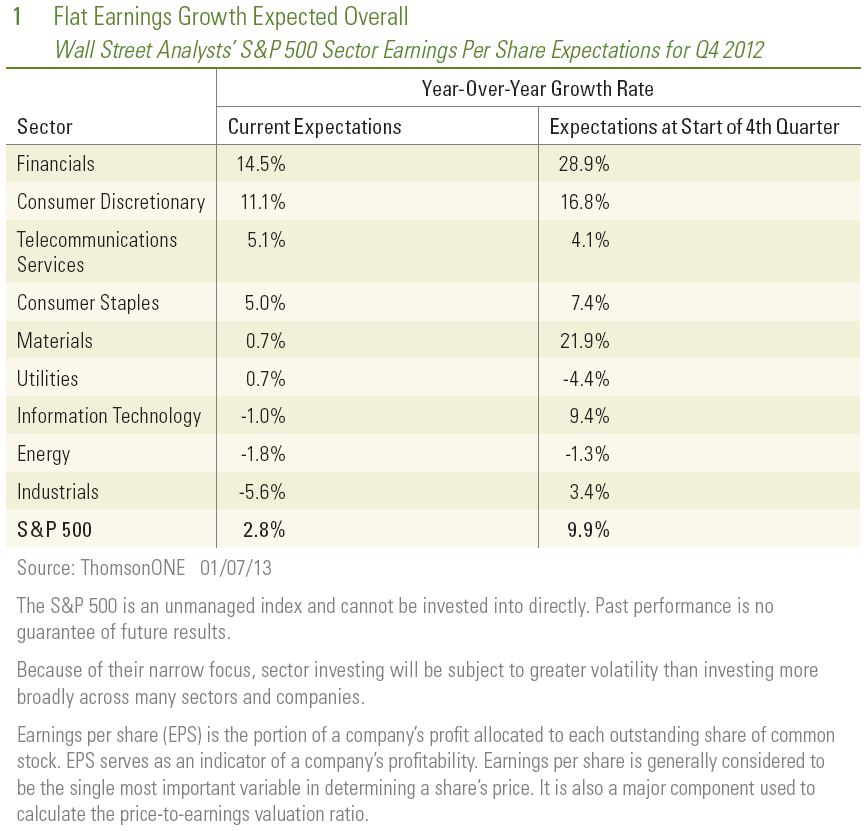
More economically sensitive, or cyclical, sectors generally fared better than defensive sectors again in the fourth quarter after re-establishing leadership during the third [Figure 5]. Financials topped S&P sectors in the quarter with a 5.9% return amid stability in Europe, resilient earnings, attractive valuations, and the ongoing housing recovery. The industrials sector was also a solid performer, as prospects for growth in China improved and the market priced in less onerous spending cuts than those prescribed in the sequestration comprising a portion of the fiscal cliff. While the best-performing sectors were cyclical, technology was a disappointment, weighed down by the more than 20% decline in Apple shares. Despite the 5.7% loss in the quarter, the technology sector still finished the year with a 14.8% return, trailing the S&P 500 by just over 1%. Other sector losers in the quarter included telecom and utilities, which fell 6.0% and 2.9%, respectively, and were hurt by prospects for higher dividend tax rates in 2013.

A strong fourth quarter cemented financials’ place as the biggest sector winner in 2012. The sector was buoyed by stability in Europe, support from the Fed, and an improving housing market, which combined to drive a strong year for the stock and credit markets in 2012. Led by home improvement and internet retailers and media companies, the consumer discretionary sector outperformed for the fifth straight year with a stellar 23.8% return. Consumer spending continued to hang in there with help from higher stock and home prices, the so-called wealth effect, despite only modest gains in consumer incomes and employment. On the downside, it was a tough year for the utilities sector amid the challenging regulatory environment, lackluster growth, Superstorm Sandy disruptions, and prospects for higher dividend tax rates.

Like sector performance, market cap performance also revealed investors’ preference for a bit more cyclicality and market sensitivity in the fourth quarter. Mid cap stocks performed best in the quarter, as the Russell Midcap Index returned 2.9%, outpacing both the large cap Russell 1000 Index (+0.1%) and the small cap Russell 2000 Index (+1.9%). Mid caps also benefited from an increase in merger and acquisition activity, while weakness in technology dragged the large cap benchmark lower. The strong performance by mid caps in the fourth quarter reversed the third quarter pattern, which saw large caps lead the way as investors preferred the stability and more attractive valuations offered by larger companies. For the year, capitalization was not much of a driver of relative performance with large, mid, and small each generating returns of 16 – 17%.

In terms of style, value made a strong fourth quarter comeback to pull slightly ahead of growth for the year across market capitalizations. Gains for the Russell 1000 Value Index, Midcap Value Index, and Russell 2000 Value Index were 1.5%, 3.9%, and 3.2%, respectively, each ahead of their respective growth counterparts, which returned -1.3%, 1.7%, and 0.5% in the quarter. The relatively strong finish helped value end the year ahead of growth across all market capitalizations, by between 2% and 3%. The biggest driver of the strength in value, particularly late in the year, was the market-leading performance by the financial sector, the biggest weight in the value indexes, coupled with underperformance by the technology sector, the biggest growth sector.

The improved performance by international equities that began in the summer gathered momentum late in 2012, as the MSCI EAFE handily outpaced the broad U.S. market averages with a 6.6% return in the fourth quarter. Relative stability in Europe as the Eurozone continued to make progress toward fiscal and monetary integration, along with policy optimism and a weaker yen in Japan, were among the key drivers of this strength in foreign markets. Emerging markets also performed very well, returning 5.6% in the quarter as the growth outlook for China in 2013 has improved, consistent with fresh stimulus and the political leadership transition. The strong finish for international markets, supported by attractive valuations and less policy uncertainty, pushed both benchmarks ahead of the S&P 500 Index for the year, with the MSCI EAFE and Emerging Markets Indexes returning 17.8% and 18.6%, respectively, in 2012, compared to 16.0% for the S&P 500 Index.

Commodities Asset Classes: Down Fourth Quarter Leads to Flat 2012

Commodities were unable to build on solid third quarter gains as the Dow Jones-UBS Commodity Index fell 6.4% during the fourth quarter. The commodity index followed the equity market for the majority of the quarter, before diverging starting in late November, as stocks grinded higher in anticipation of a budget compromise in Washington while commodities fell.

Late-year weakness was concentrated in natural gas and agriculture. For the year, commodities were essentially flat as lower crude oil prices offset gains in natural gas, metals, and agriculture.

For commodity investors, fourth quarter performance was disappointing because of the tailwinds that were in place. Perhaps the biggest tailwind has been the Fed. After announcing another round of bond purchases in September, the central bank added more purchases in December. This stimulative monetary policy has not put meaningful incremental pressure on the US dollar (in no small part due to similar actions by other countries’ central banks), nor has it increased near-term inflation expectations, dampening the potential upward pressure on commodity prices, particularly precious metals.

The other tailwind for commodities that has not translated into gains has been the stabilization and early signs of a pickup in the Chinese economy. Chinese policymakers took a number of measures to stimulate their economy in 2012 and achieve a so-called soft landing, including reducing bank reserve requirements and interest rates. These efforts, combined with other targeted fiscal initiatives, have begun to take effect and show up in improving Chinese economic data. The recently completed leadership transition improves the growth outlook for the world’s second-largest economy as the outward focus is renewed.

West Texas crude
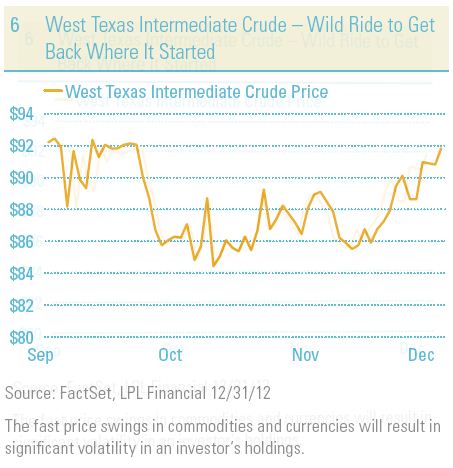
Looking at individual commodities, energy was volatile during the quarter, but crude oil [Figure 6] and natural gas prices both ended roughly where they started near $92 per barrel (West Texas Intermediate) and $3.30 per btu (Nymex), respectively. The two commodities took very different paths to get there, with natural gas rising sharply in the first part of the quarter before forecasts for a relatively warm winter took it down sharply over the last six weeks of the year. Conversely, crude oil fell along with stocks in the early part of the quarter amid concerns on both the demand and the supply side, including the impact of Superstorm Sandy, before rallying back to breakeven as the equity markets moved higher, the growth outlook for both the United States and China improved, and tensions in the Mideast escalated. For the year, crude oil ended down 7% while natural gas rose 1%.

Gold
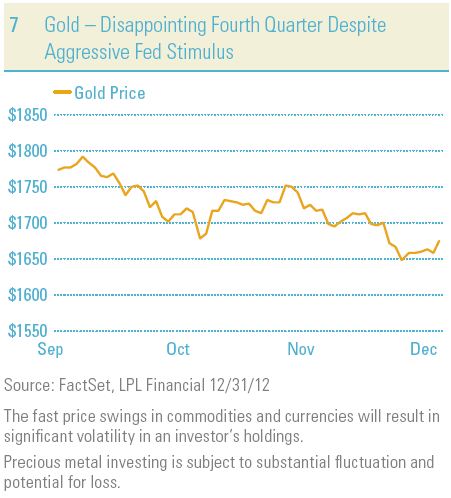
Precious metals’ performance during the fourth quarter was particularly disappointing, given the additional stimulus provided by the Fed. Gold lost about $100, or 5.5%, to end the year at $1676 [Figure 7], while silver fell 12%. The US dollar was only marginally lower in the quarter as central banks around the world are engaging in similarly aggressive stimulus. But the gold thesis is broader than just the US dollar and includes emerging market demand and low interest rates, factors that remained supportive throughout much of the quarter. However, these factors had little impact on the precious metal, which trailed the equity market rebound in December. Gold still managed its twelfth straight annual gain despite the lackluster finish, ending 2012 up 7%. Industrial metals did not fare much better in the fourth quarter, as copper lost 3%, but still ended the year with a 6% gain.

AgricultureAgriculture gave back all of its third quarter gains as the Dow Jones-UBS Agriculture Index lost 10% during the fourth quarter [Figure 8]. After sharp increases in grain prices over the summer due to the significant crop damage from the Midwest droughts, the supply picture in the United States became a bit less dire. International harvest prospects also improved late in the year, in Latin America especially, while key export partners including China increasingly balked at higher U.S. prices. These factors contributed to sharp declines in corn, wheat, and soybeans during the quarter of between 8% and 14%, although wheat and soybeans still posted double-digit gains in 2012, and corn rose 8%. The broad agriculture index still rose 4% for the year, despite the steep fourth quarter losses.

Fixed Income – Taxable: Investors Continued to Favor Higher Yielding Fixed Income Over High Quality

The Barclays Aggregate Bond Index eked out a marginal 0.2% return in the fourth quarter, the sixteenth gain out of the past 17 quarters for the index. Fourth quarter gains brought the total return for the broad bond market index in 2012 to 4.2%, consistent with our forecast for low to mid-single-digit total returns initially noted in our Outlook 2012,                        published in November 2011, and reiterated in our Mid-Year Outlook 2012 publication.

10 Year TreasuryThe quarter and the year were led by more economically sensitive and higher yielding bond sectors, such as high-yield and investment-grade corporate bonds and emerging market debt, while high-quality bonds including U.S. Treasuries and MBS underperformed. Investors continued to be attracted to the additional income provided by these bond sectors relative to high-quality bonds, as expanded bond purchases by the Fed continued to push investors into higher yielding areas of the bond market. Treasuries fell marginally during the quarter, as the modest income component was not sufficient to offset the slight rise in yields. The 10-year Treasury yield increased 13 basis points during the quarter but remained low by historical standards near 1.8% [Figure 9] as the Fed, subpar economic growth, and benign inflation continued to exert downward pressure on yields and offset the slight improvement in the U.S. growth outlook that helped push yields higher in December.

High-yield corporate bonds and emerging market debt topped the major taxable fixed income sectors in the fourth quarter, as each generated solid returns of 3.3% based on the Barclays High-Yield Index and the J.P. Morgan Emerging Markets Bond Index, as investors were attracted to the higher yields these bond sectors provide. High-yield corporate bonds benefited from spread narrowing as corporate credit metrics continued to improve. Emerging market debt was buffeted by stronger economic growth outlooks, and less policy uncertainty (no fiscal cliff), in key markets in Asia and Latin America, which attracted investors to emerging market equities as well. For the year, emerging market debt topped all taxable bond sectors with a tremendous 18.4% return, followed by high-yield corporate bonds (+15.8%).
Among corporate bonds, longer term bonds fared a bit better as the Barclays Credit Long Index returned 1.3% in the quarter, compared to the 1.1% return for the broad investment-grade corporate benchmark, the Barclays U.S. Corporate Bond Index. Unhedged foreign bonds were hurt by low yields (extreme valuations) and a firm US dollar, losing 2.4% based on the Citigroup non-U.S. World Government Bond Index, although the hedged version of that index managed a respectable 1.2% return in the quarter as conditions in Europe stabilized and growth prospects in Japan improved related to the change in leadership. For the year, the hedged foreign bond benchmark returned 5.5%, while the unhedged index returned just 1.5%.

Among high-quality taxable bond sectors, Treasury inflation protected securities (TIPS) generated the best return at 0.7%, outpacing the marginal loss generated by U.S. Treasuries given the benefit of the inflation protection. MBS were the worst-performing bond sector in the quarter with a 0.2% loss, based on the Barclays U.S. MBS Index, as the modest income premium versus Treasuries failed to offset the impact of heavy prepayment activity. For the year, TIPS were the best-performing high-quality taxable fixed income sector, returning 7.0%, nearly 3% better than the Barclays Aggregate and well ahead of the meager 2.6% and 2.0% returns for MBS and U.S. Treasuries, respectively.

Fixed Income – Tax-free: Continued Municipal Bond Outperformance Though With Higher Volatility

Municipal bonds continued to perform well relative to their taxable high-quality bond counterparts with a 0.7% return in the fourth quarter, based on the Barclays Municipal Bond Index. Municipals continued to benefit from attractive valuations and a yield advantage versus U.S. Treasuries in outperforming the Barclays Aggregate Bond Index, although concerns about a potential cap on tax-exempt interest as part of tax reform did contribute to higher volatility in the fourth quarter and limit returns. Fundamentals are not particularly strong, with defaults starting to increase, though still at relatively low levels. But investors continue to enjoy an even more attractive tax benefit, which becomes more valuable at higher tax rates in 2013. The lower end of the quality spectrum fared best again this quarter, with the Barclays Capital High-Yield Municipal Bond Index returning 3.7% in the quarter to top all major bond sectors, taxable or non-taxable, bringing the 2012 return to a stellar 18.1%.

_____________________________________________________________________________________________

IMPORTANT DISCLOSURES
The opinions voiced in this material are for general information only and are not intended to provide specific advice or recommendations for any individual. To determine which investment(s) may be appropriate for you, consult your financial advisor prior to investing. All performance reference is historical and is no guarantee of future results. All indices are unmanaged and cannot be invested into directly.

Stock investing may involve risk including loss of principal.

All company names noted herein are for educational purposes only and not an indication of trading intent or a solicitation of their products or services. LPL Financial doesn’t provide research on individual equities.

International investing involves special risks, such as currency fluctuation and political instability, and may not be suitable for all investors.

Bonds are subject to market and interest rate risk if sold prior to maturity. Bond values and yields will decline as interest rates rise and bonds are subject to availability and change in price.

Because of their narrow focus, sector investing will be subject to greater volatility than investing more broadly across many sectors and companies.

Precious metal investing is subject to substantial fluctuation and potential for loss.

The fast price swings in commodities and currencies will result in significant volatility in an investor’s holdings.
Correlation is a statistical measure of how two securities move in relation to each other. Correlations are used in advanced portfolio management.

Currency Risk is a form of risk that arises from the change in price of one currency against another. Whenever investors or companies have assets or business operations across national borders, they face currency risk if their positions are not hedged.

Government bonds and Treasury Bills are guaranteed by the U.S. government as to the timely payment of principal and interest and, if held to maturity, offer a fixed rate of return and fixed principal value. However, the value of fund shares is not guaranteed and will fluctuate.

Quantitative easing is a government monetary policy occasionally used to increase the money supply by buying government securities or other securities from the market. Quantitative easing increases the money supply by flooding financial institutions with capital in an effort to promote increased lending and liquidity.

Materials Sector: Companies that are engaged in a wide range of commodity-related manufacturing. Included in this sector are companies that manufacture chemicals, construction materials, glass, paper, forest products and related packaging products, metals, minerals and mining companies, including producers of steel.

Energy Sector: Companies whose businesses are dominated by either of the following activities: The construction or provision of oil rigs, drilling equipment and other energy-related service and equipment, including seismic data collection. The exploration, production, marketing, refining and/or transportation of oil and gas products, coal and consumable fuels.

Health Care Sector: Companies are in two main industry groups—Health care equipment and supplies or companies that provide health care-related services, including distributors of health care products, providers of basic health care services, and owners and operators of health care facilities and organizations. Companies primarily involved in the research, development, production, and marketing of pharmaceuticals and biotechnology products.
Utilities Sector: Companies considered electric, gas or water utilities, or companies that operate as independent producers and/or distributors of power.

Consumer Staples Sector: Companies whose businesses are less sensitive to economic cycles. It includes manufacturers and distributors of food, beverages and tobacco, and producers of non-durable household goods and personal products. It also includes food and drug retailing companies.

Consumer Discretionary Sector: Companies that tend to be the most sensitive to economic cycles. Its manufacturing segment includes automotive, household durable goods, textiles and apparel, and leisure equipment. The service segment includes hotels, restaurants and other leisure facilities, media production and services, consumer retailing and services, and education services.

Telecommunications Services Sector: Companies that provide communications services primarily through a fixed line, cellular, wireless, high bandwidth and/or fiber-optic cable network.

Financials Sector: Companies involved in activities such as banking, consumer finance, investment banking and brokerage, asset management, insurance and investment, and real estate, including REITs.

Industrials Sector: Companies whose businesses manufacture and distribute capital goods, including aerospace and defense, construction, engineering and building products, electrical equipment and industrial machinery. Provide commercial services and supplies, including printing, employment, environmental and office services. Provide transportation services, including airlines, couriers, marine, road and rail, and transportation infrastructure.

Technology Software & Services Sector: Companies include those that primarily develop software in various fields such as the internet, applications, systems and/or database management and companies that provide information technology consulting and services; technology hardware & equipment, including manufacturers and distributors of communications equipment, computers and peripherals, electronic equipment and related instruments, and semiconductor equipment and products.

_____________________________________________________________________________________________

INDEX DEFINITIONS
The Barclays Aggregate Bond Index represents securities that are SEC-registered, taxable, and dollar denominated. The index covers the U.S. investment-grade fixed rate bond market, with index components for government and corporate securities, mortgage pass-through securities, and asset-backed securities.

The Barclays Capital High Yield Index covers the universe of publicly issued debt obligations rated below investment grade. Bonds must be rated below investment-grade or high-yield (Ba1/BB+ or lower), by at least two of the following ratings agencies: Moody’s, S&P, and Fitch. Bonds must also have at least one year to maturity, have at least $150 million in par value outstanding, and must be US dollar denominated and non-convertible. Bonds issued by countries designated as emerging markets are excluded.

The Barclays Capital High Yield Municipal Bond Index is an unmanaged index made up of bonds that are non-investment grade, unrated, or rated below Ba1 by Moody’s Investors Service with a remaining maturity of at least one year.

The Barclays Capital Long Government/Credit Index measures the investment return of all medium and larger public issues of U.S. Treasury, agency, investment-grade corporate, and investment-grade international dollar-denominated bonds with maturities longer than 10 years. The average maturity is approximately 20 years.

The Barclays Corporate Index is an unmanaged index of publicly issued U.S. corporate and specified foreign debentures and secured notes that meet the specified maturity, liquidity, and quality requirements. To qualify, bonds must be SEC-registered. The index includes both corporate and non-corporate sectors. The corporate sectors are Industrial, Utility, and Finance, which include both U.S. and non-U.S. corporations. The non-corporate sectors are Sovereign, Supranational, Foreign Agency, and Foreign Local Government. Bonds must have at least one year to final maturity, must be dollar-denominated and non-convertible, and must have at least $250 million par amount outstanding. Bonds must be rated investment-grade (Baa3/BBB- or higher) by at least two of the following ratings agencies: Moody’s, S&P, Fitch. If only two of the three agencies rate the security, the lower rating is used to determine index eligibility. If only one of the three agencies rates a security, the rating must be investment-grade.

The Barclays Mortgage-Backed Securities Index includes 15- and 30-year fixed-rate securities backed by mortgage pools of the Government National Mortgage Association (GNMA), Federal Home Loan Mortgage Corporation (FHLMC), and Federal National Mortgage Association (FNMA).

The Barclays Municipal Bond Index is a market capitalization-weighted index of investment-grade municipal bonds with maturities of at least one year. All indices are unmanaged and include reinvested dividends. One cannot invest directly in an index. Past performance is no guarantee of future results.

The Citigroup World Government Bond Index is a market-capitalization-weighted index consisting of the government bond markets. Country eligibility is determined based on market capitalization and investability criteria. All issues have a remaining maturity of at least one year.

The Dow Jones – UBS Commodity Index is composed of futures contracts on 19 physical commodities. Unlike equities, which entitle the holder to a continuing stake in a corporation, commodity futures contracts specify a delivery date for the underlying physical commodity.

The JPMorgan Emerging Markets Bond Index Global (“EMBI Global”) tracks total returns for traded external debt instruments in the emerging markets, and is an expanded version of the JPMorgan EMBI+. As with the EMBI+, the EMBI Global includes U.S. dollar-denominated Brady bonds, loans, and Eurobonds with an outstanding face value of at least $500 million. It covers more of the eligible instruments than the EMBI+ by relaxing somewhat the strict EMBI+ limits on secondary market trading liquidity.

MSCI EAFE is made up of approximately 1,045 equity securities issued by companies located in 19 countries and listed on the stock exchanges of Europe, Australia, and the Far East. All values are expressed in US dollars. All values are expressed in US dollars. Past performance is no guarantee of future results.

The MSCI Emerging Markets Index is a free float-adjusted market capitalization index that is designed to measure equity market performance in the global emerging markets. As of May 2005, the MSCI Emerging Markets Index consisted of the following 26 emerging market country indices: Argentina, Brazil, Chile, China, Colombia, Czech Republic, Egypt, Hungary, India, Indonesia, Israel, Jordan, Korea, Malaysia, Mexico, Morocco, Pakistan, Peru, Philippines, Poland, Russia, South Africa, Taiwan, Thailand, Turkey, and Venezuela.

Russell 1000® Growth Index measures the performance of those Russell 1000 companies with higher price-to-book ratios and higher forecasted growth values.

Russell 1000® Value Index measures the performance of those Russell 1000 companies with lower price-to-book ratios and lower forecasted growth values.

Russell 2000® Growth Index measures the performance of those Russell 2000 companies with higher price-to-book ratios and higher forecasted growth values.

Russell 2000® Value Index measures the performance of those Russell 2000 companies with lower price-to-book ratios and lower forecasted growth values.

The Russell Mid Cap Value Index offers investors access to the mid cap value segment of the U.S. equity universe. The Russell Mid Cap Value Index is constructed to provide a comprehensive and unbiased barometer of the mid cap value market. Based on ongoing empirical research of investment manager behavior, the methodology used to determine value probability approximates the aggregate mid cap value manager’s opportunity set.

The Standard & Poor’s 500 Index is a capitalization-weighted index of 500 stocks designed to measure performance of the broad domestic economy through changes in the aggregate market value of 500 stocks representing all major industries.

This research material has been prepared by LPL Financial.
To the extent you are receiving investment advice from a separately registered independent investment advisor, please note that LPL Financial is not
an affiliate of and makes no representation with respect to such entity.

Not FDIC or NCUA/NCUSIF Insured | No Bank or Credit Union Guarantee | May Lose Value | Not Guaranteed by any Government Agency | Not a Bank/Credit Union Deposit

Checking for Collateral Damage
January 10, 2013

After a bounce on the relief from the fiscal cliff deal that took place on New Year’s Day, the stock market has been in a sideways holding pattern. Investors are waiting to see if there was some collateral damage from the battle over the fiscal cliff. This week, we will begin to see if any damage was done to corporate profits in the fourth quarter of 2012. 

Macroeconomic factors have been the key driver of the market lately, but microeconomics will begin to garner investors’ attention in the coming weeks as companies begin to release their fourth quarter earnings reports. Four times a year, investors focus on the most fundamental driver of investment performance: earnings. While only a handful of S&P 500 companies report fourth quarter 2012 results this week, earnings reports will be issued from big U.S. companies including Alcoa, Constellation Brands, Monsanto, and Wells Fargo, among others as the fourth quarter earnings season kicks off.

While the fiscal cliff battle ultimately ended in a modest deal to avert some of the worst consequences to the economy, the related caution, contingency planning, special dividend distributions, and other distractions may have restrained business results. There is some reason to believe the fiscal cliff issues may have had some impact. While Friday’s (January 4, 2013) employment report for December 2012 reflected another month of  modest job growth and broad economic indicators show little measurable effect of the concern over the fiscal cliff, we saw weak business investment act as a drag on growth in the third quarter of 2012. This generally extended into the fourth quarter as corporate leaders were more likely to sit on cash, or return it to shareholders in the form of dividends and share buybacks, rather than make longer term commitments by increasing capital expenditures or ramping up hiring. For example, new orders for business investment were only up 0.5% year-over-year in November 2012, according to the latest U.S. Commerce Department data. Excluding transportation equipment, orders for business spending were  flat. 

Expectations for profit growth among S&P 500 companies in the fourth quarter of 2012 are down to about 3% year-over-year, sharply lower than the 10% growth expected at the start of the quarter. While the estimates are now in line with our long-held outlook*, two sectors are expected to provide double-digit gains and may still present some risk of disappointment [Figure 1].

  • ƒƒThe strong gains in the consumer discretionary sector — largely driven by strong demand for autos and housing — may be at risk due to disappointing retail sales reported during the holiday shopping season as consumers fretted over tax increases.
  • ƒƒ The strong performance by financial stocks backed by similarly strong earnings growth — driven by mortgage lending, securities gains, and cost cutting at the big diversified financial services companies — may be at risk with relatively weak demand for credit, low interest rates  along a flat yield curve, and large insurance losses.

Flat earning Growth

On the other hand, the industrials sector — expected to post the biggest year-over-year earnings decline (-5.6%) among S&P 500 sectors, may offer

the potential for an upside surprise. Industrial production has been solid and exceeded economists’ estimates in the latest data reported for November 2012. Also, in the jobs report for December 2012 released on Friday, January 4, 2013, manufacturing job growth turned much more positive after weak numbers in the prior four months. Renewed hiring among industrial companies may be a sign of confidence by management in the recently improving trend.

Wall Street analysts‘ consensus forecast of S&P 500 earnings per share for the fourth quarter of 2012 is $25.56. If accurate, this will be the lowest quarterly total for earnings per share in  2012. This is unusual; fourth quarter profits during a year of growth are typically the highest of the year. While this week  – the week that Alcoa reports its earnings — is most often referred to as the start of the reporting season, some companies  have already provided their fourth quarter numbers and confirmed a soft environment for profits. For example, FedEx Corporation reported in mid-December 2012 and missed expectations, posting a 12% decline from a year ago, reflecting a weak global economic backdrop and the impact of Superstorm Sandy.

While the results reported for the fourth quarter are important in measuring the impact of the fiscal cliff battle, so will the profit guidance for the coming quarters provided by corporate leaders. Earnings per share for 2012 are expected to end up 3.7% above the total for 2011. We expect another year of lackluster profit growth again in 2013. However, the consensus of Wall Street analysts’ expectations is for 10% growth. The coming weeks may provide insight on the trajectory of profits in 2013.

The focus on microeconomic data in the coming weeks leads us to expect a relatively range-bound market in the near term. However, when the earnings season winds down in February 2013, the fiscal cliff battle part II may emerge as we approach the limit on U.S. borrowing authority, known as the debt ceiling, along with the end of the delay to the spending sequester on February 28 and funding of the U.S. government on March 27. These factors may weigh on the confidence of business leaders to employ capital in the first quarter and extend the sluggish profit  environment.

IMPORTANT DISCLOSURES
The opinions voiced in this material are for general information only and are not intended to provide specific advice or recommendations for any individual. To determine which investment(s) may be appropriate for you, consult your financial advisor prior to investing. All performance reference is historical and is no guarantee of future results. All indices are unmanaged and cannot be invested into directly.

The economic forecasts set forth in the presentation may not develop as predicted and there can be no guarantee that strategies promoted will be successful.

Stock investing involves risk, including the risk of loss.

Consumer Discretionary Sector: Companies that tend to be the most sensitive to economic cycles. Its manufacturing segment includes automotive, household durable goods, textiles and apparel, and leisure equipment. The service segment includes hotels, restaurants and other leisure facilities, media production and services, consumer retailing and services and education services.

Consumer Staples Sector: Companies whose businesses are less sensitive to economic cycles. It includes manufacturers and distributors of food, beverages and tobacco, and producers of non-durable household goods and personal products. It also includes food and drug retailing companies.

Energy Sector: Companies whose businesses are dominated by either of the following activities: The construction or provision of oil rigs, drilling equipment and other energy-related service and equipment, including seismic data collection. The exploration, production, marketing, refining and/or transportation of oil and gas products, coal and consumable fuels.

Financials Sector: Companies involved in activities such as banking, consumer finance, investment banking and brokerage, asset management, insurance and investment, and real estate, including REITs.

Industrials Sector: Companies whose businesses manufacture and distribute capital goods, including aerospace and defense, construction, engineering and building products, electrical equipment and industrial machinery. Provide commercial services and supplies, including printing, employment, environmental and office services. Provide transportation services, including airlines, couriers, marine, road and rail, and transportation infrastructure.

Materials Sector: Companies that are engaged in a wide range of commodity-related manufacturing. Included in this sector are companies that manufacture chemicals, construction materials, glass, paper, forest products and related packaging products, metals, minerals and mining companies, including producers of steel.

Information Technology: Companies include those that primarily develop software in various fields such as the Internet, applications, systems and/or database management and companies that provide information technology consulting and services; technology hardware & Equipment, including manufacturers and distributors of communications equipment, computers and peripherals, electronic equipment and related instruments, and semiconductor equipment and products.

Telecommunications Services Sector: Companies that provide communications services primarily through a fixed line, cellular, wireless, high bandwidth and/or fiber-optic cable network.

Utilities Sector: Companies considered electric, gas or water utilities, or companies that operate as independent producers and/or distributors of power.

Earnings per share (EPS) is the portion of a company’s profit allocated to each outstanding share of common stock. EPS serves as an indicator of a company’s profitability. Earnings per share is generally considered to be the single most important variable in determining a share’s price. It is also a major component used to calculate the price-to-earnings valuation ratio.

INDEX DEFINITIONS:
The Standard & Poor’s 500 Index is a capitalization-weighted index of 500 stocks designed to measure
performance of the broad domestic economy through changes in the aggregate market value of 500 stocks
representing all major industries.

This research material has been prepared by LPL Financial.
To the extent you are receiving investment advice from a separately registered independent investment advisor, please note that LPL Financial is not an affiliate of and makes no representation with respect to such entity.

Not FDIC or NCUA/NCUSIF Insured | No Bank or Credit Union Guarantee | May Lose Value | Not Guaranteed by any Government Agency | Not a Bank/Credit Union Deposit

Sandy Clouds the Beige Book
December 4, 2012

Tepid, but Points to Modest Optimism

Heavily influenced by the impact of Superstorm Sandy and the uncertainty generated by the election and fiscal cliff debate, our proprietary Beige Book Barometer (at +30), is down from a recent high in the April 2012 Beige Book (+101). The Barometer is now back down to the levels seen in the summer and fall of 2011, amid the disruptive debt ceiling debate in the United States and the fiscal and financial worries in Europe. Our “Beige Book Barometer,” a diffusion index that measures the number of times the word “strong” or its variations (stronger, strength, strengthen, etc.) appears in the Beige Book less the number of times the word “weak” or its variations (weaken, weaker, etc.) appears, is displayed in Figure 1. The Barometer is an effective, quantitative way to derive the shades between strong and weak in the predominately qualitative, overall report.

Rebuilding and Recovery Likely Ahead

Despite the tepid reading of our Beige Book Barometer, there is some reason for modest optimism. First, the Barometer generally suggested that the economy was stronger heading into the fiscal cliff and Sandy in the summer and fall of 2012 than it was in early 2011, ahead of the debt ceiling debate. Our Barometer averaged just over +60 in the spring and summer of 2012, well above the +40 reading seen, on average, in the first half of 2011. In addition, many of the factors weighing on our Barometer based on the most recent Beige Book appear to be temporary. The base path in our 2013 Outlook suggests that the economy will mostly avoid the fiscal cliff, and that in our view, the resolution of the debate around the fiscal cliff will likely lift some, but not all, of the uncertainty emanating from Washington. In addition, the significant disruption caused to the economy by Sandy that is reflected in the most recent Beige Book is likely to soon give way to rebuilding and recovery, and generate more positive words for our Barometer.

While the fiscal cliff debate and the impact of Sandy may be temporary, though significant, other more persistent factors have weighed on the Barometer since it peaked at +101 in April 2012. The ongoing recession in Europe, the economic slowdown in China, the severe damage to the agricultural economy as a result of the drought, and a return to “normal” weather all helped to push the Beige Book Barometer from +101 in April 2012 to around +50 over the summer of 2012.

Figure 1

Even if the uncertainty surrounding the fiscal cliff and the disruptions caused by Sandy reversed, and our Barometer returned to the +60 range seen over the spring and summer of 2012, it would still remain below the range seen in 2005 and 2006, the years just prior to the Great Recession. In short, the Beige Book Barometer is consistent with other more quantitative metrics on the U.S. economy that suggest that the economy is in recovery, and growing at around 2.0% (as measured by gross domestic product [GDP]) but is still not back to “normal,” where normal is defined as the pre-Great Recession years of 2005 – 2006, where real GDP growth averaged between 2.5% and 3.0%.

Figure 3-1


Figure 3-2


Word Clouds Show Measured Expansion

The nearby word clouds are dominated by words describing the tone of the economy at the time the Beige Books were published. Below are some observations on the current Beige Book (released on November 28, 2012) relative to other recent editions of the Beige Book.

  • The economy is expanding at a measured pace, perhaps just a step down from the modest pace of expansion seen in the prior few Beige Books released over the summer and early fall of 2012.
  • The latest Beige Book was dominated by uncertainty surrounding the fiscal cliff and the damage and disruption wrought by Superstorm Sandy, but nevertheless, described an economy that was growing, but severely impacted by uncertainty (26 mentions), Sandy (48), storm (44), and the fiscal cliff (15).
  • The word “confidence,” which was used 11 times in the September 2011 Beige Book amid the worst of the situation in Europe, appeared just four times in the latest Beige Book. During the summer and fall of 2011, the word confidence appeared an average of eight times in each Beige Book. Increased uncertainty (Sandy, fiscal cliff, and election), rather than lack of economic confidence, seems to best describe the current economic environment on Main Street.
  • The lack of rain and concerns over the drought in the midsection of the United States made another significant appearance in the latest Beige Book. The word “drought” was mentioned 18 times in November 2012, 19 times in October 2012, and 22 times in August 2012. Drought warranted only a handful of mentions in the Beige Book in early 2012. The word “crop” was mentioned 20 times in the November Beige Book, after 26 mentions in October and 22 in August. A look back to the Beige Books of a year ago (July – November 2011) finds that drought was also a concern (mentioned 31 times in those four Beige Books). However, in the last four Beige Books (July – November 2012) the word drought appeared 62 times. Looking ahead, we would expect drought and the damage to crops due to the lack of rain this past summer in the Midwest to continue to impact the Beige Book in the coming months.
  • The financial media is chock full of stories on the economic slowdown in China and the recession and debt crisis in Europe. The Beige Book suggests that while those issues have not entirely disappeared from Main Street’s radar, they are far less of a concern than the media makes them out to be. China was mentioned just twice in the latest Beige Book, up from one mention in each of the past two Beige Books (August 2012, October 2012). The recent peak for mentions of China was six in the January 2012 Beige Book. We continue to expect a soft landing, not a hard landing, in China. Recent data in China has helped to corroborate that view.

Figure 3


  • There were just seven mentions of Europe in the latest Beige Book, down from 12 in October 2012 and 20 in August 2012. Perhaps business and banking contacts on Main Street are not as exposed to Europe as some of the larger businesses and financial institutions on Wall Street that dominate media coverage. But it is also worth noting that the European debt crisis is now entering its fourth year, and Main Street may be getting used to it now.


Beige Book Background

The Beige Book compiles qualitative observations made by community bankers and business owners about economic (labor market, prices, wages, housing, nonresidential construction, tourism, manufacturing) and banking (loan demand, loan quality, lending conditions) conditions in each of the 12 Fed districts (Boston, New York, Philadelphia, Kansas City, etc.). This local color that makes up each Beige Book is compiled by one of the 12 regional Federal Reserve districts on a rotating basis — the report is much more “Main Street” than “Wall Street” focused. It provides an excellent window into economic activity around the nation using plain, everyday language. The report is prepared eight times a year ahead of each of the eight Federal Open Market Committee (FOMC) meetings. The next FOMC meeting is December 11 – 12, 2012.

The previous word clouds or text clouds, which are a visual format useful for quickly perceiving the most important words in a speech, text, report, or other transcript, are culled from the Fed’s Beige Books published last week (November 28, 2012) and the prior month (October 10, 2012). In general, the more often a word appears in a speech, text, report or other transcript, the larger that word appears in the word cloud. The word clouds show the top 50 words for each of the two Beige Books mentioned above. Similar words are grouped together and common words like “the,” “and,” “a,” and “is” are excluded, as are words that appear frequently in all Beige Books (Federal, district, loan, level, activity, sales, conditions, firms, etc.).

Figure 5


Figure 6


IMPORTANT DISCLOSURES

The opinions voiced in this material are for general information only and are not intended to provide specific advice or recommendations for any individual. To determine which investment(s) may be appropriate for you, consult your financial advisor prior to investing. All performance reference is historical and is no guarantee of future results. All indices are unmanaged and cannot be invested into directly.

* Gross Domestic Product (GDP) is the monetary value of all the finished goods and services produced within a country’s borders in a specific time period, though GDP is usually calculated on an annual basis. It includes all of private and public consumption, government outlays, investments and exports less imports that occur within a defined territory.

^ Federal Funds Rate is the interest rate at which depository institutions actively trade balances held at the Federal Reserve, called federal funds, with each other, usually overnight, on an uncollateralized basis.

† Private Sector – the total nonfarm payroll accounts for approximately 80% of the workers who produce the entire gross domestic product of the United States. The nonfarm payroll statistic is reported monthly, on the first Friday of the month, and is used to assist government policy makers and economists determine the current state of the economy and predict future levels of economic activity. It doesn’t include:

  • general government employees
  • private household employees
  • employees of nonprofit organizations that provide assistance to individuals
  • farm employees

The economic forecasts set forth in the presentation may not develop as predicted and there can be no guarantee that strategies promoted will be successful.

Stock investing involves risk including loss of principal.
International investing involves special risks, such as currency fluctuation and political instability, and may not be suitable for all investors.

Quantitative Easing is a government monetary policy occasionally used to increase the money supply by buying government securities or other securities from the market. Quantitative easing increases the money supply by flooding financial institutions with capital in an effort to promote increased lending and liquidity.

The Federal Open Market Committee action known as Operation Twist began in 1961. The intent was to flatten the yield curve in order to promote capital inflows and strengthen the dollar. The Fed utilized open market operations to shorten the maturity of public debt in the open market. The action has subsequently been reexamined in isolation and found to have been more effective than originally thought. As a result of this reappraisal, similar action has been suggested as an alternative to quantitative easing by central banks.

The Federal Open Market Committee (FOMC), a committee within the Federal Reserve System, is charged under the United States law with overseeing the nation’s open market operations (i.e., the Fed’s buying and selling of United States Treasure securities).

INDEX DESCRIPTIONS
Purchasing Managers Index (PMI) is an indicator of the economic health of the manufacturing sector. The PMI index is based on five major indicators: new orders, inventory levels, production, supplier deliveries and the employment environment.

This research material has been prepared by LPL Financial.
To the extent you are receiving investment advice from a separately registered independent investment advisor, please note that LPL Financial is
not an affiliate of and makes no representation with respect to such entity.

Not FDIC/NCUA Insured | Not Bank/Credit Union Guaranteed | May Lose Value | Not Guaranteed by any Government Agency | Not a Bank/Credit Union Deposit