The past weekend marked the end of daylight savings time, and time to set your clocks back, but for the bond market there was no step back in October. The bond market took another step forward during October 2013, with broad-based gains as the recent rebound continued. Future gains may be more limited as investors await further clarity on the economy and the path of the Federal Reserve (Fed) — a process that may take some time and sets up a range-bound environment through year-end.
Bond market returns were led by more credit-sensitive sectors in October such as high-yield bonds, corporate bonds, and preferred securities [Figure 1]. The limited economic data released in October showed an economy with little impact, so far, from the 16-day government shutdown during the month. Relief that a more adverse impact had been avoided for now supported corporate bonds as did good news from earnings reporting season. With just over half of S&P 500 companies having reported, third quarter 2013 S&P 500 earnings are on pace to grow 5% over the prior year, while revenues are 3% higher.

A further reduction in Fed tapering fears was a key catalyst in October bond performance. Market expectations that the Fed may wait longer before reducing the pace of bond purchases increased during October due to the government shutdown. The economic impact of the government shutdown, although negligible so far, may not become fully apparent before the Fed’s December meeting. Furthermore, the continuing resolution that ended the recent government shutdown will expire in mid-January 2014, setting up another potential shutdown that may motivate the Fed to hold off on reducing bond purchases even longer and perhaps until March 2014. Emerging market debt (EMD) is a potential beneficiary of a delayed start to Fed tapering, as Fed bond purchases help foster market liquidity and therefore reduce risks for less liquid market segments such as EMD.
Mixed economic data, in addition to government shutdown implications, also supported October bond strength. The uneven economic data, including a subpar September employment report released on October 22, 2013, led market participants to question whether economic improvement had stalled and if it warranted the Fed to taper bond purchases as soon as this December. Together, the government shutdown and mixed economic data suggested the Fed would maintain the current pace of bond purchases for longer.
Range-Trade
Will the bond market witness a third straight month of gains in November? Gains, if any, are likely to be more limited as we see a range-bound trading environment develop. The rise in bond prices and subsequent decline in yields from September 5, 2013 through the end of October has factored in much of the uncertainty over when the Fed will begin to reduce bond purchases as well as fiscal uncertainty from Washington. More importantly, the bond market has priced in what we believe is a more realistic view of when the Fed may begin to raise interest rates. In our view, the timing of the Fed’s first interest rate hike is much more important to the direction of bond prices and yields than the start of tapering.
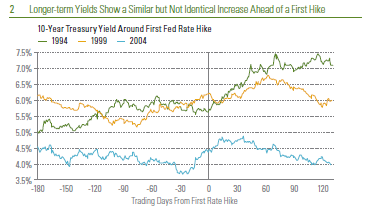
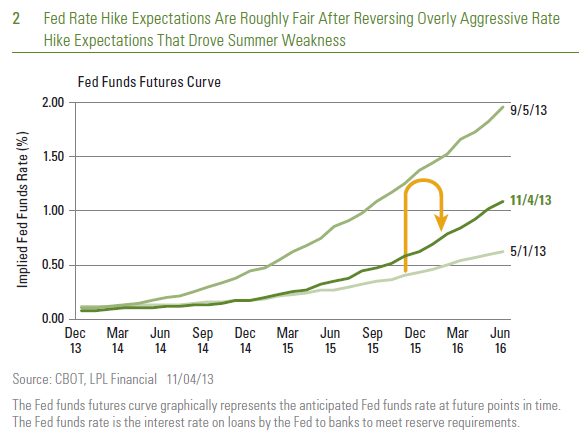
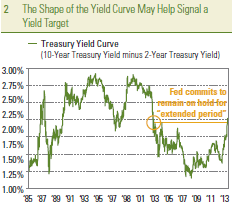
According to fed fund futures, the first interest rate hike is expected by September 2015 — three months beyond the Fed’s current guidance of approximately June 2015. Futures pricing shows the bond market believes the Fed will wait longer to ultimately raise rates. The overly aggressive rate hike fears that led to bond weakness in the spring and summer have been largely reversed, leaving more balanced expectations [Figure 2]. At the same time, a further delay in the timing of a first rate hike, which may push bond yields lower still, seems unlikely absent an additional catalyst.

Furthermore, the decline in yields has reached a key resistance barrier represented by a 2.5% yield on the 10-year Treasury. In the midst of the sell-off in late June and mid-July of this year, the yield on the 10-year Treasury dropped to 2.5% three times but was unable to fall below that level. In late October, the 10-year Treasury yield once again reached this barrier and bounced modestly higher, temporarily at least halting the bond rally [Figure 3].


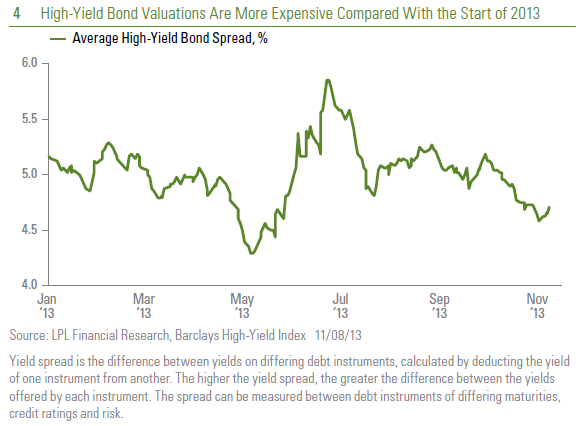
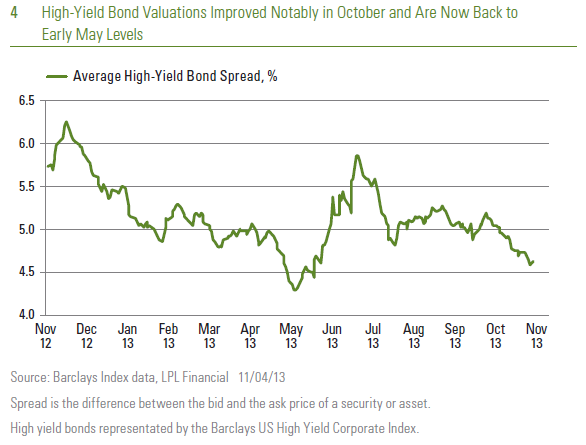
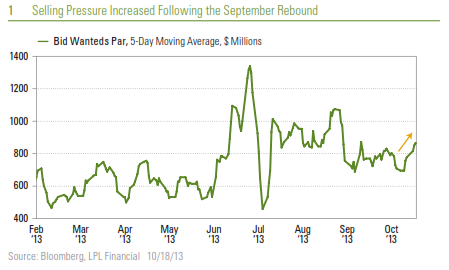
Higher valuations may limit demand from investors and provide another reason that returns are likely to slow. In the high-yield bond market, valuations have improved and are approaching early May levels [Figure 4]. Earnings season has so far confirmed the good fundamentals underlying corporate bond issuers, and defaults are likely to remain isolated, but higher valuations will still restrain additional investment, leaving interest income the primary driver of return.
We believe another catalyst may be needed to take bond prices higher and yields still lower. The modest decline in bond prices and rise in yields to start November shows the bond market does maintain some sensitivity to tapering fears as top-tier economic reports are being released. Signs of weaker economic data, the prospect of a more protracted government shutdown, or more concrete signs the Fed will take even longer to start tapering and/or raise interest rates are likely needed to promote another run higher in bond prices. The government shutdown has delayed the release of multiple economic reports and clouded the interpretation of many others. The Fed’s next meeting is not until mid-December, and the threat of another government shutdown will not be known until early 2014. All three factors will take weeks or perhaps months to assess, and a range-bound trading environment may result.
______________________________________________________________________________________________________________________________
IMPORTANT DISCLOSURES
The opinions voiced in this material are for general information only and are not intended to provide specific advice or recommendations for any individual. To determine which investment(s) may be appropriate for you, consult your financial advisor prior to investing. All performance reference is historical and is no guarantee of future results. All indices are unmanaged and cannot be invested into directly. Unmanaged index returns do not reflect fees, expenses, or sales charges. Index performance is not indicative of the performance of any investment. Past performance is no guarantee of future results.
The economic forecasts set forth in the presentation may not develop as predicted and there can be no guarantee that strategies promoted will be successful.
Yield is the income return on an investment. This refers to the interest or dividends received from a security and is usually expressed annually as a percentage based on the investment’s cost, its current market value or its face value.
Bonds are subject to market and interest rate risk if sold prior to maturity. Bond values and yields will decline as interest rates rise, and bonds are subject to availability and change in price.
Government bonds and Treasury Bills are guaranteed by the U.S. government as to the timely payment of principal and interest and, if held to maturity, offer a fixed rate of return and fixed principal value. However, the value of fund shares is not guaranteed and will fluctuate.
Municipal bonds are subject to availability, price, and to market and interest rate risk if sold prior to maturity. Bond values will decline as interest rate rise. Interest income may be subject to the alternative minimum tax. Federally tax-free but other state and local taxes may apply.
Treasuries are marketable, fixed-interest U.S. government debt securities. Treasury bonds make interest payments semi-annually, and the income that holders receive is only taxed at the federal level.
Corporate bonds are considered higher risk than government bonds but normally offer a higher yield and are subject to market, interest rate and credit risk as well as additional risks based on the quality of issuer coupon rate, price, yield, maturity and redemption features.
Preferred stock investing involves risk, which may include loss of principal.
International and emerging market investing involves special risks such as currency fluctuation and political instability and may not be suitable for all investors.
______________________________________________________________________________________________________________________________
INDEX DESCRIPTIONS
The Barclays Capital Aggregate Bond Index is an unmanaged market capitalization-weighted index of most intermediate-term U.S. traded investment-grade, fixed rate, non-convertible and taxable bond market securities including government agency, corporate, mortgage-backed, and some foreign bonds.
The Barclays Capital High Yield Index covers the universe of publicly issued debt obligations rated below investment-grade. Bonds must be rated below investment-grade or high-yield (Ba1/BB+ or lower), by at least two of the following ratings agencies: Moody’s, S&P, Fitch. Bonds must also have at least one year to maturity, have at least $150 million in par value outstanding, and must be US dollar denominated and non-convertible. Bonds issued by countries designated as emerging markets are excluded.
The Barclays Treasury Index is an unmanaged index of public debt obligations of the U.S. Treasury with a remaining maturity of one year or more. The index does not include T-bills (due to the maturity constraint), zero coupon bonds (Strips), or Treasury Inflation Protected Securities (TIPS).
The Barclays Corporate Index is an unmanaged index of publicly issued U.S. corporate and specified foreign debentures and secured notes that meet the specified maturity, liquidity, and quality requirements. To qualify, bonds must be SEC-registered. The index includes both corporate and non-corporate sectors.
The Barclays U.S. Corporate High Yield Index covers the USD-denominated, non-investment grade, fixed-rate, taxable corporate bond market. Securities are classified as high-yield if the middle rating of Moody’s, Fitch, and S&P is Ba1/BB+/BB+ or below. The index excludes emerging markets debt. The index was created in 1986, with index history backfilled to January 1, 1983. The U.S. Corporate High Yield Index is part of the U.S. Universal and Global High Yield Indices.
J.P. Morgan Emerging Markets Bond Index Global (EMBI Global) tracks total returns for U.S. dollar denominated debt instruments issued by emerging market sovereign and quasi-sovereign entities: Brady bonds, loans, Eurobonds. Currently, the EMBI Global covers 188 instruments across 33 countries.
The Barclays Municipal Bond Index is a market capitalization-weighted index of investment-grade municipal bonds with maturities of at least one year. All indices are unmanaged and include reinvested dividends. One cannot invest directly in an index. Past performance is no guarantee of future results.
The Barclays Capital High Yield Municipal Bond Index is an unmanaged index made up of bonds that are non-investment grade, unrated, or rated below Ba1 by Moody’s Investors Service with a remaining maturity of at least one year.
The Citigroup Non-U.S World Government Bond Index (Un-hedged) is calculated on a market-weighted basis and includes all fixed-rate bonds with a remaining maturity of one year or longer and with amounts outstanding of at least the equivalent of U.S. $25 million. The Index excludes floating or variable rate bonds, securities aimed principally at non-institutional investors and private placement-type securities.
The Citigroup World Government Bond Index is a market-capitalization-weighted index consisting of the government bond markets. Country eligibility is determined based on market capitalization and investability criteria. All issues have a remaining maturity of at least one year.
The Barclays U.S. Treasury TIPS Index is a rules-based, market value-weighted index that tracks inflation protected securities issued by the U.S. Treasury. The U.S. TIPS Index is a subset of the Global Inflation- Linked Index, with a 36.0% market value weight in the index (as of December 2007), but is not eligible for other nominal treasury or aggregate indices. In order to prevent the erosion of purchasing power, TIPS are indexed to the non-seasonally adjusted Consumer Price Index for All Urban Consumers, or the CPI-U (CPI).
The Barclays Mortgage-Backed Securities Index includes 15- and 30-year fixed-rate securities backed by mortgage pools of the Government National Mortgage Association (GNMA), Federal Home Loan Mortgage Corporation (FHLMC), and Federal National Mortgage Association (FNMA).
The Merrill Lynch Preferred Stock Hybrid Securities Index is an unmanaged index consisting of a set of investment-grade, exchange-traded preferred stocks with outstanding market values of at least $50 million that are covered by Merrill Lynch Fixed Income Research. The Index includes certain publicly issued, $25- and $100-par securities with at least one year to maturity.
______________________________________________________________________________________________________________________________
This research material has been prepared by LPL Financial.
To the extent you are receiving investment advice from a separately registered independent investment advisor, please note that LPL Financial is not an affiliate of and makes no representation with respect to such entity.
Not FDIC/NCUA Insured | Not Bank/Credit Union Guaranteed | May Lose Value | Not Guaranteed by any Government Agency | Not a Bank/Credit Union Deposit
Member FINRA/SIPC
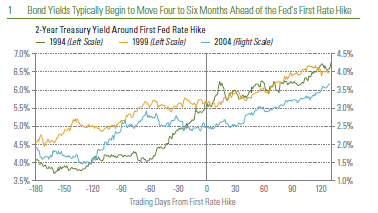 A steadier rise in interest rates occurs once the first rate hike has passed, but in 1994, that steady rise began roughly two months before the first increase. Figure 1 shows the number of trading days, so adding back weekends gets us to calendar days and the four- to six-month period mentioned above.