Archive for the ‘Uncategorized’ Category

High-Yield Bonds & Oil Prices
November 13, 2014

The decline in oil prices and its impact on the high-yield market has been cited as a concern for investors. This week we stay on the topic of highyield bonds and take a closer look at the potential impact of oil prices on the high-yield bond market and whether recent concerns are justified.

Energy’s Growing Presence

Within the high-yield bond market, the energy sector has become a growing component and now comprises slightly more than 15% of the overall Barclays High Yield Bond Index [Figure 1]. Energy is the second largest subsector within the high-yield index and its influence on the broader highyield market has increased. However, it is one of four sectors that comprise more than 10% of the broader high-yield index — and one reason why energy’s impact should not be overstated.

Figure_1

Prior Oil Declines

A look back at prior periods of sharp oil price declines shows that they coincide with pullbacks in the high-yield bond market [Figure 2]. A simple glance at Figure 2 would seemingly lead to the conclusion that falling oil prices lead to high-yield bond market declines. But declines in oil prices have come with growth scares, where investors fear that global economic growth may be slowing dramatically, possibly flirting with recession, and that demand for oil will be reduced. All three periods shown in Figure 2 have coincided with growth scares, and Europe has been the focal driver of each.

Figure_2

We would argue the cause of weakness in these cases has primarily been economic concerns with lower oil prices a result of growth fears and not necessarily a driver. As an example, the energy subsector proved more resilient than the broader high-yield market in 2011, suggesting oil price declines were not a concern even though oil fell to just under $80/barrel, very close to current levels.

Shale Oil Profitability

The sharp drop in oil prices since the end of June 2014 has sparked profitability fears for companies involved in the shale oil boom. At near $80/ barrel, the price of oil is viewed as a potential threat to shale oil producers, whose costs to extract oil are much higher compared with traditional oil drillers. But trying to assess an accurate “break-even” price for oil at which shale oil producers are profitable is complicated. Extraction costs vary from area to area and well to well. Shale companies have nonetheless witnessed their costs decline as drilling techniques and technology improve. Monthly drilling reports available from the U.S. Energy Information Administration (EIA) reveal production per oil rig is up 30%, or more, in most areas over the past year. Greater efficiency means a lower break-even point. Additionally, oil rig counts have increased monthly, suggesting the drop in oil prices has yet to have an impact.

Fretting over oil company profitability seems premature at this stage. In addition to productivity gains, many oil projects are long-term in nature and price fluctuations are anticipated. Companies with a longer-term view may even hedge against the risk of oil prices dropping too far via oil futures.

Low Correlation

Our analysis reveals that the longer-term codependency of oil prices and high-yield bonds is limited. Over the past 10 years, the correlation between high-yield bond returns and oil prices is 43%, a relatively weak reading and lower than the 50% correlation of high-yield bonds and the stock market, as measured by the broad S&P 500 Index. This correlation suggests that weaker oil prices may be a headwind for the high-yield bond market but not a major risk, and much of that impact may be simply due to growth scares rather than true profitability challenges to oil companies.

Default rates, the pace of economic growth, and the strength of credit quality metrics among high-yield issuers — not oil prices — will be the primary drivers of high-yield bond market returns. It is no surprise that the high-yield energy subsector maintains the highest correlation with the broader high-yield market. The path of the broader high-yield market best explains fluctuations in
the high-yield energy subsector and not the other way around.

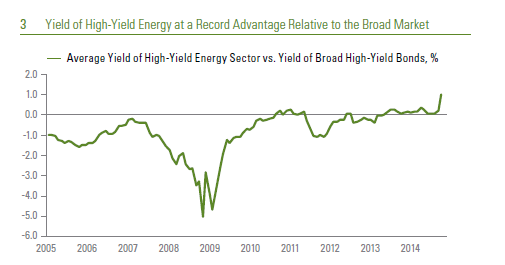
Recent high-yield energy sector underperformance has led to wider yield differentials [Figure 3]. The average yield of the high-yield energy sector is roughly 1% greater than that of the broad high-yield market. The yield disparity contrasts sharply to the yield deficit at the peak of the financial much less than the broad market. The price of oil dropped to $40 barrel in late 2008 — a time when the shale oil industry was less efficient — yet profitability concerns were not an issue for market participants. To be sure, 2008 presented different risks, but the inconsistent behavior suggests the market may be overreacting to the price of oil on the ability of high-yield energy companies to service debt obligations.

Figure_3

Despite all the fears of lower oil prices, the broad high-yield bond market still returned 1.2% in October 2014 as global growth fears subsided, in contrast to an 11.7% drop in oil prices. We believe it is premature to view the drop in oil prices as a threat to the broad high-yield bond market. The high-yield divergence continued last week as stocks made new record highs while high-yield bonds were down slightly (please see Bond Market Perspectives, “High-Yield Divergence,” November 4, 2014). A seasonal surge in new issuance, the winding down of earnings reporting season, and the postponement of early October issuance have all been factors weighing on the high-yield bond market. The issuance surge, rather than the price of oil, has been a primary influence of high-yield bond performance over the past two weeks. We find it premature to draw conclusions about oil prices and the performance of the broad high-yield bond market.


IMPORTANT DISCLOSURES

The opinions voiced in this material are for general information only and are not intended to provide or be construed as providing specific investment advice or recommendations for any individual. All performance referenced is historical and is no guarantee of future results. All indices are unmanaged and cannot be invested into directly. The fast price swings of commodities will result in significant volatility in an investor’s holdings. International investing involves special risks such as currency fluctuation and political instability and may not be suitable for all investors.

Not FDIC/NCUA Insured | Not Bank/Credit Union Guaranteed | May Lose Value | Not Guaranteed by any Government Agency | Not a Bank/Credit Union Deposit

Member FINRA/SIPC

Recovery Reality
October 28, 2014

This week, the U.S. Department of Commerce will provide the markets and the public with the first look at the health of the economy in the third quarter of 2014, when it releases the figures on gross domestic product (GDP). The consensus of economists, as polled by Bloomberg News, expects that the U.S. economy expanded at a 3% annualized rate in the quarter, after posting a 4.6% increase in the second quarter, which in turn, was a rebound from the weather-impacted 2.1% drop in GDP in the first quarter of 2014. Although the Great Recession ended in the middle of 2009, and the U.S. economy (as measured by GDP) surpassed its pre-Great Recession peak in late 2011, many Americans still don’t feel comfortable about the economy. In a recent Gallup poll, nearly 40% of Americans listed one or more concerns about the economy as the most important problem facing the United States.  While the latest reading is still far below the nearly 90% of Americans who listed economic issues as the biggest problem facing the United States in early 2009 (during the depths of the Great Recession), the 40% reading is still well above the “normal” level of around 20 – 25% seen in the mid-2000s.

Our view remains that the U.S. economy is in the middle stages of a recovery that began in mid-2009. Based on the data, the odds of a recession occurring in the next several years are low, as the slow pace of the recovery thus far has prevented the excesses that typically precede a recession — overbuilding, overspending, overinvesting, etc. — from building up. But the slow pace of the recovery — especially the labor market, and in particular wage growth — has contributed to the feeling among a large percentage of Americans that the economy is not where it should be at this stage in the business cycle.

The following figures provide a somewhat alternate look at the economy over the past several years. Without citing any of the usual government reported statistics (GDP, jobs report, retail sales, industrial production, durable goods orders, etc.), these figures on economic uncertainty, crane rental rates, and restaurant customer traffic tell a story that is remarkably similar to the one told by the official data on the economy: The economy is improving, and in many cases is back to normal, but in some areas remains stubbornly weak.

The Economic Policy Uncertainty Index is compiled by researchers at Stanford University and the University of Chicago, and it measures mentions of economic policy uncertainty in over 1,000 newspapers across the  country [Figure 1]. While investors have plenty to worry about today, the index is currently near 20-year lows, despite fears of Ebola and worries about the Islamic State militants, Ukraine, and a global growth slowdown in Europe, China, and elsewhere. Earlier spikes in the Economic Policy Uncertainty Index included:

  • 2008 and 2009, due to the Great Recession and the rancor over the fiscal stimulus, the Federal Reserve’s (Fed) quantitative easing (QE) program, the auto sector bailout, and the Troubled Asset Relief Program (TARP) 2010, around the debate and passage of the Affordable Care Act
  • 2011, around the debt ceiling debacle and the downgrade of U.S. government debt by Standard & Poor’s
  • 2012 and 2013, around the fiscal cliff, government shutdown, and the sequester

Figure_1

In short, economic uncertainty — likely a drag on economic growth in 2011, 2012, and 2013 — has faded as a concern in 2014, consistent with the Fed’s most recent Beige Book. (See last week’s Weekly Economic Commentary, “Beige Book: Window on Main Street.”) The crane rental rates in Figure 2 are collected by Rouse Asset Services sites around the country. Rates are up by nearly 25% since early 2011 (the earliest data we have available), and a quick look around any major metropolitan area around the country should tell you why. The rise of giant construction cranes across the country, after a long absence, is a very visible sign of the recovery in the economy. Although business spending on structures — the area of the economy that is most closely tied to crane rental rates — is not yet back to pre-Great Recession peaks, this segment of GDP typically lags the overall economy. Uncertainty around the durability of the recovery in the early years of this decade led to pent-up demand among businesses for new and expanded space, which has given rise to an uptick in activity at commercial building sites. Low rates to finance all the spending — partially as a result of the Fed’s actions — have helped. We continue to expect that business capital spending on structures may be a positive contributor to overall GDP growth in the coming quarters.

Figure_2

The data on customer traffic in restaurants, compiled by the National Restaurant Association, show that customer traffic in restaurants across the country is very close to being back to normal, after struggling in the early part of the recovery (2009 and 2010) and again around the fiscal issues in 2011 and 2012 [Figure 3]. While not quite back to the levels seen in 2004 – 2007, customer traffic in restaurants is on the upswing, and anyone who has been out to dinner on a weekend night lately knows that translates into long wait times for tables. A better housing market, the improved labor market, pent-up demand from earlier in the recovery, and the discipline to not overbuild restaurants in the prior cycle have led to the recent increase in customer traffic.

Figure_3

Although there are other “real world” indicators on the health of the U.S. economy (we promise to bring you more in forthcoming editions of the Weekly Economic Commentary), the three discussed here are indicative of the health of the U.S. economy more than five years into the economic expansion that began in mid-2009. It’s in recovery, but a slow recovery, and not quite “back to normal.” We hope you are not reading this while waiting for a table at your favorite restaurant!


IMPORTANT DISCLOSURES

The opinions voiced in this material are for general information only and are not intended to provide or be construed as providing specific investment advice or recommendations for any individual. All performance referenced is historical and is no guarantee of future results. All indices are unmanaged and cannot be invested into directly. The fast price swings of commodities will result in significant volatility in an investor’s holdings. International investing involves special risks such as currency fluctuation and political instability and may not be suitable for all investors.

Not FDIC/NCUA Insured | Not Bank/Credit Union Guaranteed | May Lose Value | Not Guaranteed by any Government Agency | Not a Bank/Credit Union Deposit

Member FINRA/SIPC

Blasé on the Budget
October 7, 2014

The U.S. Treasury will report the federal budget figures for fiscal year (FY) 2014, which ended on September 30, 2014, as soon as this week (October 6 – 10, 2014). According to a recent report by the nonpartisan Congressional Budget Office (CBO), the United States will likely run a $506 billion deficit in FY 2014, a $170 billion improvement from the $676 billion deficit racked up in FY 2013. As a percent of nominal gross domestic product (GDP), the deficit in FY 2014 is expected to be 2.9%, down from 4.1% in FY 2013, leaving the public debt-to-GDP ratio — a key metric for global financial markets to assess the creditworthiness of a country — at 74% [Figure 1].

Figure_1_001

As recently as 2009, the federal deficit clocked in at $1.4 trillion, or nearly 10% of GDP, so the nation’s fiscal situation has improved dramatically in the past five years thanks to an improved economy and a combination of higher tax rates and limited spending increases driven by Congressional actions like the sequester and the fiscal cliff [Figure 2]. Some “one-time” items (e.g., Troubled Asset Relief Program [TARP], accounting related to Fannie Mae and Freddie Mac) also helped to reduce the deficit. But because the deficit — and the borrowing to finance the deficit — have increased faster than the overall economy, the debt-to-GDP ratio has deteriorated from around 50% in 2009 to 74% today.

Figure_3

Deficit Deterioration

Looking ahead, the CBO expects (and we concur) that the deficit will shrink, and by late this decade will decline to around 2.7% of GDP, which would be the lowest deficit-to-GDP reading since 2007, prior to the onset of the Great Recession. At that point, the debt-to-GDP ratio will be little changed from the FY 2014 reading of around 74%. But, beginning in the last few years of this decade and into the first half of the 2020s, the CBO expects the deficit will begin to widen again. And by 2024, the expected deficit will hit $960 billion, or 3.6% of GDP, pushing the all-important public debt-to-GDP ratio to over 77% of GDP. The improvement in the deficit in the next several years is expected to be driven by an improving economy and the spending constraints put in place by Congress over the past several years.

Written Warnings

Some warning signs exist in the otherwise positive budget picture that has developed over the past five fiscal years. If policymakers continue to ignore these warning signs, the near-term improvement in the budget picture is not likely to last, as noted above. In FY 2014 to date (October 2013 through August 2014), federal spending on mandatory programs (payments set by formulas written into the law), like Social Security, Medicare, and Medicaid, is running above the pace of nominal GDP growth (4.2% in the four quarters ending in Q2 2014). Federal spending on Social Security benefits is up 4.6%, whereas spending on Medicare and Medicaid are up a combined 4.2%, equal to the pace of nominal GDP growth. Most of the deficit deterioration in the latter half of this decade and the first half of the next decade will occur as a result of deterioration in the structural deficit, i.e., spending on mandatory programs like Social Security, Medicare, and Medicaid far outstripping the pace of GDP growth, mainly due to an aging population. The CBO projects that tax receipts targeted for use by those programs will only grow at the same pace as the overall economy over the next 10 years or so. Thus, the risk is that Congress and the general public will be distracted by the rapidly improving near-term budget outlook and will not address the longer-term structural budget problem quickly enough to head off a worsening long-term budget deficit.

The good news on the budget is that the deficit, debt, and the pace of federal spending are not on the market’s radar screen right now. The stable debtto-GDP ratio over the remainder of the decade (forecast by the CBO) also provides a window for action to be taken by Congress to fix the underlying structural problems in the budget, which have been masked — and indeed overwhelmed — by the improving economy and the near-term spending constraints imposed by Congress on the nondefense discretionary portion of the budget. Any Congressional action to address these underlying issues in the budget are unlikely until after the 2016 presidential elections, but recent history suggests that Congress likely won’t act until a crisis is already underway. The  biggest risk on the federal debt is that the recent improvement in the deficit (and relative stability in the debt-to-GDP ratio) allows complacency to set in among policymakers in Washington.

The structural and demographic problems that will drive the deficit over the next several decades remain in place, and the longer policymakers wait to address the problems, the more difficult (and painful) it becomes to address the problems later on.


IMPORTANT DISCLOSURES

The opinions voiced in this material are for general information only and are not intended to provide or be construed as providing specific investment advice or recommendations for any individual. All performance referenced is historical and is no guarantee of future results. All indices are unmanaged and cannot be invested into directly. The fast price swings of commodities will result in significant volatility in an investor’s holdings. International investing involves special risks such as currency fluctuation and political instability and may not be suitable for all investors.

Not FDIC/NCUA Insured | Not Bank/Credit Union Guaranteed | May Lose Value | Not Guaranteed by any Government Agency | Not a Bank/Credit Union Deposit

Member FINRA/SIPC

The State of States
September 30, 2014

This week marks the start of fall with the autumnal equinox. In coming weeks, nighttime hours will gradually surpass daytime hours throughout the United States. Similar to the shift in the number of daytime and nighttime hours, state revenues have evened in recent months and the upside surprises of recent years are fading.

After several years of growth, state tax revenues are slowing. The Nelson A. Rockefeller Institute of Government reported that overall state tax revenues declined by 0.3% during the first quarter of 2014, and a preliminary reading for the second quarter 2014 shows tax revenues are on track to decline by 0.8%. A drop in personal income taxes drove declines while sales taxes and corporate income taxes, the two other major drivers of state tax revenue, continued to increase. A spike in tax collections in 2013,  following an increase in tax rates, is the main driver of slowing personal income taxes as it makes year-over-year comparisons more challenging. The surge in 2013’s revenue gains was unlikely to be sustained.

It is not uncommon for revenues to slow as the economy matures and we do not view the slowdown in state tax revenues as worrisome for municipal bond investors. Withholding taxes, a more current gauge of the trajectory in revenues, increased 5.6% during the first quarter of 2014 with 37 states showing gains and only four showing declines. Personal income taxes consist of both income and investment taxes and therefore can fluctuate depending on strength in the stock market.

Measuring withholding taxes can therefore provide a clearer picture of the underlying trend in personal income tax revenues. For the first three quarters of fiscal year 2014 (which began on July 1, 2013), revenues have increased 2.8%. We would have to witness much sharper revenue declines before default risk may become a factor again in the municipal bond market.

California, New Jersey, and Illinois

For the new 2015 fiscal year that began July 1, 2014, the flat overall revenue trend appears to be continuing based upon a small subset of sampling. Revenues have been a mixed bag with states such as Idaho, Indiana, Vermont, Wisconsin, New Jersey, Florida, Minnesota, Arizona, and Virginia slightly lagging budget forecasts, while California, Maine, Missouri, and Washington have been modestly exceeding forecasts.

Among notable state progress, California’s revenues continue to improve while New Jersey and Illinois face challenges. California state general obligation (GO) debt was upgraded to Aa3 in June 2014 by Moody’s as a reflection of the better revenue picture and followed upgrades by both Standard & Poor’s (S&P) and Fitch in 2013. Conversely, New Jersey state GO debt has been downgraded more than once in 2014 and most recently here in September by both S&P and Fitch, as revenues disappoint and the state’s pension burden continues to grow. Illinois not only has the lowest pension funding level among states but also faces a decline in revenue as a temporary increase in tax rates, which helped boost Illinois debt back in 2011, is set to expire at the end of 2014 and revert back to lower rates — a negative for bond holders. While Illinois state GO debt trades at a notable
yield premium to the average AAA-bond yield, New Jersey debt yields are relatively narrow to the AAA average and yield differentials may widen to compensate for risks. Meanwhile, California has seen its bonds outperform
as yield differentials narrow.

A Change in Season for Supply

Slowing revenue growth is likely to increase the chance the low supply environment of 2014 will persist, but a seasonal increase is currently underway. As is typically the case, the start of fall ushers in a period of increased issuance [Figure 1]. New bond issuance has been very low in 2014 but has still tracked the pattern of the recent five years. Each of these years has held very close to the seasonal pattern with some slight variation. In 2010, issuance was well above average and, along with credit quality fears, sparked a subsequent year-end sell-off, while 2013 fall issuance was slow to get going due to the taper tantrum sell-off and lingering market caution.

Figure_1_001

At $11.3 billion, forward issuance remains well above the $8.2 billion weekly average of the past five years and may slow municipal performance. Municipal bonds outperformed Treasuries during a two-week bond market
downturn to start September. Although bond prices rebounded slightly last week, the combination of lower yields and higher valuations may slow, or  reverse, the advance of municipal bonds.

Municipal-to-Treasury yield ratios are near their most expensive indications of the year [Figure 2]. We do not expect a repeat of the 2013 sell-off, but after a strong start to 2014, the combination of lower yields, higher valuations, and a seasonal increase in supply may drive much lower returns. Returns may gravitate closer to the negative 0.3% return of the Barclays Municipal Bond Index witnessed from August 29, 2014 through September 19, 2014 than the 7.5% witnessed year-to-date through the end of August 2014.

Figure_2

Once the seasonal supply surge fades, slower state revenue growth and still tight local government budgets suggest that new issuance may remain subdued over the longer term. Therefore, lower issuance may lead to still higher valuations for municipal bonds as supply remains constrained. Data from the Federal Reserve released last week showed the municipal market shrank by 0.2% during the second quarter of 2014, continuing a trend that began in 2010. However, over the near term higher valuations may present a challenge in the face of a seasonal supply increase. A change of seasons should be noted by municipal investors, as a seasonal increase in new issuance may be a catalyst to lower returns after a strong 2014.


IMPORTANT DISCLOSURES

The opinions voiced in this material are for general information only and are not intended to provide or be construed as providing specific investment advice or recommendations for any individual. All performance referenced is historical and is no guarantee of future results. All indices are unmanaged and cannot be invested into directly. The fast price swings of commodities will result in significant volatility in an investor’s holdings. International investing involves special risks such as currency fluctuation and political instability and may not be suitable for all investors.

Not FDIC/NCUA Insured | Not Bank/Credit Union Guaranteed | May Lose Value | Not Guaranteed by any Government Agency | Not a Bank/Credit Union Deposit

Member FINRA/SIPC


Current Conditions Index
September 23, 2014

Over the past week, the LPL Financial Current Conditions Index (CCI) fell nine points, but it remains in the range of recent post recession highs. Despite the pullback, the level of the CCI remains consistent with the recent spring bounce, signaling the U.S. economy may be emerging from the modest, but steady, economic growth of recent years.

Figure_1

During the last week, the index’s decline was driven by retail sales, shipping traffic, and the VIX (a measure of stock market volatility), while mortgage activity saw the most improvement.

Figure_2

Figure_3

Figure_4


IMPORTANT DISCLOSURES

The opinions voiced in this material are for general information only and are not intended to provide or be construed as providing specific investment advice or recommendations for any individual. All performance referenced is historical and is no guarantee of future results. All indices are unmanaged and cannot be invested into directly. The fast price swings of commodities will result in significant volatility in an investor’s holdings. International investing involves special risks such as currency fluctuation and political instability and may not be suitable for all investors.

Not FDIC/NCUA Insured | Not Bank/Credit Union Guaranteed | May Lose Value | Not Guaranteed by any Government Agency | Not a Bank/Credit Union Deposit

Member FINRA/SIPC


Fall FOMC Watch
September 16, 2014

On Tuesday, September 16 and Wednesday, September 17, 2014, the Federal Reserve (Fed) will hold the sixth of its eight Federal Open Market Committee (FOMC) meetings of the year. This meeting will include a press conference by Fed Chair Janet Yellen and FOMC members’ forecasts for the economy, the timing of the first fed funds rate hike, and the level of the fed funds rate at the end of 2014, 2015, 2016, 2017, and in the long run. In recent years, markets have been conditioned to expect a greater possibility of policy changes at meetings accompanied by press conferences and new forecasts and, as a result, market participants have increased their odds that the Fed will change “something” at this meeting.

Although we continue to expect the Fed will again cut the pace of its bond purchase program (quantitative easing or QE) and remain on pace to exit QE by the fourth quarter of 2014, the odds have increased in recent weeks that the Fed will take some additional action. Arranged from most likely to least likely (in our view), at this week’s meeting the Fed could:

Move to a more “data-dependent” rather than a “time-dependent” promise to keep rates low. Yellen and most other Fed officials have gone out of their way to remind the public that the Fed’s QE program and the extraordinarily low rates are “data dependent,” and yet the FOMC statement continues to hinge on that “considerable time,” or time-based guidance. A subtle shift away from time-based to data-based rate guidance could be one outcome of this week’s meeting.

Change the bar and “dot plot.” At one of her press conferences earlier this year, Fed Chair Yellen referred to the FOMC members’ forecasts of the first rate hike and fed funds rate levels at year end 2014, 2015, 2016, and in the long term as the “dot plots.” To be clear, the timing of the first rate hike appears on a bar chart, while the forecasts for the level of the fed funds rate at year end are found in the dot plots. At the June 2014 meeting, 12 FOMC members said 2015 was the first hike, while one said 2014, and three said 2016. The bar and dot charts are likely to include 2017 this time. The June 2014 dot plots placed the fed funds rate at current levels at the end of 2014, 1.13% at the end of 2015, and 2.50% at the end of 2016. After identifying them as such, Yellen immediately told the public to not pay any attention to them, but of course financial markets and the financial media can’t seem to resist. Given the recent data — and public pronouncements of FOMC officials on when they thought the first rate hike should occur — there is likely to be some movement toward a rate hike sooner rather than later and a higher end point for fed funds in both the bar and dot plots this time around.

Drop the “significant underutilization of labor resources” language from the FOMC statement. This language was inserted into the statement released after the July 29 – 30, 2014, FOMC meeting and was likely designed to focus the market’s attention away from the headline labor market indicators — such as the unemployment rate and the nonfarm payroll job count — and on the broader set of labor market indicators often cited by Fed Chair Yellen and Fed staffers. Although several of the Yellen indicators have indeed improved since the July 2014 FOMC meeting, the majority of the Yellen indicators still suggest that the broad labor market is not back to normal. Our view is that although this description is unlikely to be dropped altogether, it could be softened a bit to reflect the ongoing — albeit slow — improvement in the labor market.

Omit from the FOMC statement the promise to keep rates low for a “considerable time” after QE ends. This is a close call. The recent run of better-than-expected economic data for the second and third quarters  of 2014, along with recent comments from Fed officials (both hawks and doves), support this view, but the sudden shift in policy implied in omitting these words seems out of line with the Fed’s recent gradualist approach.

Provide the public with an update to its “exit strategy,” first outlined in 2011. In our view, the sooner the Fed does this the better it will be in the long run. However, our read of recent comments from Fed officials, the June and July 2014 FOMC statements, and the minutes of the July 29 – 30 FOMC meeting suggest the FOMC subcommittee that was set up to review the exit strategy most likely has not had enough time to complete its task. With the next FOMC meeting (October 28 – 29, 2014) not scheduled to have a Yellen press conference or a new forecast, the final FOMC meeting of 2014 (December 16 – 17) is the likely date for the Fed to announce the long-awaited update to its exit strategy. If the Fed were to announce that a press conference would accompany the October FOMC, that would likely signal to the markets that the Fed was preparing to announce its exit
strategy in October.

Figure_1

The one common thread to the potential changes from the Fed is how the economy is tracking to the Fed’s forecast, and when all of the slack in the economy — as measured by the output gap [Figure 1] — will be taken up. If the economy (as measured by growth in inflation-adjusted gross domestic product [GDP]) continues to grow at around 4% as it has, on average, in the economy — as measured by the output gap [Figure 1] — will be taken up. If the economy (as measured by growth in inflation-adjusted gross domestic product [GDP]) continues to grow at around 4% as it has, on average, in the second and third quarters of 2014, the output gap is likely to close much more quickly than the Fed now assumes, and the Fed will likely be raising rates in the early part of 2015. If GDP decelerates in 2015 and 2016 to the 3% pace forecast by the FOMC, the Fed is likely to begin hiking rates later in 2015 — perhaps in Q3 or Q4. If, however, the economy returns to the below average 2% pace of growth seen in 2011 – 2013, the Fed could be on hold until late 2015 or early 2016. We are continuing to watch our Yellen indicators, including the unemployment rate, the job quit rate, and the output gap, to gain insight in whether the Fed will raise rates sooner than expected.


IMPORTANT DISCLOSURES

The opinions voiced in this material are for general information only and are not intended to provide or be construed as providing specific investment advice or recommendations for any individual. All performance referenced is historical and is no guarantee of future results. All indices are unmanaged and cannot be invested into directly. The fast price swings of commodities will result in significant volatility in an investor’s holdings. International investing involves special risks such as currency fluctuation and political instability and may not be suitable for all investors.

Not FDIC/NCUA Insured | Not Bank/Credit Union Guaranteed | May Lose Value | Not Guaranteed by any Government Agency | Not a Bank/Credit Union Deposit

Member FINRA/SIPC

Midterms May Mean More Gains for Stocks
September 9, 2014

With the midterm elections now just two months away and campaigning starting to heat up, we thought we would share our current views on the political landscape and what it may mean for U.S equities. In our two Outlook 2014 publications for this year, we posited that the U.S. economy and corporate profits may drive the stock market higher and investors could turn their attention away from policymakers in Washington, who were such a distraction in 2013 and earlier in the current economic expansion.

We continue to see opportunities for further stock market gains over the course of 2014, as discussed in our Mid-Year Outlook 2014: Investor’s Almanac Field Notes, based upon fundamentals rather than the potential for sweeping legislative change. Although our analysis of stock market performance around midterm elections is very supportive of our positive stock market outlook, it is not a key driver of that outlook.

This Election’s Impact May Be Smaller Than Usual

We do not expect politics to have a big impact on the stock market this fall for two reasons:

  • There is not much uncertainty for the elections to remove. Markets hate the uncertainty that changes in Washington’s political landscape tend to bring. But there is no debt limit debate until March 2015 or spending cuts that need to be addressed over the near term as in recent years.
  • Divided government will likely persist no matter the election outcome. Neither party is likely to gain a distinct advantage. We (and the consensus) fully expect that the election will leave us with a still divided government. Major policy initiatives such as tax reform or entitlement reform (as necessary as they may be) are unlikely to get done by the next Congress regardless of midterm election results.

It is highly likely that Republicans will maintain control of the House, where they currently hold a sizable majority that may widen. In the Senate, professional political forecasters and our contacts in Washington put the odds that Republicans regain control at between 60% and 70%.

The Senate Battle

To win the Senate, Republicans would need to win six of the 21 contested seats currently held by Democrats (assuming incumbent Republicans hold on to their 15 contested seats). If so divided government in Washington would persist for at least two more years, with a Democratic president and Republican Congress until the 2016 presidential election. Several of the contested seats currently being held by Democrats are in traditionally Republican-leaning (so-called red) states, which, along with fewer seats to defend, redistricting, and the latest polls, suggest Republican control of the House and Senate in 2015 – 2016 is more likely than not.

If the Republicans do not take control of the Senate, then a divided and gridlocked Congress returns. Although Washington is probably more likely to get some things done with Congress entirely under Republican control, especially as the Obama Administration moves more into legacy-building mode, major market-moving reforms are unlikely in either scenario.

This Doesn’t Mean Nothing Will Get Done

This outcome doesn’t mean policy is irrelevant and that nothing will get done in Washington over the next two years. A continuing resolution this fall will be needed to fund the government until after the 2014 elections. This may begin to turn the market’s attention to the next debt ceiling deadline in March 2015, which could have some political brinksmanship attached to it, although a default is very difficult to envision. We do not believe the Republicans have the appetite for another budget standoff that could result in another government shutdown or, worse, default. In addition, there appears to be bipartisan support for changes to energy policy that could come in 2015, regardless of the makeup of Congress. Infrastructure, immigration, and housing finance reform are also areas of potential compromise.

Stocks Embrace Midterm Elections

Though not a key piece of our positive outlook for the S&P 500, stocks seem to love midterm elections. Since World War II, the market’s reaction to midterm elections has almost always been positive, even when the balance of power has shifted in one or both houses of Congress — as would happen this year if the Republicans take the Senate. As shown in Figure 1, the fourth quarter in any year has been a good time to own stocks, but the fourth quarter during midterm election years — the quarter that begins on October 1, 2014 — has historically been a really good time to own stocks.  In fact, 14 of the last 16 fourth quarters during midterm election years have seen the S&P 500 Index move higher, by an average of 8%.

Figure_1

A change in control has not changed this dynamic. In four of the five years that midterm elections resulted in a change in power (1954, when Democrats took the House; 1986, when Democrats took the Senate; 2002, when Republicans took the Senate; and 2006, when Democrats took the House and Senate), fourth quarter returns were positive, much like those in midterm election years when no change in power took place. Interestingly, in the only two midterm election years since World War II during which U.S. equities did not experience a fourth quarter rally (1978 and 1994), the Federal Reserve (Fed) was aggressively hiking interest rates.

Figure_2

  • In 1978, the lead-up to the Islamic Revolution resulted in strikes and unrest in Iran. In November 1978, a strike by Iranian oil workers reduced production from 6 million barrels per day to about 1.5 million barrels. At the same time, foreign oil workers fled the country. In the United States, inflation hit 9% in the fourth quarter of 1978 with no signs of slowing down as it approached double digits. In response to surging inflation, the Fed was aggressively hiking rates, with a total increase of 1.25% in the fourth quarter alone, pushing the policy rate up to 10%.
  • In 1994, the S&P 500 turned in a roughly flat fourth quarter on the heels of a shift in power to the Republicans. However, the performance was less of a reaction to the election results than to rising fears of recession amid the Fed’s aggressive hiking of short-term interest rates and a corresponding run-up in long-term interest rates (to nearly 8% from below 6% at the start of the year). Although the Fed is currently withdrawing stimulus by phasing out quantitative easing (QE), we do not expect the Fed to raise interest rates until well into 2015. As a result, we do not expect the Fed to disrupt the stock market during the fourth quarter as it did during the fourth quarters of 1978 and 1994.

Bottom line, the resolution of election uncertainty — and ending the predominantly negative rhetoric surrounding the campaign — has historically been a positive for the stock market and may help the S&P 500 reach new highs during the final stretch of 2014. And ending uncertainty seems to matter more to investors than the actual election results.

Bond Yields Around a First Rate Hike
September 2, 2014

Last week’s Federal Reserve (Fed) news was a reminder that the Fed remains on course to raise interest rates about one year from now. The release of minutes from the July 29 – 30, 2014, Fed meeting and Fed Chair Janet Yellen’s remarks at the Fed’s annual Jackson Hole Symposium were less market friendly than anticipated. The double dose of new information from the Fed was a modest disappointment for bond investors who expected a more market-friendly tone. Bond markets remain mispriced for an eventual Fed rate hike, and last week’s rise in high-quality bond yields was a reminder of the interest rate risk facing bond investors.

A rate hike remains about one year away, according to both Fed guidance and interest rate futures markets, but it still raises the question of when bond markets will move forcefully in response to Fed interest rate hikes. Yields have declined for most bonds, year-to-date, but expectations for higher interest rates have not wavered.

When Will Rates Rise?

So when will bond yields really move in response to Fed rate hikes? Over the last 20 years, bond yields began to increase approximately four to six months ahead of the Fed’s first interest rate increase [Figure 1]. The 2-year Treasury note is among the most sensitive to Fed changes to the fed funds target rate and therefore is a useful guide to market reaction.

Figure_1A steadier rise in interest rates occurs once the first rate hike has passed, but in 1994, that steady rise began roughly two months before the first increase. Figure 1 shows the number of trading days, so adding back weekends gets us to calendar days and the four- to six-month period mentioned above.

The reaction among longer-term bonds, such as the 10-year Treasury, is similar but not identical. In 1994, the reaction in the 10-year yield came closer to three months prior to the Fed’s first rate hike, while in 1999 and 2004, the reaction came similarly four to six months before [Figure 2]. Like the 2-year yield, the rise in the 10-year yield was steadier just after the first rate increase in 1994 and 1999, but in 2004, a 1.0% rise in the 10- year yield was constrained to a period just before and after the first rate hike.

Figure_2

In 2004, the 10-year Treasury yield began to decline again despite ongoing Fed rate hikes leading a befuddled Alan Greenspan to famously label it a “conundrum.” Intermediate and long Treasury yields, however, resumed their rise in 2005, in response to continued Fed interest rate hikes before peaking in 2006.

Another takeaway from Figure 2 is that the rise in 10-year yields was more limited in time span. In 1999 and 2004, the 10-year yield peaked within one to three months after the first rate increase — a reminder that longer-term bonds are less influenced by the Fed and more by economic growth and inflation expectations. In 1994, the 10-year Treasury yield peaked 10 months after the first rate hike — perhaps a reflection of an aggressive and quick Fed rate hike schedule (which is not expected in the current environment) and the Fed continuing to emphasize a go-slow approach.

Caveat Emptor

Of course, every historical period is unique, reaction may not follow historical form, and investors need to beware. The prevailing environment is quite different from others and involves a range of Fed stimulus that may be halted or reversed as the Fed gradually attempts to normalize policy. Bond purchases are expected to end in October 2014, and the Fed may eventually change its guidance from being on hold for a “considerable” period to signaling that a rate hike is drawing near. Both events may act as a catalyst to higher yields.

Other Fed tools, such as paying interest on excess bank reserves and the reverse repurchase facility, cloud potential market reaction. Additionally, the latest indication from the Fed is that it may maintain an overnight interest rate range, rather than set a specific rate, which may soften the potential market reaction.

We believe the rise in interest rates may begin sooner in anticipation of an interest rate hike. Bond valuations, although off the peak of early May 2013, remain very expensive by historical comparison, and the bond market has already priced in a Fed that may take longer than anticipated to raise interest rates. Along with lower yield levels compared with history, this makes the bond market vulnerable to rising rates. Timing such a move is very difficult, even with history as a guide. We favor a defensive stance in the bond market capitalizing on year-to-date strength and positioning with short to intermediate bonds to protect against the threat of rising interest rates.


IMPORTANT DISCLOSURES

The opinions voiced in this material are for general information only and are not intended to provide or be construed as providing specific investment advice or recommendations for any individual. All performance referenced is historical and is no guarantee of future results. All indices are unmanaged and cannot be invested into directly. The fast price swings of commodities will result in significant volatility in an investor’s holdings. International investing involves special risks such as currency fluctuation and political instability and may not be suitable for all investors.

Not FDIC/NCUA Insured | Not Bank/Credit Union Guaranteed | May Lose Value | Not Guaranteed by any Government Agency | Not a Bank/Credit Union Deposit

Member FINRA/SIPC


Geopolitics & Bonds
August 20, 2014

Bonds posted another weekly gain, due mostly to late week strength on the latest round of geopolitical fears. News of a Ukrainian attack on a Russian convoy helped spark a strong rally on Friday, August 15, 2014, pushing 10- and 30-year Treasury yields to new year-to-date lows before a modest reversal began on Monday, August 18, 2014.

A string of geopolitical events has helped bonds recently, from lingering tensions in Ukraine-Russia to renewed conflict in the Middle East both in Gaza and Iraq. Violence that results from such events creates uncertainty and can negatively impact investor sentiment. Heightened uncertainty in turn creates demand for high-quality assets and Treasuries are at the top of many investors’ shopping lists.

Geopolitics has helped push Treasury prices higher and yields lower on a few occasions in recent years.

  • Egyptian Revolution 2011 – The fall of Egypt’s government in early February 2011 was among the more notable events of the “Arab Spring.” Treasury prices rose following the overthrow of the Egyptian government with the 10-year Treasury yield falling from a peak of 3.75% down to 3.40% at the start of March 2011.
  • Syria 2013 – President Obama’s authorization to use air strikes at the end of August 2013 and early September 2013 helped bring about the end of the taper tantrum sell-off in the bond market as the 10-year Treasury yield approached 3.0%. The escalation of the Syrian conflict helped attract demand to high-quality bonds.
  • Ukraine 2014 – Russia’s annexation of Crimea in late February 2014 gave Treasuries a lift as fears over a greater conflict increased. The 10-year Treasury yield decreased from 2.75% to 2.60% following Russia’s invasion

In some cases higher oil prices accompany geopolitical conflicts and can create economic concerns. Higher energy prices can be a potential drag on the global economy, which can help support bond prices. This was not the case last week as oil prices continued their recent decline but the price has been above $100/ barrel for much of 2014 and played a role in bond strength this year.

Not the Only Driver

However, geopolitical events are usually accompanied by other market forces and are not the sole driver of bond prices. In the examples above, the move in yields proved short lived as fundamental forces took over as the main driver of bond prices. In 2011, European debt fears provided support to Treasuries for much of the year. In 2013, the taper tantrum created notably higher yields and cheaper bond valuations, which helped draw   in investors. Similarly, in 2014 multiple factors have played a role in domestic bond strength, not just renewed geopolitical fears. The initial lift to bond prices from the Crimean Crisis faded, but weak domestic economic data during the first quarter of 2014 helped support bonds. More recently, weak economic data in Europe and worries over the potential economic impact of sanctions has helped support European government bond prices.

European Record Lows

European government bond yields fell to new record lows last week as a result of economic and geopolitical concerns. The 10-year German Bund yield fell below the 1.0% barrier, closing the week at 0.95% before bouncing back to 1.0% in early trading Monday, August 18, 2014. The decline in competing high-quality European government bond yields has made U.S. Treasuries look more attractive by comparison. The drop helped the U.S. 10-year fall to fresh 2014 lows [Figure 1]. Yields on 10-year Spanish and Italian government bonds sit nearly level with comparable Treasuries and make Treasuries more attractive to global investors.

Figure_1

Strong Auction Demand

U.S. government auctions of 10- and 30- year Treasuries saw strong demand last week despite yields hovering near year-to-date lows. Robust demand for more interest rate sensitive longer-term debt is a vote of confidence on the market, and bodes well for Treasuries holding recent gains over the near term. This may be particularly true due to lower volume summer trading and investors placing an emphasis on safety and liquidity over the short term.

Fed Focus

The coming week brings the release of the minutes of the last Federal Reserve (Fed) meeting as well as the Fed’s annual Jackson Hole monetary policy conference. Both will be scrutinized for more details of the Fed’s exit plan for gradually raising interest rates and removing excess cash from the banking system. In the past, this conference has provided insights into the path of future Fed actions but a market-friendly tone is expected. Fed Chair Janet Yellen’s keynote speech on Friday, August 22, 2014 will focus on labor market dynamics, which remains unsatisfactory according to several measures she has highlighted, and a reason to take a go slow approach. The Fed’s September 17, 2014 meeting potentially looms larger as it includes updated economic forecasts and a press conference, and may provide a definitive update on the Fed’s exit strategy.

Conclusion

The bond market’s pricing continues to reflect expectations that the Fed will take longer to raise interest rates and go at a slower pace once rate hikes begin compared to the Fed’s own guidance. Indications from the Fed, either this week or at the upcoming September 17 Fed meeting, that it remains on course to raise interest rates a year from now may jar bond yields higher. In our view, such an indication is more likely to come at the September Fed meeting, if it comes at all, and in the meantime lingering uncertainty, geopolitical or economic, may continue to support high-quality bond prices in August despite expensive valuations.


IMPORTANT DISCLOSURES

The opinions voiced in this material are for general information only and are not intended to provide or be construed as providing specific investment advice or recommendations for any individual. All performance referenced is historical and is no guarantee of future results. All indices are unmanaged and cannot be invested into directly. The fast price swings of commodities will result in significant volatility in an investor’s holdings. International investing involves special risks such as currency fluctuation and political instability and may not be suitable for all investors.

Not FDIC/NCUA Insured | Not Bank/Credit Union Guaranteed | May Lose Value | Not Guaranteed by any Government Agency | Not a Bank/Credit Union Deposit

Member FINRA/SIPC

European Influence
August 13, 2014

Europe’s influence over the domestic bond market looks set to continue over the near term. Throughout 2014, lower yields among European government bonds have made US Treasury yields look attractive by comparison. More favorable yield differentials have drawn global investors to US Treasuries and played an important role in domestic bond market strength this year.

The yield advantage of intermediate US Treasuries relative to German government bonds is near a 15-year high [Figure 1]. The German 10-year Bond yield dropped to an all-time low of 1.04% last week in response to weaker  European economic data. German government bond strength supported U.S. government bonds and, in turn, the broad high-quality domestic bond market. German factory orders and industrial production were weaker than expected, and Italy’s economy unexpectedly contracted  during the second quarter. The poor European economic data raises concerns about another recession in Europe and what could be Italy’s third recession in the past five years.

Figure_1_001

Geopolitics and Sanctions

Weaker economic data also raised fears that Russian sanctions may be taking a toll on the European economy. European economies are more connected to the Russian economy than other developed markets. Russia’s recent retaliatory sanctions on agricultural imports will have almost no impact on the United States, since exports to Russia comprise only a small fraction of domestic economic growth, as measured by gross domestic product GDP). The impact, however, is greater for Europe. Concerns that sanctions may be a broader drag on economic growth, or escalate further, have supported top-quality European government bonds. The threat of geopolitical tensions lingering bolstered high-quality bond demand globally. Uncertainty over how long Ukraine-Russia tensions will persist, as well as renewed strikes in Iraq, aided bond markets. In low-volume summer months, such as August, demand for high-quality liquid assets is often higher than normal, but global events likely bolstered this demand.

Central Banks on Different Paths

The differing paths of central bank policies, which appear likely to persist over the near term, are another driver keeping European government bond yields low relative to Treasuries. The European Central Bank (ECB) cut interest rates earlier this year and remains committed to increasing stimulus while the Federal Reserve (Fed) is slowly moving toward an interest rate hike. The ECB may launch its version of bond purchases, similar to the Fed’s actions, this fall, while the Fed is expected to finish bond purchases, known as quantitative easing (QE), at the same time.

The different approaches of the ECB and Fed are a primary reason why the yield differential between Spanish and Italian government bonds has converged to US Treasuries [Figure 2]. ECB lending programs, interest rate cuts, and ECB President Mario Draghi’s comments to do “whatever it takes” have bolstered confidence in peripheral European debt issuers such as Italy and Spain. Supported by better global economic growth over recent years, the yield advantage of 10-year Spanish and Italian government bonds to the 10-year Treasury has narrowed to less than 0.5% from a peak of over 4.0%.

Figure_2

Spanish and Italian government bond yields increased last week in  response to the economic impact, which resulted from sanctions (and whether sanctions may escalate further), the threat of geopolitical tensions, which lingered for longer than anticipated, and weaker economic data. US Treasuries were a beneficiary, with both the 10-year and 30-year Treasury yield dropping to new year-to-date lows. The 10-year Treasury yield broke below 2.45% — the low end of a yield range that persisted for the past year [Figure 2]. The breach of this long-standing yield barrier could usher in additional nearterm strength.

Not Worth Chasing

European events and government bond yields may continue to support US Treasuries over the near term, but we would not use recent strength to add to high-quality bonds. After pausing in June and July, the resumption of Treasury strength has made valuations more expensive and the longerterm investing prospects less appealing. While high-quality bonds should comprise an allocation in diversified portfolios, recent Treasury strength also comes in the face of stronger domestic economic data. Last week, the Institute for Supply Management’s (ISM) non-manufacturing survey was stronger than expected and weekly jobless claims dropped to new multiyear lows, boding well for further strength in the monthly jobs report. Both reports added to evidence that the U.S. economy is back on track with a 3%-plus growth rate.

New supply in the form of 3-, 10-, and 30-year Treasury sales beginning Tuesday, August 11 may slow the advance of Treasuries, but global risks may keep demand elevated over August as investors emphasize safety and liquidity during low-volume summer trading. While the risk of higher bond yields and lower prices may have passed over the short term, we find longterm investing prospects of top-quality bonds unattractive and recommend a cautious posture with a mix of short and intermediate bonds.


IMPORTANT DISCLOSURES

The opinions voiced in this material are for general information only and are not intended to provide or be construed as providing specific investment advice or recommendations for any individual. All performance referenced is historical and is no guarantee of future results. All indices are unmanaged and cannot be invested into directly. The fast price swings of commodities will result in significant volatility in an investor’s holdings. International investing involves special risks such as currency fluctuation and political instability and may not be suitable for all investors.

Not FDIC/NCUA Insured | Not Bank/Credit Union Guaranteed | May Lose Value | Not Guaranteed by any Government Agency | Not a Bank/Credit Union Deposit

Member FINRA/SIPC