Archive for the ‘Uncategorized’ Category

Current Conditions Index
July 29, 2014

Over the past week, the LPL Financial Current Conditions Index (CCI) dipped slightly to 269. The CCI remains near the high end of its range during the current expansion after a spring bounce and may be poised to breakout to the upside from the modest, but steady economic growth of recent years in the United States.

Figure_1

During the latest week, the index was dragged down by lower retail sales, through partially offset by a pickup in shipping traffic following the holiday-impacted weakness during the prior week.

Figure_2


Figure_3


Figure_4


IMPORTANT DISCLOSURES

The opinions voiced in this material are for general information only and are not intended to provide or be construed as providing specific investment advice or recommendations for any individual. All performance referenced is historical and is no guarantee of future results. All indices are unmanaged and cannot be invested into directly. The fast price swings of commodities will result in significant volatility in an investor’s holdings. International investing involves special risks such as currency fluctuation and political instability and may not be suitable for all investors.

Not FDIC/NCUA Insured | Not Bank/Credit Union Guaranteed | May Lose Value | Not Guaranteed by any Government Agency | Not a Bank/Credit Union Deposit

Member FINRA/SIPC

Beige Book: Window on Main Street. Modest-to-Moderate Economic Growth Continues
July 22, 2014

The Beige Book is a qualitative assessment of the U.S. economy and each of the 12 Federal Reserve (Fed) Districts. We believe the Beige Book is best interpreted quantitatively by measuring how the descriptors change over time. The latest edition of the Fed Beige Book, released last Wednesday, July 16, 2014, ahead of the July 29 – 30, 2014 Federal Open Market Committee (FOMC) meeting, once again described the economy as increasing at either a “modest” or “moderate” pace, noting that “labor market conditions improved” but that “several Districts continued to report some difficulty finding workers for skilled positions.” Aside from higher wages to attract talent for these skilled positions, the Beige Book noted that “wage pressures remained modest in most Districts” and that “price pressures were generally contained.” The modest-to-moderate description of the overall  economy has now been used in the last 10 Beige Books, and in 11 of the past 12 dating back to March 2013.

Figure_1_001

Sentiment Snapshot

To provide a snapshot of the sentiment behind the entire Beige Book collage of data, we created our proprietary Beige Book Barometer (BBB) [Figure 1]. The barometer remained at +102 in July 2014, matching the June 2014 reading, but well above the +87 reading in April 2014 and the weather-impacted +62 reading in March 2014. At +102, the latest reading is the highest since the April 2013 Beige Book (+112). More importantly, the barometer remains above the October 2013 reading of +97, which was released just prior to the onset of the harsh winter weather that gripped much of the United States from December 2013 through most of the first quarter of 2014. The +102 reading on the Beige Book Barometer in July 2014 matches the second highest reading in the history of the data — only the +114 reading recorded in January 2005 was higher. The rebound in our Beige Book barometer over the past several months is consistent with the Fed’s view that the drop in economic activity — real gross domestic product (GDP) contracted at a 2.9% annualized rate in the first quarter of 2014 — was mostly weather related. In addition, we found that the word “weak” or its variants appeared just 17 times in the July 2014 Beige Book, less than half the long-term average of 50 mentions, and the fewest since 2005. This suggests to us that the negative headwinds that have held the economy back over the past seven years may be abating.

Weather was a big driver of the weakness in the Beige Book in the winter of 2013 – 14, but the arrival of more “normal” weather this spring and early summer held the weather mentions to just nine in the latest Beige Book, the fewest mentions since the December 2013 Beige Book, which preceded the onset of the harsh winter of 2013 – 14. Looking back, weather was mentioned 35 times in the June 2014 Beige Book after 103 mentions in April and 119 in March 2014. To put the 119 mentions of weather in the March 2014 Beige Book in historical context, weather was mentioned only 48 times in the Beige Book released just after Superstorm Sandy hit the U.S. East Coast in October 2012. Weather was mentioned a total of 61 times in the three Beige Books released during the unusually cold and snowy winter of 2010 – 11. On balance, the 119 mentions of weather in the March 2014 Beige Book — along with 31 mentions of the word “cold,” 24 of “snow,” and 35 of “severe” — suggest that the weather’s impact on the economy in the early part of 2014 was widespread and significant. This reinforces our view that the 2.9% drop in real GDP in the first quarter of 2014 was almost entirely weather related.

Figure_2

Looking ahead, we expect the improvement in the economic data to continue throughout the second half of 2014. We continue to expect that the U.S. economy, as measured by real GDP, may grow at 3.0% in 2014 —accelerating from the sub-2.0% growth rate of 2013 — based on the drags from 2013 reversing (tax hikes, government spending cuts, Europe recession) and a modest improvement in business spending. The data released thus far for the second and third quarters of 2014 suggest that the economy may be expanding at a pace well above its long-term average, a snapback from the weather-induced weakness in the first quarter of 2014. The GDP report for the second quarter of 2014 is due out at the end of July 2014. Please see our recently published Mid-Year Outlook 2014: The Investor’s Almanac Field Notes publication for details about our forecast for the second half of 2014.

Uncertainty Fading; Health Care Still a Concern;
Optimism Way Up

The uncertainty and lack of confidence around fiscal policy (fiscal cliff, debt ceiling, sequester, government shutdown) that dominated the Beige Book for most of 2013 is now clearly fading, as these words were used just nine times in the July 2014 edition of the Beige Book [Figure 3]. In both the April and June 2014 editions of the Beige Book, there were only 12 mentions of the words noted above, after 18 mentions in the March 2014 Beige Book and 26 mentions in the January 2014 Beige Book. These words were mentioned 65 times, on average, in each of the eight Beige Books released in 2013. As we wrote in our Outlook 2014: The Investor’s Almanac, we continue to expect concerns over government policy to fade over the course of this year.

Figure_3

Good weather or bad, the Affordable Care Act (ACA), and health care in general, has remained a consistent source of concern among respondents to the Beige Book, although the impact has faded a bit recently. The ACA (and health care in general) received just six mentions in both the July and June 2014 Beige Books, down from 17 mentions in the April 2014 Beige Book and 22 in the March 2014 edition. On average, the ACA/health care saw 22 mentions per Beige Book in 2013. We continue to expect this topic to appear frequently in the Beige Book in the quarters ahead as businesses and consumers adjust to the rollout of the legislation. The midterm congressional elections and the approach of the start of the open enrollment period for 2015 (November 15, 2014) may cause an uptick in concern around health care in the Beige Book.

Figure_4

Despite the recent barrage of bad news, optimism on Main Street remains high. In the July 2014 Beige Book, the word optimism (or its related words) appears 24 times, whereas the word pessimism appeared just once. This is not the start of a new trend, however, as in the first five Beige Books this year, the word optimism has appeared, on average, 28 times. In the similar period in 2013, optimism appeared, on average, 25 times per Beige Book. Looking back to the worst of the 2007 – 09 financial crisis and Great Recession, the word optimism appeared, on average, just nine times in the first five Beige Books of 2009, whereas the word pessimism appeared, on  average, five times. Concerns that the economic and market environment we are in today is similar to the period just prior to the onset of the Great Recession in late 2007 also appear to be way overdone based on this metric. In the first five Beige Books of 2007, the word optimistic appeared, on average, just 10 times per Beige Book, a far cry from the 28 times per Beige Book in the first half of 2014.


IMPORTANT DISCLOSURES

The opinions voiced in this material are for general information only and are not intended to provide or be construed as providing specific investment advice or recommendations for any individual. All performance referenced is historical and is no guarantee of future results. All indices are unmanaged and cannot be invested into directly. The fast price swings of commodities will result in significant volatility in an investor’s holdings. International investing involves special risks such as currency fluctuation and political instability and may not be suitable for all investors.

Not FDIC/NCUA Insured | Not Bank/Credit Union Guaranteed | May Lose Value | Not Guaranteed by any Government Agency | Not a Bank/Credit Union Deposit

Member FINRA/SIPC

Behind the Curve
July 15, 2014

Over the past week, the LPL Financial Current Conditions Index (CCI) made a new high of 279. The path of the CCI suggests a breakout to the upside may be emerging from the modest, but steady economic growth in the United States.

Figure_1_001

During the latest week, the index was affected by improvement in the VIX, jobless claims, retail sales, commodity prices, and shipping traffic.

Figure_2


Figure_3


Figure_4IMPORTANT DISCLOSURES

The opinions voiced in this material are for general information only and are not intended to provide or be construed as providing specific investment advice or recommendations for any individual. All performance referenced is historical and is no guarantee of future results. All indices are unmanaged and cannot be invested into directly. The fast price swings of commodities will result in significant volatility in an investor’s holdings. International investing involves special risks such as currency fluctuation and political instability and may not be suitable for all investors.

Not FDIC/NCUA Insured | Not Bank/Credit Union Guaranteed | May Lose Value | Not Guaranteed by any Government Agency | Not a Bank/Credit Union Deposit

Member FINRA/SIPC

Navigating the Markets
July 8, 2014

Compass Changes

  • ƒƒ Downgraded bonds from neutral to negative/neutral.
  • ƒƒ Upgraded technology to neutral/positive from neutral.
  • ƒƒ Downgraded consumer discretionary from positive to negative/positive.

Investment Takeaways

  • ƒƒOur 2014 stock market forecast calls for gains of 10 – 15%, based on our forecast for 5 – 10% earnings growth and modest price-to-earnings (PE) multiple expansion.*
  • ƒƒWe favor small caps and cyclical sectors, as we expect U.S. economic growth to improve over 2014.
  • ƒƒ Our positive U.S. business spending view and forecast for improved global growth in 2014 are positive for technology, where valuations and technicals also support our upgraded view, and industrials.
  • ƒƒ Our overall fixed income downgrade reflects high valuations still evident across the bond market. We believe a below-benchmark bond weighting is appropriate.
  • ƒƒWe favor a blend of high-quality intermediate bonds and less interest rate sensitive sectors such as high-yield bonds, though higher high-yield bond valuations suggest caution.
  • ƒƒ From a technical perspective, we view the S&P 500 Index closing at all-time highs as bullish, indicating short-term price momentum.

Figure_1

Equity & Alternative Asset Classes

Favor Small Caps as Bull Market Likely to Continue*
ƒƒ

  • Our 2014 stock market forecast remains for gains of 10 – 15%, based on our forecast for 5 – 10% earnings growth and modest PE multiple expansion.*
  • ƒƒWe continue to favor small caps for their potential to capture stock market gains this year amid potential improving economic growth in 2014 and an expected gradual increase in stock market valuations. But as we move into the later stages of the business cycle, small cap performance may begin to wane.
  • ƒƒWe maintain a preference for growth over value based on cyclical sector exposure and relative valuations.
  • ƒƒWe favor U.S. over large foreign, primarily due to Europe’s sluggish growth, but prospects for better growth overseas suggest a potentially more positive developed foreign equity view during the second half of 2014. Structural impediments to faster European growth remain, while Japan is on the upswing.
  • ƒƒ Supportive valuations and a positive technical picture make emerging markets (EM) equities a potentially attractive opportunity in the second half, even as the Federal Reserve (Fed) tapers quantitative easing (QE).
  • ƒƒ Deteriorating technicals led to our recently lowered agriculture commodities view, while precious metal technicals are improving. Fundamental concerns keep us neutral on precious metals and crude oil (WTI), which we view as overvalued.

Figure_2

Figure_2-2


Equity Sectors

Business Spending Outlook Leads to Technology Upgrade, Consumer Discretionary Downgrade

  • ƒƒWe continue to favor the cyclical sectors for their potential to capture further stock market gains as economic growth improves.
  • ƒƒ As we enter the back half of the business cycle, we are tempering our positive view of consumer discretionary.
  • ƒƒ Our positive U.S. business spending view and forecast for improved global growth in 2014 support industrials, including transports, and technology, where valuations and technicals also support our upgraded view.
  • ƒƒ Resource sector technicals are positive, but valuations, and in the case of energy, downside risk to oil prices, temper our enthusiasm.
  • ƒƒ Our financials view is neutral. Improving loan demand and the potential for a steeper yield curve favor regional banks, but the trading, mortgage, and regulatory environments remain challenging for the largest institutions.
  • ƒƒ Our neutral health care view reflects our focus on cyclical sectors, though robust product innovation trends, a likely uptick in demand from the Affordable Care Act (ACA), and solid pace of earnings growth solidify health care’s place as our favorite defensive sector.
  • ƒƒWe remain cautious on telecom and utilities due to their interest rate sensitivity, though telecom valuations have become attractive.We do not expect the year-to-date utilities strength — largely driven by falling interest rates — to be sustained.

Figure_3

Fixed Income

Challenging Month of June

  • ƒƒHigher valuations are still evident across the market, despite modest price weakness among high-quality bonds so far in June. Yields remain near year-to-date lows, and yield spreads across several fixed income sectors are near post-recession lows.
  • ƒƒ A lower-than-benchmark weighting of bonds may be appropriate. We favor a blend of high-quality intermediate bonds coupled with less interest rate sensitive sectors such as high-yield bonds.
  • ƒƒWe expect municipal bond performance to slow after a good start to 2014. However, the sector remains attractive over the longer term.

Figure_4

Fixed Income (CONT.)

Challenging Month of June

  • ƒƒ EM debt benefited from a drop in long-term yields and a more benign Fed, but valuations are at their most expensive level of the past 18 months and performance may slow.
  • ƒƒ High-yield bond spreads are near 3.5%, and the average yield is hovering just below 5%. Higher valuations suggest caution.
  • ƒƒ Among high-quality bonds, we favor investment-grade corporate bonds due to their economic sensitivity and good fundamentals.

Figure_5

IMPORTANT DISCLOSURES
The opinions voiced in this material are for general information only and are not intended to provide or be construed as providing specific investment advice or recommendations for any individual. To determine which investments may be appropriate for you, consult your financial advisor prior to investing. All performance referenced is historical and is no guarantee of future results. All indexes are unmanaged and cannot be invested into directly. Past performance is no guarantee of future results. Preferred stock investing involves risk, which may include loss of principal. The Standard & Poor’s 500 Index is a capitalization-weighted index of 500 stocks designed to measure performance of the broad domestic economy through changes in the aggregate market value of 500 stocks representing all major industries.

Not FDIC or NCUA/NCUSIF Insured | No Bank or Credit Union Guarantee | May Lose Value | Not Guaranteed by any Government Agency | Not a Bank/Credit Union Deposit

Member FINRA/SIPC


Behind the Curve?
July 1, 2014

The term “behind the curve” has been used to describe a Federal Reserve (Fed) that is perceived to be late in lowering or raising interest rates in response to changing market or economic conditions. The most common use of the phrase is to describe the Fed as behind the curve on inflation. The Fed showed little concern over inflation during last week’s Fed meeting, despite the monthly consumer price index (CPI) report showing a continued rise in price pressures for May 2014 with recent gains accelerating [Figure 1].

Fugure_1

Fed Chair Janet Yellen downplayed the recent rise in inflation as likely “noise,” but the response still left investors questioning whether the Fed is behind the curve. Intermediate- to longer-term bond prices, which are most sensitive to inflation pressures, finished last week (June 16 – 20, 2014) slightly lower, and market expectations of future inflation, as measured by Treasury inflation protected securities (TIPS), moved higher. The implied breakeven inflation rate on 10-year TIPS rose to near a one-year high [Figure 2] but is still very subdued when viewed in a longer-term context.

Figure_2

The yield curve also steepened last week, as intermediate- and long-term yields closed the week slightly higher, while short-term yields finished marginally lower. Short-term bonds benefited from the Fed’s cautious tone regarding the recent improvement in economic data, which allayed market fears that the Fed may move up its timing of a first interest rate increase. Longer-term bonds, on the other hand, focused on a modest increase in inflation risk. Bond market changes overall were minor, however. Although the bond market may be getting more worried about inflation, in the grander scheme of things it isn’t really that worried…yet.

The annualized change in the personal consumption expenditures (PCE) index — the Fed’s favorite inflation measure — will be a focal point the week of June 23, 2014. The core measure is expected to increase at a 1.5% annualized rate, which would put core PCE at the low end of the Fed’s 2014 year-end forecast range of 1.5% to 1.7%. Since the Fed chose to downplay recent inflation readings, economic data over the coming two to three months may help confirm whether the recent inflation trend may be more lasting. The limited reaction by the bond market so far suggests more proof is needed before bond prices may be pushed materially lower. Additional economic improvement and rising inflation may add to the June 2014 rise in yields, while mixed data may maintain the longer-term trading range defined by a 2.5% to 3.0% 10-year Treasury yield.

Inflation, and uncertainty around the Fed’s potential response, is one reason why the broad bond market, as measured by the Barclays Aggregate Bond Index, is down 0.5% month-to-date through June 23, 2014. Profit taking has emerged in June as low inflation, one of the drivers of bond strength during the first half of 2014, is beginning to fade.

The recent rise in inflation has made bond valuations more expensive as measured by inflation-adjusted, or real, yields [Figure 3]. The lower the real yield, the more expensive bonds are, and vice versa. The inflation-adjusted yield of the 10-year Treasury has increased slightly in June 2014 but remains near a one-year low after falling for most of 2014. With the Fed continuing to taper, inflation on the rise, and the economy improving, real yields are likely to resume their ascent and may pressure bond prices lower and yields higher.

Figure_3

Inflation can have a beneficial impact on lower-rated bonds, however. As inflation increases, the value of a company’s debt (issued during a period of cheaper prices) decreases while revenues come in commensurate with higher prices. Results are company specific, but in general, rising inflation can help deflate debt burdens. Since lower-rated bonds tend to have little or no interest rate sensitivity, they may fare better in a rising rate environment spurred by rising inflation.

It is too early to determine whether the Fed is behind the curve on inflation, and data released over coming weeks and months should shed further light. Should the Fed be slow to adjust policy in response to a gradual rise in inflation, bond yields (longer-term yields in particular) may move higher as investors price in a greater buffer again inflation risks. Lower-rated bond sectors, such as bank loans and high-yield bonds, tend to fare better against inflation risks. As the low inflation pillar of year-to-date bond strength fades, it may be one more reason to be cautious in the bond market.


IMPORTANT DISCLOSURES
The opinions voiced in this material are for general information only and are not intended to provide specific advice or recommendations for any individual. To determine which investment(s) may be appropriate for you, consult your financial advisor prior to investing. All performance reference is historical and is no guarantee of future results. All indices are unmanaged and cannot be invested into directly. Past performance is no guarantee of future results.

The economic forecasts set forth in the presentation may not develop as predicted and there can be no guarantee that strategies promoted will be successful.

Stock and mutual fund investing involves risk including loss of principal.

INDEX DESCRIPTIONS
The Standard & Poor’s 500 Index is a capitalization-weighted index of 500 stocks designed to measure performance of the broad domestic economy through changes in the aggregate market value of 500 stocks representing all major industries.

Bank Loan Bashing
June 24, 2014

Bashing bank loans has become popular in recent weeks and months, but we disagree with the negative headlines. Several weeks of mutual fund outflows, following robust inflows in 2013, and liquidity concerns (i.e., the ease with which an investment can be bought or sold) highlight investor fears. Mutual fund outflows and liquidity risks are not unique to bank loans, however, and current concerns may be overblown. We continue to find the asset class one of the more attractive in the fixed income markets based on our outlook for the economy and corporate bond markets over the remainder of 2014.

Valuations suggest that bank loans have not reached the “frothy” price levels typical of overcrowded investments. Bank loans pay a floating rate of interest tied to Libor (the London Interbank Offered Rate), an overnight lending rate very similar to the target fed funds rate set by the Federal Reserve (Fed). The greater the yield advantage, or spread, that bank loans pay relative to Libor, the more attractive bank loans are and vice versa. The average spread of bank loans is approximately 4.3%, which has declined in recent years much like yield spreads across fixed income markets, but is well above the average 2.0% yield advantage that persisted prior to the financial crisis. Current yield spreads remain far away from those during the overheated market of 2006 – 07.

The average price of a bank loan is still lower today than in 2007 and has remained relatively stable near 99 in recent weeks compared with the average of just above par value (100) from late 2006 through late 2007, according to the Credit Suisse Leverage Loan Index. If bank loans were an overheated market, yield spreads and prices would likely resemble pre-crisis levels. But both metrics remain far below levels that precipitated sharp price declines.

Large leveraged buyout (LBO) transactions typified some of the excesses of the pre-financial crisis corporate bond markets. Loans issued by heavily debt-burdened companies coupled with expensive valuations led to weakness in many lower rated bonds, not just bank loans. LBO issuance has increased recently along with an improving economy that has spurred merger and acquisition activity, but as a percentage of issuance LBOs remain well below 2007 levels [Figure 1].

Figure_1

Refinancing still comprises the largest use of proceeds and accounts for almost 20% of new loan issuance. Refinancing is a healthy use of proceeds as it helps companies cut interest costs, which in turn can boost profitability. From 2006 to 2008, refinancing accounted for only 10% of new issuance and was behind both LBOs and outright acquisition-related loan issuance as a driver of new issuance. On a dollar volume basis LBO-related issuance exceeded $180 billion in 2007, while 2014 is on pace to finish the year near $80 billion (according to S&P LCD data as of 06/16/14) — still a stark contrast to the excesses of 2007.

The bank loan market has grown significantly in recent years, but last year’s growth was not simply due to investor mutual fund inflows. In addition to acquisitions and refinancing, a loan can be issued simply for general corporate purposes. A still low interest rate environment, a growing economy, and strong demand for floating rate debt have all fueled growth in the bank loan market. A corporate debt issuer is naturally going to be inclined to sell debt where demand is strong, and this has aided the growth of the market along with several large high profile issues. Bank loan terms can also be a viable option for companies to refinance fixed-rate debt into floating rate obligations.

Covenant Lite 

The favorable terms for issuers present a longer-term risk for investors. Over 50% of loan market issues are “covenant lite” and have relaxed legal protections for investors to the benefit of issuers. By themselves relaxedprotections do not necessarily pose a problem if corporate bond markets function smoothly and demand remains steady. However, should market conditions deteriorate, weaker covenants can lead to conditions that make it easier for a company to default. At the margin, this is a risk investors must pay attention to as it raises default risks for 2015 and beyond.

Liquidity

Bank loans are one of the few fixed income categories that have recently been subject to mutual fund outflows, raising fears that additional outflows may lead to price declines due in part to their lesser liquidity. This may be a delayed reaction to investors seeking more interest rate sensitive sectors and chasing year-to-date bond market strength, which we believe is illtimed. Reduced liquidity can be a risk in other markets such as high-yield bonds and municipal bonds. Less liquid markets can contribute to greater price declines in a pullback and played a role in 2013 bond market weakness.

Outflows in combination with heavy new issuance weighed on bank loan prices in April, but since then the market has marched higher despite continued mutual fund outflows. That is partially because mutual funds comprise roughly 25% of the market and therefore are not a dominant driver. Institutional collateralized loan obligations (CLO) represent the majority buyer at approximately 50%. CLOs are investment pools that purchase floating rate loans and repackage the securities, depending on risk, to institutional investors. Demand from CLOs has been strong and can help buffer the loan market when individual investor demand is weak.

Rising Rates

Floating rate loans benefit investors most when interest rates rise, as their interest payments ratchet higher, but the current structure of the bank loan market suggests several Fed rate hikes may be necessary before interest income increases. The use of a minimum interest rate, known as a Libor floor, averages 1.0% currently, indicating the Fed would have to increase the fed funds rate to a similar level before bank loan payments increased. Under a Fed rate hike scenario, many other bond prices would likely be pressured, so we do not view this as a negative since bank loans have no interest rate sensitivity. Current floors are boosting yields now and would still provide an attractive source of return in a rising rate environment.

In a fixed income world with scarce opportunities, we believe bank loans could be one of the more attractive options. Demand for all types of non-Treasury securities has been robust, leaving valuations compressed across the bond market. Relative to high-yield bonds, bank loan investors have been giving up relatively little yield [Figure 2]. At the same time, high quality bonds remain expensive with yields remaining near the low end of the range, providing little room for stronger economic growth, a rise in inflation, or bearish rhetoric from this week’s Fed meeting. Although we acknowledge bank loans’ risks, we believe they are overstated and the asset class remains attractive.

Figure_2


IMPORTANT DISCLOSURES
The opinions voiced in this material are for general information only and are not intended to provide specific advice or recommendations for any individual. To determine which investment(s) may be appropriate for you, consult your financial advisor prior to investing. All performance reference is historical and is no guarantee of future results. All indices are unmanaged and cannot be invested into directly. Past performance is no guarantee of future results.

The economic forecasts set forth in the presentation may not develop as predicted and there can be no guarantee that strategies promoted will be successful.

Stock and mutual fund investing involves risk including loss of principal.

INDEX DESCRIPTIONS
The Standard & Poor’s 500 Index is a capitalization-weighted index of 500 stocks designed to measure performance of the broad domestic economy through changes in the aggregate market value of 500 stocks representing all major industries.

Who Are the Buyers and Sellers?
June 17, 2014

We devote this commentary each week to assessing the many reasons markets may rise or fall. But at the heart of it, all markets come down to just one thing: buyers and sellers. Taking a look at who is buying and who is selling can tell us something about the durability of the market’s performance and what may lie ahead.

Currently, there are six notable trends in buying and selling in the stock market. U.S. stocks are being purchased by corporations and individuals; however, foreigners, hedge funds, institutions, and insiders are net sellers.

Figure_1_001

Companies. Companies themselves have been the biggest buyers of stocks. After reducing purchases during the financial crisis in 2008 and 2009 as companies focused on hoarding their capital, corporations have returned to record levels of net share repurchases. According to data from FactSet, S&P 500 companies bought back about $160 billion in stock in the first quarter of 2014, and are on pace for an amount this quarter that is close to the all-time high of $172 billion set in the third quarter of 2007. Corporations have been decreasing the amount of shares in the market for 10 straight quarters. Over the past year, this has amounted to about 3% of shares outstanding in the S&P 500. Corporations have become net buyers of shares as rising cash flow and wide profit margins compel them to shrink their share count to boost earnings per share, as revenue growth has been sluggish.

Individuals. Individual investors have been sellers in recent years. It is notable that in 2011 and 2012, investors sold more steadily and in total sold a greater amount than they did during the financial crisis in 2008 and 2009, measured by the net flows to funds that invest in U.S. stocks. However, individual investors have finally become net buyers over the past year as trailing returns have turned sharply positive on a 1-, 3-, and 5-year time horizon [Figure 2].

Figure_2


Foreigners. Data released by the Treasury Department show that foreigners have been net sellers of U.S. stocks over the past year following a period of relatively steady buying during 2009 – 12 [Figure 3]. This selling has been led mainly by waning demand from European investors as their economy finally emerged from recession a year ago. The weakest pace of net purchases of U.S. stocks by foreigners at the start to any year since 2004 sets 2014 on a disappointing pace.

Figure_3

Hedge Funds. The U.S. Treasury tracks net purchases of U.S. stocks from investors in the Caribbean, which primarily represents demand by hedge funds. Hedge funds have been net sellers so far in 2014, as they have been for most of the past 12 months. The pace of selling has increased in recent months. Over the past three years, the monthly average has been a net sale of less than $1 billion of U.S. stocks, ranging from a net purchase of $9.3 billion to a net sale of $15.7 billion.

Institutions. Institutions have been selling stocks. In general, institutions are considered to be corporate and other private pension funds, public sector pension funds at the federal, state, and local level, and insurance companies including both property-casualty and life insurance companies. Insurance companies have been buyers, but  pensions have been big sellers. Pension plans, both defined benefit and defined contribution, enjoyed a recovery in 2013 with the S&P 500 Index rising the most since 1997. That helped corporate pension funds close the gap to about 95% fully funded at the end of 2013. Pensions are rebalancing their portfolios away from stocks and back toward bonds. But this is nothing new: according to data from the Federal Reserve (Fed), pensions were selling stocks every year since the Great Recession began in 2008 to fund payouts and greater allocations to bonds. Stock allocations are well below what they were before the financial crisis.

Insiders. In contrast to the buying they are directing their companies to undertake, insiders, or top executives of companies, have been net sellers of shares. Should this net selling be seen as an important signal by those “in the know” of impending doom for corporate America? History offers a very different interpretation. Corporate insiders were buying in 2007 at the peak, and they were selling in 2009 as stocks were bottoming. Back in August of 2007, around the peak of the stock market, insiders at financial companies were doing the most buying in 12 years. At the time, this trend was interpreted by some as a buy signal for financials just before the companies in this sector saw their stocks fall more than 80%. Given this track record, we do not interpret the insider selling as a signal that they are acting on any inside information that would benefit an individual investor. Instead, we see it as another indicator of relative demand for stocks. The pace of net selling has slowed notably this year, as the pace of gains in the  stock market has moderated.

Projecting the Trends

While there are more groups that are sellers than buyers, some matter a lot more than others. For example, corporations bought nearly $500 billion last year while net selling by hedge funds was less than $20 billion.

We expect companies and individuals to continue to be net buyers while insiders and institutions and foreigners remain sellers, and hedge funds may average to flat net buying in the coming quarters. Risks to stocks would be a slowdown in corporate buybacks and a return to selling by individuals. On the other hand, fuel for the stock market could come from a re-allocation back toward stocks or a slowing in the pace of selling and reallocating to bonds by institutions as interest rates rise and bond returns suffer.

Evidence of the power of these trends in buying and selling can be seen in the performance of the bond market in recent years where buying by all parties — institutions, individuals, foreigners, and the Fed — pushed bond prices higher and yields to record lows.


IMPORTANT DISCLOSURES
The opinions voiced in this material are for general information only and are not intended to provide specific advice or recommendations for any individual. To determine which investment(s) may be appropriate for you, consult your financial advisor prior to investing. All performance reference is historical and is no guarantee of future results. All indices are unmanaged and cannot be invested into directly. Past performance is no guarantee of future results.

The economic forecasts set forth in the presentation may not develop as predicted and there can be no guarantee that strategies promoted will be successful.

Stock and mutual fund investing involves risk including loss of principal.

INDEX DESCRIPTIONS
The Standard & Poor’s 500 Index is a capitalization-weighted index of 500 stocks designed to measure performance of the broad domestic economy through changes in the aggregate market value of 500 stocks representing all major industries.

Irrepressible Bonds
June 10, 2014

The march higher in bonds took a bold step forward last week as the 10-year Treasury yield dropped below 2.5% briefly, the low end of a multi-month yield range. Bond strength came amid little to no news, making the most recent run-up in bond prices peculiar but similar to other bouts of strength over the past two months.

Last week’s gains have pushed the Barclays Aggregate Bond Index up near 4% year to date through the end of May 2014. There have been multiple drivers of the bond market rally, which we highlighted in the May 6, 2014, Bond Market Perspectives: The New Conundrum. Most are generally still impacting the market even though June has begun on a soft note. Two drivers have had a particularly strong influence as of late: investor positioning and changing expectations of the Federal Reserve (Fed).

Positioning

The expectation of stronger economic growth and a Fed that is slowly moving toward raising interest rates fostered expectations of rising bond yields and lower prices. Institutional investors, such as hedge funds, had placed bets on lower prices, known as short selling. However, as bond prices have increased, leading to losses on short positions, investors have had to scramble to buy back bonds, pushing prices higher in the process. Timing of such flows is difficult to anticipate but helps to explain bond strength on days without significant news or even in the face of strong economic data, which would normally pressure prices higher.

The strength in bonds can also force the hand of some investors who were underinvested in bonds overall or overinvested in short-term bonds. Investors who are underinvested in bonds or who positioned portfolios to have less interest rate sensitivity relative to the broad market see smaller gains in their portfolios as bond prices rise. When bond strength becomes extended, investors often buy longer-term bonds for fear of missing out on additional bond price gains. Such buying can create additional momentum for the bond market.

Significant short covering in the Treasury market last week may help explain a spike lower in yields in the absence of news. Net short positions in 10-year futures declined to a near neutral level of 19,000 contracts for the week ending May 27, 2014, versus a prior net short of 97,000 [Figure 1].  The reversal in short positions was one of the largest weekly moves of the past few years according to Commodities Futures Trading Commission (CFTC) data. While certainly not the only driver of yields year to date, offside positioning has helped drive bond prices particularly in April and May 2014. Positioning is much more balanced now, suggesting short-covering momentum may fade.

Figure_1_001

Fed Expectations

Changing market expectations of how high the Fed may ultimately raise interest rates has been a theme over the second half of May. The Fed’s economic projections include a forecast of the long-term “neutral” target fed funds rate. This projection reflects where Fed members estimate the target fed funds rate would rest in a neutral environment and is currently estimated at 4%. But investors have questioned whether the economy could withstand such a short-term borrowing rate and whether the target fed funds rate may rest at 2% or 3%, for example, rather than 4%.

Public comments from current and past Fed officials have supported the theory that the target fed funds rate may not rise as high as 4%. Recently, New York Fed President Bill Dudley stated that the target fed funds ate will likely rest “well below” 4.25%, especially if inflation remains subdued. Former Fed Chairman Ben Bernanke stated at a recent dinner event that he does not expect to see a 4% target fed funds rate in his lifetime.

If short-term rates do not rise as much as projected by the Fed, then it follows that current intermediate- and long-term yields need not rise as high in response, and longer-term Treasury yields may be more attractive.

However, yields should still be higher even using this analysis. Over the long term, the 10-year Treasury yield has averaged 1.2% more than the target fed funds rate. Adding 1.2% to a 2% target fed funds rate would equate to a 3.2% 10-year Treasury yield, while a 3% target fed funds rate would equate to a 4.2% 10-year Treasury yield. These are hypothetical examples but still show how future bond yields may likely be higher than today’s rates. Granted interest rates may not rise as high, which may reduce risk for bond investors, but they are still likely moving higher as the Fed normalizes policy.

A lower fed funds rate implies longer-term bond yields may not rise as high, but the headwind of rising interest rates is not eliminated. A very low return environment for bond investors still remains. In our view, the bond market has priced in a lot of the good news about a friendly Fed. Market rate hike expectations are very benign [Figure 2].

Figure2

Unbalanced investor positioning may have run its course, and investor expectations about the Fed may be as good as it gets. An announcement of steps to further boost economic growth by the European Central Bank this week coupled with improving domestic economic data may begin to turn the tide on an irrepressible bond market this year.

IMPORTANT DISCLOSURES
The opinions voiced in this material are for general information only and are not intended to provide specific advice or recommendations for any individual. To determine which investment(s) may be appropriate for you, consult your financial advisor prior to investing. All performance reference is historical and is no guarantee of future results. All indices are unmanaged and cannot be invested into directly. Index performance is not indicative of the performance of any investment.

This information is not intended to be a substitute for specific individualized tax advice. We suggest that you discuss your specific tax issues with a qualified tax advisor.

The economic forecasts set forth in the presentation may not develop as predicted and there can be no guarantee that strategies promoted will be successful.

The Fed funds rate is the interest rate on loans by the Fed to banks to meet reserve requirements.

Bonds are subject to market and interest rate risk if sold prior to maturity. Bond values and yields will decline as interest rates rise, and bonds are subject to availability and change in price.

Government bonds and Treasury bills are guaranteed by the U.S. government as to the timely payment of principal and interest and, if held to maturity, offer a fixed rate of return and fixed principal value. However, the value of fund shares is not guaranteed and will fluctuate.

Stock and mutual fund investing involves risk including loss of principal.

An Old Nemesis Returns
June 3, 2014

Inflation — one of bond investors’ chief enemies — may be making a resurgence. The rate of inflation remains low, but market awareness about a possible bottom is increasing. This week the Federal Reserve’s Fed) preferred measure of inflation — core personal consumption expenditures (PCE) — is expected to increase to 1.4% for April 2014 after a 1.2% annualized rate in March.

Inflation is an important risk to monitor in bond investing. Since most bond interest payments are fixed over the life of the bond, rising inflation can erode the value of those payments and lead to lower bond prices.

The PCE will likely follow the recent increase in the widely followed core Consumer Price Index (CPI), which rose to a greater-than-expected 1.8% in April 2014 after an above-forecast increase in March. Core CPI has accelerated in recent months with the three-month change equating to a 2.3% annualized rate of inflation [Figure 1]. Prices at the producer level, often watched for signs of “pipeline” inflation pressures, have increased as well. Core finished goods prices as measured by the Producer Price Index (PPI) bottomed in late 2013 and have moved steadily higher since.

Several factors point to prices firming up further (for more insights see the Weekly Market Commentary: The Big Bang Theory: Inflating the Stock Market, 4/21/14):


Figure_1


  • Global economic growth. Second quarter 2014 economic growth in the United States is expected to bounce back from a weak first quarter and is on pace to expand at a 3.5% rate, according to the Bloomberg consensus forecast, based on a rebound in consumption and industrial production following a snowier and colder winter that depressed economic activity. Overseas, China’s Purchasing Managers’ Index (PMI) — an important gauge of manufacturing activity in China — showed signs of stabilization after a year of deceleration.
  • Housing rents. Housing purchases have slowed due to higher interest rates, housing price gains, and still-tight residential mortgage lending standards. But housing rents, a key driver of core CPI, have steadily increased since late 2013 and may likely continue to exert upward pressure on core CPI over the remainder of 2014. Housing rents comprise roughly 25% of core CPI and favorable year-over-year comparisons may boost core CPI.
  • Job growth. The three-month moving average of monthly private payroll gains is 225,000, the highest since November 2013. Although job growth remains sluggish compared with prior recoveries, continued improvement may lead to price pressures over time.

Measures of inflation expectations in the bond market have also increased. The breakeven inflation rates implied by Treasury Inflation-Protected Securities (TIPS) are near one-year highs [Figure 2]. In April 2014, the five-year TIPS auction witnessed very strong demand, and demand was again robust at last week’s 10-year TIPS auction. Higher implied inflation rates indicate investors are requiring greater inflation protection. Since the beginning of May 2014, the yield differential between intermediate- and longterm Treasuries has increased, leading to a steeper yield curve, which often reflects greater, longer-term inflation risks.

Figure_2
Still Modest

To be sure, the increases in inflation expectations and in the broad price indexes, such as the CPI, are still modest by historical comparison. The 10- year TIPS yield suggests that CPI inflation will average 2.25% over a 10-year horizon — a low level.

The three factors mentioned earlier that may continue to lift inflation will take time to influence prices. Economic growth and job gains will likely need to increase further and remain at higher levels to generate sustained price pressures. Wage pressures, a bigger driver of inflation, remain muted and limit the potential pace of price gains, but signs of wage pressures may be emerging. The most recent Employment Cost Index (ECI) released for the quarter ending March 31, 2014, diverges from the recent trend of small business that intend to increase worker compensation [Figure 3]. The next release of the ECI, in late July 2014, may reflect the stronger  compensation plans. We expect this to translate to a gradual increase in the rate of inflation.

Figure_3

We believe inflation is likely to increase only slowly, but current bond yields offer limited protection against rising inflation. Low real yields present an unattractive investment proposition for bond investors, and renewed weakness in the economy is needed to justify current real yields. Inflation is likely to creep toward the Fed’s 2% target over 2014 and into 2015, meaning the Fed is likely on track to raise rates in late 2015/early 2016. The Fed is projecting a median 1.0% and 2.25% fed funds target rate by year-end 2015 and 2016, respectively, but fed fund futures indicate a 0.6% and 1.6% rate for the same time periods — a significant disparity. Fading rate hike expectations indicate pricing could be as good as it gets for high-quality bonds.

Figure_4


IMPORTANT DISCLOSURES
The opinions voiced in this material are for general information only and are not intended to provide specific advice or recommendations for any individual. To determine which investment(s) may be appropriate for you, consult your financial advisor prior to investing. All performance reference is historical and is no guarantee indicative of the performance of any investment.

This information is not intended to be a substitute for specific individualized tax advice. We suggest that you discuss your specific tax issues with a qualified tax advisor.

The economic forecasts set forth in the presentation may not develop as predicted and there can be no guarantee that strategies promoted will be successful.

Bonds are subject to market and interest rate risk if sold prior to maturity. Bond values and yields will decline as interest rates rise, and bonds are subject to availability and change in price.

Government bonds and Treasury bills are guaranteed by the U.S. government as to the timely payment of principal and interest and, if held to maturity, offer a fixed rate of return and fixed principal value. However, the value of fund shares is not guaranteed and will fluctuate.

Stock and mutual fund investing involves risk including loss of principal.

Municipals Bloom Amid Drought
May 27, 2014

The municipal bond market is off to its best start since 2009, when attractive valuations in the wake of the financial crisis drew robust demand. The Barclays Municipal Bond Index is up over 5% year to date through May 16, 2014 — an impressive start for any fixed income sector in just under five months — and has recouped all of the loss from the 2013 pullback plus an additional 1%.

The municipal bond market has a history of bouncing back after a tough year, and the current bounce is similar to those witnessed in recent years [Figure 1]. In 2008, volatile and illiquid bond markets led to some of the most attractive municipal valuations ever witnessed relative to Treasuries. In late 2010, fears over municipal credit quality and a default surge led to lower prices that created another buying opportunity. Two factors differentiate the 2014 rebound, which actually began in late 2013 when prices first stabilized:

Treasury market strength. Treasury prices have increased despite steady reductions in bond purchases by the Federal Reserve (Fed) and indications that the Fed remains on track to eventually raise interest rates. But sluggish economic growth during the first quarter of 2014, Ukraine-Russia tensions, emerging market growth fears, and doubts over the timing and magnitude of future Fed interest rate hikes pushed Treasury prices higher, leading to broad bond market strength in 2014 and boosting municipal bond prices in the process. The 2011 municipal rebound was also aided by stronger Treasury prices, but Treasury strength resulted from a Eurozone recession and the Fed committing to refrain from raising interest rates — a different set of drivers.

Figure_1_001

Very limited supply. Municipal bond new issuance in 2014 is running approximately 30% below the 2013 pace and is on track to be the lowest in 10 years. Higher interest rates and the limited capacity of state and local governments to take on new debt have led to a significant reduction in new municipal bond issuance, helping municipal bonds outperform Treasuries in the process.

Figure_2

Municipal outperformance has led to more expensive valuations [Figure 2]. The average 10-year AAA-municipal-to-Treasury yield ratio still sits near a three-year low while the 30-year ratio has fallen to the lower end of its range.

On a long-term basis, municipal yield ratios remain attractive with average fully tax-exempt 30-year AAA municipal bond yields higher than comparable Treasuries. Some moderation may be likely now given the decline in yields in 2014. Average 10- and 30-year AAA municipal yields are down 1.0% and 1.1%, respectively, from 2013 peaks, and both yields are less than 0.5% above those prevalent at the start of the 2013 bond sell-off.

Caution Ahead

Investors are now starting to show some hesitation in response to lower yields and more expensive valuations. The amount of bonds looking to be sold, known as bid-wanteds, has increased in recent days and reflects the first signs of possible profit taking [Figure 3]. Such increases can lead to lower prices in response to rising selling pressure. Similar increases in bid-wanteds occurred in January and March of this year but were not sustained and created only minor price weakness. Also, recent increases in the amount of bonds available for sale are still below the elevated levels of 2013 that contributed to the bond pullback. The increase is therefore not a significant threat as of yet but is worth monitoring.

Figure_3

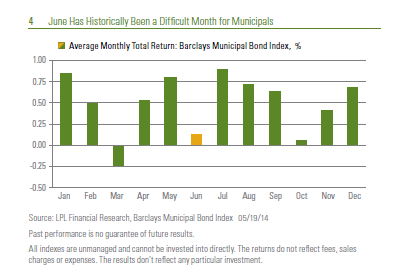
In conjunction with the first signs of selling, the month of June, especially the first half of the month, represents a difficult seasonal period for municipal bond investors as new issuance typically increases substantially.

June and July represent two of the biggest months in terms of maturing bonds, and municipalities often issue new debt to roll over maturing bonds. Caution ahead of the typical June issuance increase has historically led to
seasonal weakness for municipal bond investors [Figure 4] and it is among the weaker-performing months of performance, according to Barclays Index data. For example, the average monthly return in June has been historically only slightly positive for municipal bonds.

On a positive note, Figure 4 also illustrates that June has historically been followed by three of the strongest-performing months. Maturing bond proceeds are typically reinvested during summer months, boosting demand just as new issuance usually subsides. The seasonal summer trend did not hold in 2013, but with the limited supply trend likely to continue this year, June weakness may be limited ahead of a typically strong period for reinvestment demand. New issue supply and seasonal challenges may offset each other, perhaps posing no more than a hiccup similar to March of this year when municipal bond prices witnessed minor declines.

Figure_4


This leaves the taxable bond market — the other driver of strong year-to-date municipal performance — as the main catalyst for the next move in municipal bond prices, be it higher, lower, or sideways. For each rebound highlighted at the outset of this report, the direction of the Treasury market has provided a roadmap for the next significant move. Treasuries have shown remarkable resilience despite recent improvement in economic data that show a rebound in activity in the second quarter following a weather-depressed first quarter in 2014 (see Weekly Economic Commentary: Snapback, May 19, 2014). Lower Treasury yields reflect a market that needs more convincing as to the strength of the economy, but we believe the recent improvement will continue and ultimately pressure Treasury yields higher.

Absent a new bout of economic weakness, we see additional municipal price gains as limited. Prices may hang onto gains for some time, but nearterm opportunities are limited. On a longer-term basis, the favorable supply backdrop and 2013 increase in tax rates may help municipals be more resilient against the threat of rising interest rates. Over the shorter term, we continue to find the current pace of performance unsustainable, and current yields and valuations give us pause. We see recent strength as an opportunity to take gains and not as a sign of a possible buying opportunity


IMPORTANT DISCLOSURES
The opinions voiced in this material are for general information only and are not intended to provide specific advice or recommendations for any individual. To determine which investment(s) may be appropriate for you, consult your financial advisor prior to investing. All performance reference is historical and is no guarantee of future results. All indices are unmanaged and cannot be invested into directly. Index performance is not
indicative of the performance of any investment.

This information is not intended to be a substitute for specific individualized tax advice. We suggest that you discuss your specific tax issues with a qualified tax advisor.

The economic forecasts set forth in the presentation may not develop as predicted and there can be no guarantee that strategies promoted will be successful.

Bonds are subject to market and interest rate risk if sold prior to maturity. Bond values and yields will decline as interest rates rise, and bonds are subject to availability and change in price.

Government bonds and Treasury bills are guaranteed by the U.S. government as to the timely payment of principal and interest and, if held to maturity, offer a fixed rate of return and fixed principal value. However, the value of fund shares is not guaranteed and will fluctuate.

Stock and mutual fund investing involves risk including loss of principal.

The Barclays Municipal Bond Index is a market capitalization-weighted index of investment-grade municipal bonds with maturities of at least one year. One cannot invest directly in an index.