Trust
The latest Beige Book (released Wednesday, September 4, 2013) and the August employment report (released Friday, September 6, 2013) likely provided Fed policymakers enough “cover” to begin scaling back QE. Figure 1 compares the latest readings on the LPL Financial Beige Book Barometer, as well as key metrics from the employment report, to the readings from September 2012, when the Federal Open Market Committee (FOMC) voted to commence the latest round of QE, dubbed QE3.
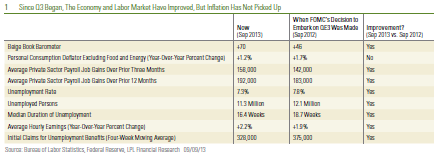
Data shows that the economy is not booming, the labor market is still struggling, and the Fed’s preferred measure of inflation has decelerated in recent months. All this suggests that although there is not a clear cut economic case for the Fed to begin slowing QE at the September 17 – 18 FOMC meeting, the overall economy (according to the Beige Book) and the labor market have improved modestly in the 12 months since the FOMC voted to embark on QE3.
Instead, comments over the past few months on the unintended consequences of QE from many Fed officials, including Fed Chairman Ben Bernanke, suggest that the FOMC may be questioning the efficacy of continuing to pursue QE. Therefore, they are ready to begin to taper sooner rather than later. In particular, Fed officials have expressed concerns that additional QE could potentially disrupt the smooth functioning of securities markets, cause investors to take on excessive risk and “reach for yield” in certain segments of the fixed income markets, and add to financial instability in the global economy.
Perhaps more importantly, in our view, since Fed Chairman Bernanke’s testimony before the Joint Economic Committee of Congress in May of this year, financial market participants have come to expect that the Fed would begin to taper this month, absent a major downshift in the economy. If the Fed does not follow through on tapering, it risks losing the market’s hard-earned trust; and any trust the markets have in the Fed today will likely come in handy when the Fed has to begin removing stimulus and raising rates in the years ahead.
In our view, the “trust” argument for the Fed to begin tapering QE next week is stronger than either the economic argument, or the “risks” argument; and as a result, the Fed is likely to announce modest tapering of QE next week. The latest consensus of market participants is that the Fed will trim QE by $10 – 15 billion, from $85 billion per month, to $70 – 75 billion per month. At the same time, the Fed is likely to place more emphasis on its promise to keep its key policy rate, the Fed funds rates, lower for longer; and, to rely more on this strengthened rate guidance than on QE as a policy tool in the period ahead.
Beige Book: Window on Main Street
The latest edition of the Federal Reserve’s (Fed) Beige Book, released on September 4, 2013, once again described the economy as increasing at a modest-to-moderate pace, with little wage or inflation pressures. Autos and housing, despite the recent rise in interest rates, were mentioned as key drivers of growth. As noted above, the tone of the latest Beige Book report suggests that the Fed is still on track to begin scaling back QE, but that it remains a long way from tightening monetary policy by raising its fed funds rate target.
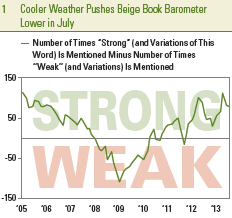
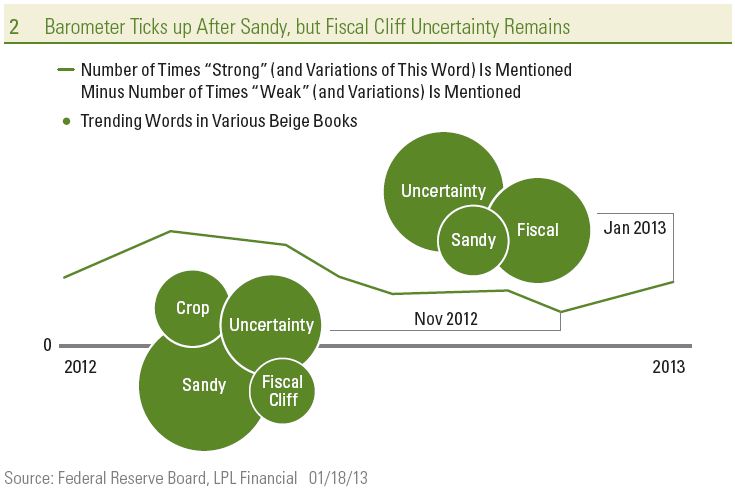
In order to provide one snapshot of the entire Beige Book collage of data, we created our proprietary Beige Book Barometer (BBB) [Figure 2]. The barometer ticked down to +70 in September 2013 from +79 in July 2013, and +82 in June 2013. Despite the downtick since April 2013, the BBB remains well above its Superstorm Sandy-related dip to +30 in November 2012. Note that the April 2013 reading (+112) was both a post-Great Recession high and also the highest reading since 2005, suggesting a broadening and deepening of the economic expansion. The move down to +70 from +112 between the April and July 2013 editions of the Beige Books came as the number of positive words dropped and the number of negative words hit a fresh seven-year low in September 2013. The drop in the number of negative words in the Beige Book to a seven-year low can be viewed as reflecting the diminishing pace of headwinds (e.g., fiscal policy, Europe, China, housing, and general economic uncertainty ) that have hampered the U.S. economic
recovery over the past four years.
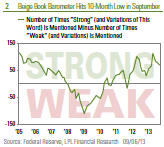
Our BBB, a diffusion index that measures the number of times the word “strong” or its variants (stronger, strength, strengthen, etc.) appear in the Beige Book less the number of times the word “weak” or its variants (weaken, weaker, etc.) appear, is displayed in Figure 2. The barometer is an easy-to-use, quantitative way to measure small shifts in the outlook and capture shades between strong and weak in the predominately qualitative Beige Book report.
Beige Book: How It Works
The Beige Book compiles qualitative observations made by community bankers and business owners about economic (labor market, prices, wages, housing, nonresidential construction, tourism, manufacturing) and banking (loan demand, loan quality, lending conditions) conditions in each of the 12 Fed districts (Boston, New York, Philadelphia, Kansas City, etc.). This local color that makes up each Beige Book is compiled by one of the 12 regional Federal Reserve districts on a rotating basis—the report is much more “Main Street” than “Wall Street” focused. It provides a window into economic activity around the nation using plain, everyday language. The report is prepared eight times a year ahead of each of the eight Federal Open Market Committee (FOMC) meetings. The next FOMC meeting is September 17 – 18, 2013.
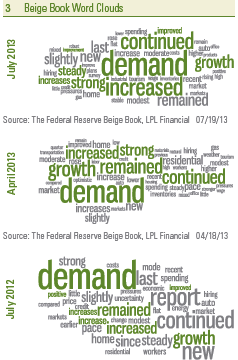
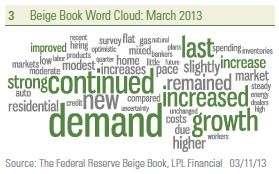
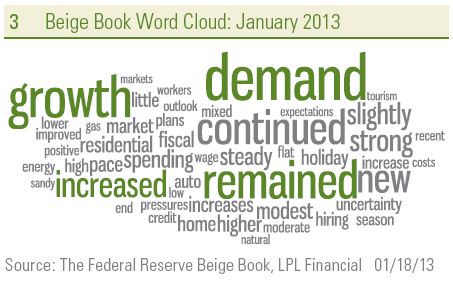
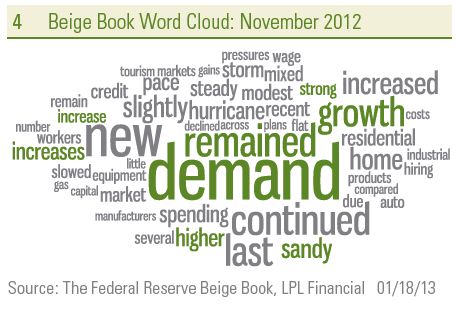
The previous word clouds or text clouds, which are a visual format useful for quickly perceiving the most important words in a speech, text, report, or other transcript, are culled from the Fed’s Beige Books published last week (September 4, 2013), the prior report (July 17, 2013) and in August 2012. In general, the more often a word appears in a speech, text, report or other transcript, the larger that word appears in the word cloud. The word clouds show the top 50 words for each of the two Beige Books mentioned above. Similar words are grouped together and common words like “the,” “and,” “a,” and “is” are excluded, as are words that appear frequently in all Beige Books (federal, district, loan, level, activity, sales, conditions, firms, etc.).
How the Barometer Works
The Beige Book Barometer is a diffusion index that measures the number of times the word “strong” or its variations appear in the Beige Book less the number of times the word “weak“ or its variations appear. When the Beige Book Barometer is declining, it suggests that the economy is deteriorating. When the Beige Book Barometer is rising, it suggests that the economy is improving.
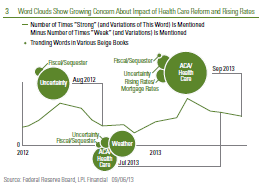
Word Clouds Show Growing Concern About Impact of Health Care Reform and Rising Rates
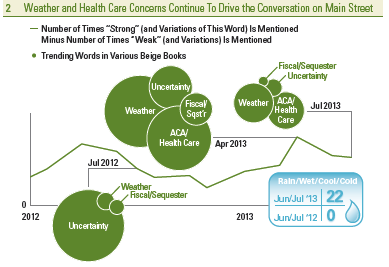
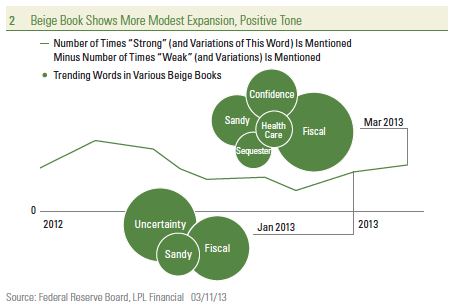
The word clouds in Figure 4 are dominated by words describing the tone of the economy when the Beige Books were published. Although not picked up in the nearby word cloud, the most notable trend in the latest Beige Book was the large uptick in the number of mentions of “health care,” “health insurance,” and the “Affordable Care Act” (ACA). There were 26 mentions of these words in the September Beige Book, up from just 15 in July. Clearly, heath care remains a major issue for Main Street as the ACA begins to be implemented. Health care, health insurance, and the Affordable Care Act were mentioned 28 times in June 2013, 26 times in April 2013, and 18 times in the March 2013 Beige Book. The topic warranted just eight mentions in the January 2013 Beige Book. In contrast, those words were found just a handful of times in the Beige Book released a year ago (July and August 2012). We will continue to monitor these health care words closely in the upcoming Beige Books, as the economy continues to adjust to the impact of the ACA. We expect this set of words to grow in importance in the coming months.
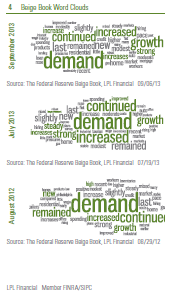
There were nine mentions of “mortgage rates”/”rising rates” in the September 4, 2013 Beige Book, up from just five in July 2013. There were no mentions of rising rates in the June 2013 Beige Book nor in the Beige Books in July or August 2013. Despite the rise in rates, the Beige Book noted that “attractive financing conditions and pent-up demand supported a robust pace of automobile sales in most Districts” and that “rising home prices and mortgage interest rates may have spurred a pickup in recent market activity, as many ‘fence sitters’ were prompted to commit to purchases.” Rising rates and their impact across all sectors of the economy will be important to monitor in the coming quarters as the Fed begins to scale back quantitative easing.
_________________________________________________________________________________________________________________________________________________________________________________
IMPORTANT DISCLOSURES
The opinions voiced in this material are for general information only and are not intended to provide specific advice or recommendations for any individual. To determine which investment(s) may be appropriate for you, consult your financial advisor prior to investing. All performance reference is historical and is no guarantee of future results. All indices are unmanaged and cannot be invested into directly.
The economic forecasts set forth in the presentation may not develop as predicted and there can be no guarantee that strategies promoted will be successful.
Stock investing involves risk including loss of principal.
Quantitative easing (QE) is a government monetary policy occasionally used to increase the money supply by buying government securities or other securities from the market. Quantitative easing increases the money supply by flooding financial institutions with capital in an effort to promote increased lending and liquidity.
The Federal Open Market Committee (FOMC), a committee within the Federal Reserve System, is charged under the United States law with overseeing the nation’s open market operations (i.e., the Fed’s buying and selling of United States Treasure securities).
This research material has been prepared by LPL Financial.
To the extent you are receiving investment advice from a separately registered independent investment advisor, please note that LPL Financial is not an affiliate of and makes no representation with respect to such entity.
Not FDIC/NCUA Insured | Not Bank/Credit Union Guaranteed | May Lose Value | Not Guaranteed by any Government Agency | Not a Bank/Credit Union Deposit
Member FINRA/SIPC