What constitutes a substantial improvement in the labor market?
On Wednesday, March 20, 2013, Federal Reserve (Fed) Chairman Ben Bernanke held the first of four press conferences scheduled for this year at the conclusion of the Federal Open Market Committee’s (FOMC) meetings on March 20, June 19, September 18, and December 18, 2013. While Bernanke’s Q&A session generated plenty of headlines (and tweets), he really did not say anything the market did not already know about the Fed’s
view on the economy, the fiscal situation, and more importantly, on monetary policy, and in particular, the latest round of bond purchases, quantitative easing (QE3).
Bernanke did, however, remind market participants of both the benefits:
- “…putting downward pressure on longer-term interest rates, including mortgage rates” which continues “to provide meaningful support to economic growth and job creation…”
and the costs:
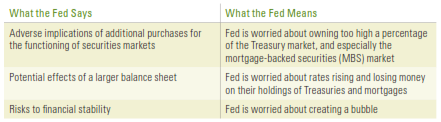
- “adverse implications of additional purchases for the functioning of securities markets…”
- “…the potential effects — under various scenarios — of a larger balance sheet on the Federal Reserve’s earnings from its asset holdings and, hence, on its remittances to the Treasury.”
- ”…risks to financial stability, such as might arise if persistently low rates lead some market participants to take on excessive risk in a reach for yield.”
of continuing QE3. In his prepared remarks just prior to answering reporters’ questions, Bernanke also made a point of reminding markets that the thresholds the Fed has set up for eventually raising rates — unemployment rate below 6.5% and inflation not higher than 2.5% — were not triggers, suggesting that the Fed may wait a while after these thresholds are crossed before raising rates.

The first question asked of Bernanke was whether or not the FOMC had spent any time discussing thresholds for ending or changing the pace of QE3. Bernanke noted that the problem was “complex” but that the FOMC was:
“...looking for sustained improvement in a range of key labor market indicators, including obviously payrolls, unemployment rate, but also others like the hiring rate, the claims for unemployment insurance, quit rates, wage rates, and so on. We’re looking for sustained improvement across a range of indicators and in a way that’s taking place throughout the economy. And since we’re looking at the outlook, we’re looking at the prospects rather than the current state of the labor market, we’ ll also be looking at things like growth to try to understand whether there’s sufficient momentum in the economy to provide demand for labor going forward.”
The list of labor market indicators mentioned by Bernanke was basically the same list cited by Fed Vice Chairwoman Janet Yellen — who is a leading candidate to replace Bernanke when his term as Chairman ends on January 31, 2014 — in a speech she gave in early March 2013 to the National Association of Business Economists in Washington, D.C. Yellen’s list included:
- The unemployment rate;
- Payroll employment;
- The hiring rate;
- Layoffs/discharges as a share of total job separations;
- The “quit” rate as a share of total job separations; and
- Spending and growth in the economy. Yellen noted specifically that:
“I also intend to consider my forecast of the overall pace of when it is not accompanied by sufficiently strong growth, may not indicate a substantial improvement in the labor market outlook. Similarly, a convincing pickup in growth that is expected to be sustained could prompt a determination that the outlook for the labor market had substantially improved even absent any substantial decline at that point in the unemployment rate.”
Essentially, Yellen (who along with being one of the leading candidates to replace Bernanke as Fed chairman, is also at the Fed’s “center of gravity,”
with Bernanke and New York Fed President Bill Dudley) is saying that the
FOMC will need to see strong performance of the labor market AND solid gross domestic product (GDP) growth before it begins to scale back or eliminate QE.
Figures 1 – 5 show the labor market indicators mentioned by Bernanke last week and Yellen in early March. A quick review of the figures suggests that Yellen and Bernanke — two of the three FOMC members of the “center of gravity” at the Fed — are not yet ready to begin scaling back QE.

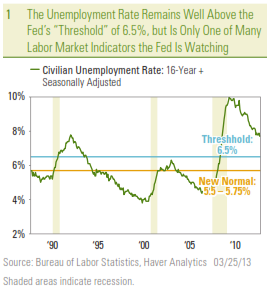
- While down from the peaks seen during the Great Recession of 2008 – 2009, at 7.8%, the unemployment rate remains well above the 6.5% threshold for raising rates, and also well above the 5.5 – 5.75% rate the FOMC forecasts as the new normal unemployment rate.
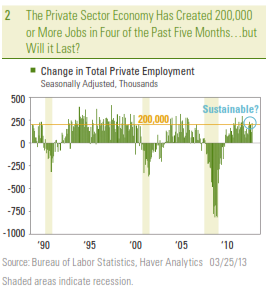
- It is well documented that the private sector economy has created more than 200,000 jobs in four of the past five months. However, the labor market turned in a similar performance in late 2011 and early 2012, only to see a marked slowdown in job creation over the spring and summer of 2012. Bernanke mentioned this during his Q&A, noting, “So I think an important criterion would be not just the improvement (in the labor market) that we’ve seen, but is it going to be sustained for a number of months?”

- At 3.6%, the hiring rate — the level of new hiring as a percent of total employment measured from the JOLTS data (see box on page5) — remains depressed, and well below the 4.5 – 5.0% hire rate seen prior to the onset of the Great Recession in 2007. In her March 4, 2013 speech, Yellen noted, “the hiring rate remains depressed. Therefore, going forward, I would look for an increase in the rate of hiring.”
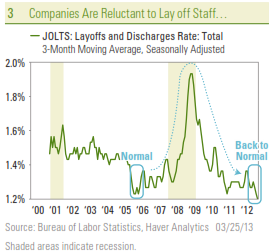
- In that same speech, Yellen noted “layoffs and discharges as a share of total employment have already returned to their pre-recession level”. Indeed, Figure 3 shows that the discharge rate, at 1.2%, is very close to an all-time low. A good proxy for this metric is the level of initial claims and the monthly Challenger layoff data, both of which continue to show that companies are reluctant to shed more workers at this point in the business cycle.
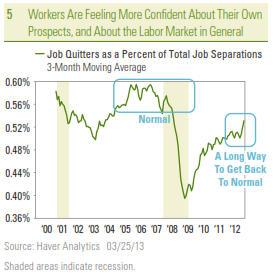
- The quit rate measures the percentage of people who leave their jobs voluntarily, presumably because they are confident enough in their own skills — or in the health of the economy — to find another job. In the three months ending in January 2013 (the latest data available), 53% of the people who were “separated” from their jobs (laid off, fired, retired, or left voluntarily) were job quitters. This was the highest reading on this metric since mid-2008, but remains well below its pre-Great Recession “normal” of 56 – 60%. Commenting on this metric in her March 4, 2013 speech, Yellen noted “a pickup in the quit rate, which also remains at a low level, would signal that workers perceive that their chances to be rehired are good — in other words, that labor demand has strengthened.” The final metrics mentioned by Yellen — consumer spending and overall economic growth — both remain well below average, and indeed still point to an economy that is running at around two-thirds speed.
As this document was being prepared for publication on Monday, March 25, 2013, Bill Dudley, the third member of the “center of gravity” at the Fed also hinted at his reluctance to remove the stimulus too soon. On balance, Dudley’s comments, along with last week’s appearance from Ben Bernanke echoed comments made in early March 2013 by Fed Vice Chair Yellen, suggest that the “center of gravity” at the Fed is not yet convinced that there has been “substantial improvement” in the labor market or economy. This should give market participants comfort that the Fed is not likely to begin removing QE anytime soon, but also raises the risk that the Fed may wait too long to remove the stimulus, which could lead to higher inflation and higher interest rates in the future.
About the JOLTS Report
Each month, market participants and the financial media obsess over the monthly employment report from the Bureau of Labor Statistics ( BLS ) that details how many jobs were added in the economy, in what industries the jobs were added, how much workers were paid, and why workers were unemployed. That report is typically released on the first Friday of every month. On the other hand, the monthly report on job openings and labor turnover (the JOLTS data), released by the same government agency — the BLS — that releases the monthly jobs report, is met with little, if any, fanfare from the financial markets or the financial media. The JOLTS report does not get a lot of attention, mainly because it is dated. For example, the market got detailed information on the labor market for February 2013 on March 8, 2013 when the monthly employment report was released. The JOLTS report for February 2013 isn’t due out until April 9, 2013. The JOLTS data provide more insight into the inner workings of the labor market than the monthly employment report does. JOLTS provides data on:
- The number of job openings by economy-wide, by firm size, and by region;
- The number of new hires in a given month; and
- Job separations, and the various drivers of those separations (fired, laid off, retired, quit).
Please see our Weekly Economic Commentary from February 19, 2013 for more insights from the JOLTS report.
____________________________________________________________________
IMPORTANT DISCLOSURES
The opinions voiced in this material are for general information only and are not intended to provide specific advice or recommendations for any individual. To determine which investment (s) may be appropriate for you, consult your financial advisor prior to investing. All performance reference is historical and is no guarantee of future results. All indices are unmanaged and cannot be invested into directly.
The economic forecasts set forth in the presentation may not develop as predicted and there can be no guarantee that strategies promoted will be successful.
Gross domestic product (GDP) is the monetary value of all the finished goods and services produced within
a country’s borders in a specific time period, though GDP is usually calculated on an annual basis. It includes all of private and public consumption, government outlays, investments and exports less imports that occur within a defined territory.
Government bonds and Treasury Bills are guaranteed by the U.S. government as to the timely payment of principal and interest and, if held to maturity, offer a fixed rate of return and fixed principal value. However, the value of fund shares is not guaranteed and will fluctuate.
International investing involves special risks, such as currency fluctuation and political instability, and may not be suitable for all investors.
Mortgage Backed Securities are subject to credit, default, prepayment risk that acts much like call risk when you get your principal back sooner than the stated maturity, extension risk, the opposite of prepayment risk, market and interest rate risk.
Quantitative easing is a government monetary policy occasionally used to increase the money supply by buying government securities or other securities from the market. Quantitative easing increases the money supply by flooding financial institutions with capital in an effort to promote increased lending and liquidity.
The Federal Open Market Committee action known as Operation Twist began in 1961. The intent was to flatten the yield curve in order to promote capital inflows and strengthen the dollar. The Fed utilized open market operations to shorten the maturity of public debt in the open market. The action has subsequently been reexamined in isolation and found to have been more effective than originally thought. As a result of this reappraisal, similar action has been suggested as an alternative to quantitative easing by central banks.
The Federal Open Market Committee (FOMC), a committee within the Federal Reserve System, is charged under the United States law with overseeing the nation’s open market operations (i.e., the Fed’s buying and selling of United States Treasure securities).
Stock investing involves risk including loss of principal.
__________________________________________________________________
INDEX DESCRIPTIONS
The Chicago Area Purchasing Managers’ Index that is read on a monthly basis to gauge how manufacturing activity is performing. This index is a true snapshot of how manufacturing and corresponding businesses are performing for a given month. A reading of 50 or above is considered a positive reading. Anything below 50 is considered to indicate a decline in activity. Readings of the index have the ability to shift the day’s trading session one way or another based on the results.
Job Openings and Labor Turnover Survey (JOLTS) is a survey done by the United States Bureau of Labor Statistics to help measure job vacancies. It collects data from employers including retailers, manufacturers and different offices each month. Respondents to the survey answer quantitative and qualitative questions about their businesses’ employment, job openings, recruitment, hires and separations. The JOLTS data is published monthly and by region and industry.
__________________________________________________________________
This research material has been prepared by LPL Financial.
To the extent you are receiving investment advice from a separately registered independent investment advisor, please note that LPL Financial is not an affiliate of and makes no representation with respect to such entity.
Not FDIC/NCUA Insured | Not Bank/Credit Union Guaranteed | May Lose Value | Not Guaranteed by any Government Agency | Not a Bank/Credit Union Deposit