A widely expected move higher in bond yields has yet to materialize in 2014, and those expectations actually may help explain why yields have declined. Financial markets occasionally “zig” just when a growing majority expects a “zag.” Bonds are no exception, and many investors have been caught off guard by early 2014 bond strength. Although profit taking hit bonds on Monday, January 27, 2014, the Barclays Aggregate Bond Index is still up over 1% year to date. After dropping as low as 2.71% last Friday, the 10-year Treasury yield closed Monday, January 27, 2014 at 2.76%, still 0.27% lower in just over three weeks of trading this year — a significant move.
Lopsided sentiment can often drive contrarian moves by financial markets, especially in the bond market. One indicator that captured the overwhelmingly negative sentiment on bonds was the Commitments of Traders report, which is issued weekly by the U.S. Commodity Futures Trading Commission (CFTC). The CFTC Commitments of Traders report includes the net positioning of speculative investors across a variety of futures contracts. Observing whether speculative investors are net long (betting on higher prices) or net short (betting on lower prices) can reveal positioning of institutional speculative investors.
In late 2013, the CFTC report showed one of the largest net short positions on record in 10-year Treasury futures, indicating that the market was expecting rates to rise. The near 200,000 net short position was a level witnessed only rarely over the past 10 years [Figure 1]. These extremes have

often coincided with contrarian rallies as evidenced by the shaded areas. As prices rise and yields decline, speculative investors scramble to cover their short positions for fear of incurring losses. The rush to exit positions can be a powerful force and, here in early 2014, the subsequent buying has helped propel the bond market higher.
This contrarian indicator can help explain pullbacks as well. The buildup of long positions in early 2013 to some of the highest levels of the past few years coincided with the 2013 bond pullback and rise in yields.
At the same time, the indicator is not foolproof, and a significant net long position prior to the 2007 – 08 financial crisis coincided with a long decline in yields. In addition, the CFTC data are released with a slight lag meaning sentiment may have shifted, but it does help explain market moves. The CFTC report is just one tool to assess sentiment that may be offside and a lead to a contrarian move in the markets, but it needs to be evaluated in conjunction with other data.
Positioning
Positioning of short-term speculators is far from the only factor driving bond prices, and investor positioning appeared to corroborate the negative sentiment at the start of the year. The firm Stone & McCarthy Research Associates conducts a survey of bond investors to assess whether they are positioned short, neutral, or long relative to their broad benchmarks. A short or long bias would reveal investor expectations of rising or falling interest rates, respectively. In mid-January, Stone & McCarthy’s survey revealed investors on average were at 96.6% of their target interest rate sensitivity, or duration, the most defensive reading since the third quarter of 2008.
As bond prices rise and interest rates fall, defensively positioned investors may see their portfolios likely lag benchmark performance. Investors then would likely buy to get closer to their benchmark in order to limit underperformance to a benchmark. Bond buys to get portfolios closer to neutral may have aided bonds in early 2014.
When coupled with fundamental drivers, positioning and sentiment can be a potent combination. In early January 2014, a weaker-than-expected employment report sparked questions about the strength of the economy and bonds rallied, setting in motion a buying spree as wrong-footed investors reversed bets on lower bond prices. Pension investors also took advantage of yields near two-and-a-half-year highs and also gave bond prices a boost to start 2014 (please see blog post Why Own Bonds? 1/21/14 for more details).
Recent momentum was aided by a host of emerging market (EM) issues spurring buys of higher-quality assets like Treasuries. Weaker-than-expected economic growth from China, Turkey’s central bank’s attempt to stabilize its currency, political instability in the Ukraine, and Argentine currency devaluation all contributed to US Treasury demand.
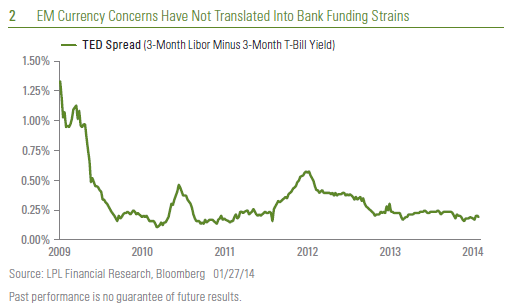
EM currency fears appear contained for now, however, with no signs of disruption in domestic intra-bank lending markets. The TED spread, a key gauge of inter-bank lending pressures during the 2007 – 08 financial crisis and several times during the European debt fears of recent years, has served as an early warning signal but is near a post-recession low for now [Figure 2], indicating no global contagion from EM currency weakness.
Where Do We Go From Here?
Although EM concerns may support high-quality bonds during the current week, the offside positioning in the bond market has been largely reversed. Figure 1 illustrates that while speculators may still be net short, positioning is much closer to neutral and away from an extreme. The most recent J.P. Morgan investor duration survey shows fewer participants “short” and a greater number now “neutral.”
This suggests that the fuel for additional price gains will likely need to come from fundamental data. The preponderance of economic data suggests the U.S. economy continues to expand near our expected pace of 3% (as measured by real gross domestic product) and that the weak employment report may have been an outlier, suggesting further bond gains may be limited. Bond investors may refocus on economic data now that positioning and sentiment appear more balanced.
Furthermore, this week’s auctions of new two-, five-, and seven-year Treasury securities may give investors pause after the recent run-up in prices. Add a Federal Reserve (Fed) meeting, and a bond market breather is likely until new information is digested. The Fed is also widely expected to announce a further $10 billion reduction in bond purchases at the conclusion of Wednesday’s Fed meeting. Both factors augur for higher yield probability over the course of the year.
____________________________________________________________________________________________________________________________
IMPORTANT DISCLOSURES
The opinions voiced in this material are for general information only and are not intended to provide specific advice or recommendations for any individual. To determine which investment(s) may be appropriate for you, consult your financial advisor prior to investing. All performance referenced is historical and is no guarantee of future results. All indices are unmanaged and cannot be invested into directly. Unmanaged index returns do not reflect fees, expenses, or sales charges. Index performance is not indicative of the performance of any investment. Past performance is no guarantee of future results.
This information is not intended to be a substitute for specific individualized tax advice. We suggest that you discuss your specific tax issues with a qualified tax advisor.
The economic forecasts set forth in the presentation may not develop as predicted and there can be no guarantee that strategies promoted will be successful.
Bonds are subject to market and interest rate risk if sold prior to maturity. Bond values and yields will decline as interest rates rise, and bonds are subject to availability and change in price.
Treasuries are marketable, fixed-interest U.S. government debt securities. Treasury bonds make interest payments semi-annually, and the income that holders receive is only taxed at the federal level.
Government bonds and Treasury bills are guaranteed by the U.S. government as to the timely payment of principal and interest and, if held to maturity, offer a fixed rate of return and fixed principal value. However, the value of fund shares is not guaranteed and will fluctuate.
International and emerging market investing involves special risks such as currency fluctuation and political instability and may not be suitable for all investors.
_____________________________________________________________________________________________________________________________
INDEX DESCRIPTIONS
The Barclays Aggregate Bond Index represents securities that are SEC-registered, taxable, and dollar denominated. The index covers the U.S. investment-grade fixed rate bond market, with index components for government and corporate securities, mortgage pass-through securities, and asset-backed securities.
_____________________________________________________________________________________________________________________________
This research material has been prepared by LPL Financial.
To the extent you are receiving investment advice from a separately registered independent investment advisor, please note that LPL Financial is not an affiliate of and makes no representation with respect to such entity.
Not FDIC/NCUA Insured | Not Bank/Credit Union Guaranteed | May Lose Value | Not Guaranteed by any Government Agency | Not a Bank/Credit Union Deposit
Member FINRA/SIPC

Trading Partners
September 3, 2013
The upward revision to second quarter gross domestic product (GDP) garnered a great deal of market attention last week (August 26 – 30, 2013). The report, released on Thursday, August 29, revealed that second quarter GDP — initially reported in late July 2013 as a 1.7% gain — was revised higher to a 2.5% gain. All of the upward revision to second quarter GDP can be explained by a narrower trade deficit. Initially, the trade deficit in the second quarter was reported as $451 billion, a 0.8% drag on overall GDP growth. Now, the revised data show that the trade gap stood at “only” 422 billion in the second quarter — the same as in the first quarter of 2013 — and as a result, the economic drag from trade for the quarter was eliminated. Looking ahead to the third quarter of 2013 and beyond, market participants and policymakers are asking: Can trade make a significant positive contribution to GDP growth in the quarters ahead, given the outlook for growth in Europe, China, Japan, and emerging markets?
Tracking the Pace of U.S. GDP Growth
While second quarter GDP was revised higher, the first quarter was not subject to revision and remained at 1.1%, leaving GDP growth in the first half of 2013 at a tepid 1.8%. The Federal Reserve (Fed) is still forecasting a 2.45% gain in GDP this year. With 1.8% growth in real GDP in the first half of the year, real GDP would have to grow by more than 3.0% in the third and fourth quarters of 2013 to match the Fed’s consensus forecast for the year. The Fed will release a revised forecast for the economy, labor markets, and inflation for 2013, 2014, and 2015 on September 18, 2013 at the conclusion of the next Federal Open Market Committee (FOMC) meeting. The FOMC is likely to revise downward its 2013 GDP growth forecast. The new forecast, along with the release of the FOMC’s initial public forecast for the economy, inflation, and the labor market in 2016 (also due on September 18), may help to soothe market fears about the pace of tapering and tightening.
The data in hand for the first two months of the third quarter of 2013 suggest that third quarter GDP is tracking to well under 2%, and may be closer to 1%. The data released thus far for the third quarter of 2013 include:
Data due out this week (September 2 – 6, 2013) on vehicle sales, the Institute for Supply Management (ISM) Purchasing Managers’ Index (PMI), merchandise trade, construction spending, factory shipments and inventories for July and August 2013, and, of course, the August employment report (due out on Friday, September 6) will help to further clarify the pace of GDP growth in the current quarter, the rest of 2013, and into 2014.
GDP Overseas
Data released over the past several months suggest that the economies in Europe and China have stabilized. Meanwhile, market participants have increased their GDP growth forecasts for Japan over the past nine months, as Japanese policymakers have ramped up monetary and fiscal policy and embarked on a series of structural reforms aimed at jarring Japan’s economy out of a multi-decade slumber. Our view remains that while the economies in China and Europe have stopped getting worse, it may take several more quarters before they can meaningfully re-accelerate. While growth has picked up in Japan — second quarter GDP growth in Japan was 2.6% — it remains disappointing relative to elevated expectations. In addition, many emerging market nations (about 50% of U.S. exports head to emerging markets), including India, Brazil, and Indonesia are now experiencing growth and inflation scares, and some (Brazil and Indonesia) are raising interest rates to head off inflation. Many of the market participants and Fed policymakers who expect U.S. GDP to accelerate in the second half of 2013 and in 2014 are likely counting on accelerating growth in Europe, China, Japan, and emerging markets to drive U.S. exports higher. But is that enough to boost U.S. GDP growth?
As noted in our Weekly Economic Commentary: Exporting Good Old American Know-How, from August 19, 2013, the United States has run a trade deficit (importing more goods and services from other countries than it exports) since the mid-1970s, and our large deficit on the goods side (around $759 billion in 2012) more than offsets the trade surplus we have on the service side of the ledger (around $213 billion in 2012). Combined, our goods and services trade deficit was $547 billion in 2012, slightly smaller than the $569 billion deficit in 2011. As a result of the slight narrowing of the deficit between 2011 and 2012, net exports contributed 0.1% to the 2.8% gain in GDP in 2012.
Net Exports Typically Do Not Boost U.S. GDP Growth
The infographic on page 2, “Profile of U.S. Exports” (Profile) reveals that over the past 40 years — aside from recessions (when imports fall faster than exports, narrowing the trade deficit) — net exports have never added more than 1.0% to overall GDP growth. Thus, even if the economies of Europe, China, Japan, and emerging markets accelerate sharply in the next few quarters, it is unlikely that net exports will provide a large boost to GDP growth this year.
In theory, an unexpected uptick in economic activity among our largest export destinations should be a plus for our exports to that region, but in practice, the impact to our trade balance and economy may not immediately reflect the better growth prospects overseas. In addition, exchange rate movements also can influence cross-border trade, but movements often work with a long lag. Since many of our exports do not compete on price, the value of the dollar is not always the best way to gauge the relative strength of our exports to many markets. Generally speaking, U.S. exports compete globally on quality, rather than price.
Export Destinations: Economic Prospects in Canada and Mexico
The Profile details the destinations (trading partners) and mix (goods versus services) of our exports. Fourteen percent of our exports (both goods and services) are bound for the Eurozone, while just 6% head to China. Remarkably, only 5% of our exports go to Japan. Combined, our exports to the Eurozone, Japan, and China account for 25% of our total exports. Closer to home, 16% of our exports head north of the border to Canada, and another 11% head south of the border to Mexico. Thus, our exports to our two closest neighbors (27% of all exports) are larger than our exports to the Eurozone, Japan, and China combined (25%). Accordingly, market participants should probably pay more attention to the economic prospects of Canada and Mexico and a bit less to the prospects of China, the Eurozone, and Japan.
Mix of Goods/Services: Goods Are 70% of All Exports
The Profile also details the goods/services mix of our exports. Currently, goods account for around 70% of all exports, but that varies widely by trading partner. The export mix to Canada and Mexico is skewed toward goods rather than services, which is partially explained by auto production, since auto parts factories and final assembly plants account for such a large portion of trade. Our export mix to the Eurozone, China, and Japan is…well… more mixed. Services, at around 40%, account for more of our trade to the Eurozone and Japan than in our overall trade mix. In China, however, an above-average 78% of our exports are goods. All else being equal, an unexpected and permanent shift higher in economic growth for trading partners like China, the Eurozone, and Japan should boost our exports to those nations over time and, in turn, our GDP. But it is important to note that outside of recessions, net exports rarely add more than 0.5% to GDP growth. So while we spend a great deal of time discussing the health of the economy in China, the Eurozone, Japan, and emerging markets, the economic prospects of our nearest neighbors (Canada and Mexico) have a bigger influence on our overall exports.
______________________________________________________________________________________________________________________________________________________________________________
IMPORTANT DISCLOSURES
The opinions voiced in this material are for general information only and are not intended to provide specific advice or recommendations for any individual. To determine which investment(s) may be appropriate for you, consult your financial advisor prior to investing. All performance reference is historical and is no guarantee of future results. All indices are unmanaged and cannot be invested into directly.
Gross domestic product (GDP) is the monetary value of all the finished goods and services produced within a country’s borders in a specific time period, though GDP is usually calculated on an annual basis. It includes all of private and public consumption, government outlays, investments and exports less imports that occur within a defined territory.
The economic forecasts set forth in the presentation may not develop as predicted and there can be no guarantee that strategies promoted will be successful.
International investing involves special risks, such as currency fluctuation and political instability, and may not be suitable for all investors.
Purchasing Managers Index (PMI) is an indicator of the economic health of the manufacturing sector. The PMI index is based on five major indicators: new orders, inventory levels, production, supplier deliveries and the employment environment.
Markit is a leading, global financial information services company that provides independent data, valuations and trade processing across all asset classes in order to enhance transparency, reduce risk and improve operational efficiency. The Markit Purchasing Managers’ Index (PMIT) is a composite index based on five of the individual indexes with the following weights: New Orders – 0.3, Output – 0.25, Employment – 0.2, Suppliers’ Delivery Times – 0.15, Stocks of Items Purchased – 0.1, with the Delivery Times Index inverted so that it moves in a comparable direction.
The Institute for Supply Management (ISM) index is based on surveys of more than 300 manufacturing firms by the Institute of Supply Management. The ISM Manufacturing Index monitors employment, production inventories, new orders, and supplier deliveries. A composite diffusion index is created that monitors conditions in national manufacturing based on the data from these surveys.
Challenger, Gray & Christmas is the oldest executive outplacement firm in the United States. The firm conducts regular surveys and issues reports on the state of the economy, employment, job-seeking, layoffs, and executive compensation.
This research material has been prepared by LPL Financial.
To the extent you are receiving investment advice from a separately registered independent investment advisor, please note that LPL Financial is not an affiliate of and makes no representation with respect to such entity.
Not FDIC/NCUA Insured | Not Bank/Credit Union Guaranteed | May Lose Value | Not Guaranteed by any Government Agency | Not a Bank/Credit Union Deposit
Member FINRA/SIPC
Posted in Brazil, China, Durable goods, Emerging Markets, Employment, Europe, Eurozone, Exports, Federal Open Market Committee (FOMC), Federal Reserve, GDP - Gross Domestic Product, Goods and Services, India, Institute for Supply Management (ISM), Mexico, Retail Sales, Unemployment, Weekly Economic Commentary | Tagged: Brazil, China, Congress, Durable goods, Emerging markets, employment, Europe, Eurozone, Exports, Fed, federal open market committee, federal reserve, GDP, Goods and Services, India, Institute for Supply Management (ISM), Mexico, Retail Sales, unemployment, Weekly Economic Commentary | Leave a Comment »