Navigating the Markets
April 23, 2013

Navigating the Markets

Compass Changes

  • ƒUpgraded health care to neutral from negative/neutral
  • Upgraded emerging market debt to neutral/positive from neutral
  • Upgraded oil commodity from neutral/negative to neutral
  • Downgraded precious metals commodities from neutral/positive to neutral
  • Downgraded technology from neutral/positive to neutral

Investment Takeaways

  • ƒOur near-term stock market view is slightly cautious, given our Base Path expectation for modest single-digit returns in 2013.*
  • We continue to favor cyclical sectors over defensives over the balance of the year, but our near-term views are balanced.
  • Higher-yielding, fundamentally sound segments of the bond market remain attractive, but low yields and valuations temper our enthusiasm.
  • We upgraded our emerging market debt view following under performance during the first quarter.
  • We see the oil commodity as near fair value following the latest correction, while deteriorating technicals drive our lowered precious metals view.
  • From a technical perspective, the S&P 500 may turn lower over the next few weeks; next support is at 1540, followed by 1500.

Bond_Class_Views

Broad Asset Class Views

LPL Financial Research’s views on stocks, bonds, cash, and alternatives are illustrated below. The positions of negative, neutral, or positive are indicated by the solid black compass needle, while an outlined needle shows a previous view.

Equity & Alternative Asset Classes

Maintain Slightly Cautious Stock Market View as S&P 500 Remains Near All-Time Highs

Our near-term stock market view is slightly cautious, given our Base Path expectation for modest single-digit returns in 2013.*
ƒ
Our views are generally aligned across market cap, with a slight preference for large and mid caps. In our Base Path scenario in Outlook 2013, we expect the market to favor the stability, lower valuations, and higher yields associated with large caps.
ƒ
We maintain a modest preference for growth over value due to growth’s potential to perform well in slow-growth environments, although our conviction has lessened as our sector views have become more balanced.
ƒ
Our neutral emerging markets (EM) view reflects higher near-term risks as China implements measures to curb its property markets and has produced uneven growth.
ƒ
Our large foreign view is neutral. Although bold policy actions and valuations are supportive, and the outlook in Japan has improved, Europe remains mired in recession and the Eurozone debt crisis is not yet over.
ƒ
Fed policy remains supportive of precious metals, but US dollar gains, little inflation pressure, and the rotation into equities have driven a technical breakdown in the gold commodity price.
ƒ
Now that the oil commodity has pulled back into the high $80s, we believe it is near fair value.

Image_1

Image_2

Image_3

All performance referenced herein is as of April 16, 2013, unless otherwise noted. * LPL Financial Research provided these forecasts based on: a low-single-digit earnings growth rate supported by modest share buybacks combined with 2% dividend yields and little change in valuations for the S&P 500. Please see our Outlook 2013 for details.

Real Estate/REITs may result in potential illiquidity and there is no assurance the objectives of the program will be attained. The fast price swings of commodities will result in significant volatility in an investor’s holdings. International and emerging markets involve special risks such as currency fluctuation and political instability. The price of small and mid-cap stocks are generally more volatile than large capstocks. Value investments can perform differently from the market as a whole. They can remain undervalued by the market for long periods of time. Precious metal investing is subject to substantial fluctuation and potential for loss. These securities may not be suitable for all investors. Alternative strategies may not be suitable for all investors and should be considered as an investment for the risk capital portion of  the investor’s portfolio. The strategies employed in the management of alternative investments may accelerate the velocity of potential losses. Stock investing may involve risk including loss of principal.

Equity Sectors

More Balanced Sector Mix After Health Care Upgrade to Neutral

We continue to favor cyclical sectors over defensives over the balance of the year, but our near-term views are balanced as we anticipate a modest pullback in the S&P 500.

While we continue to expect a pickup in business spending, our lowered technology view reflects a weaker earnings outlook and deteriorating technicals. Industrials is our favored way to play a potential pickup in business spending.

Our recent decision to lower our materials view reflected the risk to China’s growth and strength in the US dollar amid concerns that the Federal Reserve (Fed) will soon pare back  stimulus.

Our energy view remains neutral due to our expectation that elevated inventories will prevent a rebound in crude oil prices from current levels in the high $80s.

Our upgraded, neutral health care view reflects our desire to balance out the economic sensitivity of our sector mix, policy clarity, and a strong technical picture.

Our utilities view is modestly negative due to interest rate risk and rich valuations, although our outlook is less negative amid improved technicals.

Our consumer staples view is neutral despite rich valuations due to the potential to benefit from lower commodity prices and the potential for a pullback.

Our financials view is modestly negative. Bank fundamentals have improved some, but the challenging regulatory and interest rate environment persists and loan growth is stalling.

Equity_Sectors_Graphic

Because of their narrow focus, sector investing will be subject to greater volatility than investing more broadly across many sectors and companies.

Fixed Income

Focus on Higher-Yielding Segments Due to Better Valuation and as Buffer Against Rise in Rates

  • A range-bound environment persists in the bond market. Lingering uncertainties augur for a stable rate environment, which favors intermediate bonds that still possess a substantial yield advantage relative to short-term bonds.
  • By committing to refrain from raising interest rates until unemployment falls to 6.5%, intermediate maturity bonds may also benefit from Fed policy as investors seek higher yields amid a low-yield world.
  • We continue to find municipal bonds among the more attractive high-quality bond options, and valuations remain attractive following a difficult March.

Focus on Higher-Yielding Segments Due to Better Valuation and as Buffer Against Rise in Rates

  • We upgrade emerging market debt following underperformance during the first quarter relative to other higher-yielding segments of the bond market, thereby providing an opportunity for investors.
  • Higher-yielding, fundamentally sound segments of the bond market such as high-yield bonds, bank loans, and preferred securities remain attractive, but we temper our enthusiasm due to a strong start to 2013. Lower yields and higher valuations augur for lower returns going forward.
  • Bank loans remain attractive due to a much narrower yield differential to high-yield bonds.

Fixed_Income_Graphic

All bonds are subject to market and interest rate risk if sold prior to maturity. Bond values will decline as interest rates rise and are subject to availably and change in price. High-yield/junk bonds are not investment-grade securities, involve substantial risks, and generally should be part of the diversified portfolio of sophisticated investors. Mortgage-backed securities are subject to credit, default risk, prepayment risk that acts much like call risk when you get your principal back sooner than the stated maturity, extension risk, the opposite of prepayment risk, and interest rate risk. International and emerging market investing involves risks such as currency fluctuation and political instability and may not be suitable for all investors. Bank loans are loans issued by below investment-grade companies for short term funding purposes with higher yield than short-term debt and involve risk. Treasury inflation-protected securities (TIPS) help eliminate inflation risk to your portfolio as the principal is adjusted semiannually for inflation based on the Consumer Price Index – while providing a real rate of return guaranteed by the U.S. government. Corporate bonds are considered higher risk than government bonds but normally offer a higher yield and are subject to market, interest rate and credit risk as well as additional risks based on the quality of issuer coupon rate, price, yield, maturity and redemption features. Foreign Bonds – Hedged: Non-U.S. fixed income securities generally from investment-grade issuers in developed countries, with hedged currency exposure. Foreign Bonds – Unhedged: Non-U.S. fixed income securities normally denominated in major foreign currencies.

DEFINITIONS:

EQUITY AND ALTERNATIVES ASSET CLASSES
Large Growth: Stocks in the top 70% of the capitalization of the U.S. equity market are defined as Large Cap. Growth is defined based on fast growth (high growth rates for earnings,
sales, book value, and cash flow) and high valuations (high price ratios and low dividend yields).

Large Value: Stocks in the top 70% of the capitalization of the U.S. equity market are defined as Large Cap. Value is defined based on low valuations (low price ratios and high dividend
yields) and slow growth (low growth rates for earnings, sales, book value, and cash flow).

Mid Growth: The U.S. mid-cap range for market capitalization typically falls between $1 billion and $8 billion and represents 20% of the total capitalization of the U.S. equity market.
Growth is defined based on fast growth (high growth rates for earnings, sales, book value, and cash flow) and high valuations (high price ratios and low dividend yields).

Mid Value: The U.S. Mid Cap range for market capitalization typically falls between $1 billion and $8 billion and represents 20% of the total capitalization of the U.S. equity market. Value
is defined based on low valuations (low price ratios and high dividend yields) and slow growth (low growth rates for earnings, sales, book value, and cash flow).

Small Growth: Stocks in the bottom 10% of the capitalization of the U.S. equity market are defined as Small Cap. Growth is defined based on fast growth (high growth rates for earnings,
sales, book value, and cash flow) and high valuations (high price ratios and low dividend yields).

Small Value: Stocks in the bottom 10% of the capitalization of the U.S. equity market are defined as Small Cap. Value is defined based on low valuations (low price ratios and high
dividend yields) and slow growth (low growth rates for earnings, sales, book value, and cash flow).

U.S. Stocks: Stock of companies domiciled in the U.S.

Large Foreign: Large-cap foreign stocks have market capitalizations greater than $5 billion. The majority of the holdings in the large foreign category are in the MSCI EAFE Index.
Small Foreign: Small-cap foreign stocks typically have market capitalizations of $250M to $1B. The majority of the holdings in the small foreign category are in the MSCI Small Cap EAFE Index.

Emerging Markets: Stocks of a single developing country or a grouping of developing countries. For the most part, these countries are in Eastern Europe, Africa, the Middle East, Latin
America, the Far East and Asia.

REITs: REITs are companies that develop and manage real-estate properties. There are several different types of REITs, including apartment, factory-outlet, health-care, hotel, industrial, mortgage, office, and shopping center REITs. This would also include real-estate operating companies.

Commodities – Industrial Metals: Stocks in companies that mine base metals such as copper, aluminum and iron ore. Also included are the actual metals themselves. Industrial metals
companies are typically based in North America, Australia, or South Africa.

Commodities – Precious Metals: Stocks of companies that do gold- silver-, platinum-, and base-metal-mining. Precious-metals companies are typically based in North America, Australia, or South Africa.

Commodities – Energy: Stocks of companies that focus on integrated energy, oil & gas services, oil & gas exploration and equipment. Public energy companies are typically based in North America, Europe, the UK, and Latin America.

Merger Arbitrage is a hedge fund strategy in which the stocks of two merging companies are simultaneously bought and sold to create a riskless profit. A merger arbitrageur looks at
the risk that the merger deal will not close on time, or at all. Because of this slight uncertainty, the target company’s stock will typically sell at a discount to the price that the combined
company will have when the merger is closed. This discrepancy is the arbitrageur’s profit.

Long/Short is an investment strategy generally associated with hedge funds. It involves buying long equities that are expected to increase in value and selling short equities that are
expected to decrease in value.

EQUITY SECTORS

Materials: Companies that engage in a wide range of commodity-related manufacturing. Included in this sector are companies that manufacture chemicals, construction materials, glass,
paper, forest products and related packaging products, metals, minerals and mining companies, including producers of steel.

Energy: Companies whose businesses are dominated by either of the following activities: The construction or provision of oil rigs, drilling equipment and other energy-related service and equipment, including seismic data collection or the exploration, production, marketing, refining and/or transportation of oil and gas products, coal and consumable fuels.

Industrials: Companies whose businesses: Manufacture and distribute capital goods, including aerospace and defense, construction, engineering and building products, electrical
equipment and industrial machinery; provide commercial services and supplies, including printing, employment, environmental and office services; provide transportation services,
including airlines, couriers, marine, road and rail, and transportation infrastructure.

Consumer Discretionary: Companies that tend to be the most sensitive to economic cycles. Its manufacturing segment includes automotive, household durable goods, textiles and apparel, and leisure equipment. The service segment includes hotels, restaurants and other leisure facilities, media production and services, consumer retailing and services and education services.

Technology: Companies that primarily develop software in various fields such as the Internet, applications, systems and/or database management and companies that provide information technology consulting and services. Technology hardware & equipment include manufacturers and distributors of communications equipment, computers and peripherals, electronic equipment and related instruments, and semiconductor equipment and products.

Financials: Companies involved in activities such as banking, consumer finance, investment banking and brokerage, asset management, insurance and investment, and real estate, including REITs.

Utilities: Companies considered electric, gas or water utilities, or companies that operate as independent producers and/or distributors of power.

Health Care: Companies in two main industry groups: Healthcare equipment and supplies or companies that provide healthcare-related services, including distributors of healthcare
products, providers of basic healthcare services, and owners and operators of healthcare facilities and organizations or companies primarily involved in the research, development,
production and marketing of pharmaceuticals and biotechnology products.

Consumer Staples: Companies whose businesses are less sensitive to economic cycles. It includes manufacturers and distributors of food, beverages and tobacco, and producers of non-durable household goods and personal products. It also includes food and drug retailing companies.

Telecommunications: Companies that provide communications services primarily through a fixed line, cellular, wireless, high bandwidth and/or fiber-optic cable network.

FIXED INCOME

Credit Quality: An individual bond’s credit rating is determined by private independent rating agencies such as Standard & Poor’s, Moody’s and Fitch. Their credit quality designations
range from high (‘AAA’ to ‘AA’) to medium (‘A’ to ‘BBB’) to low (‘BB’, ‘B’, ‘CCC’, ‘CC’ to ‘C’).

Duration: A measure of the sensitivity of the price (the value of principal) of a fixed-income investment to a change in interest rates. Duration is expressed as a number of years. Rising
interest rates mean falling bond prices, while declining interest rates mean rising bond prices. The bigger the duration number, the greater the interest-rate risk or reward for bond prices.

Munis – Short-term: Bonds issued by various state and local governments to fund public projects. The income from these bonds is generally free from federal taxes. These bonds generally have maturities of less than three years.

Munis – Intermediate: Bonds issued by various state and local governments to fund public projects. The income from these bonds is generally free from federal taxes. These bonds
generally have maturities of between 3 and 10 years.

Munis – Long-term: Bonds issued by various state and local governments to fund public projects. The income from these bonds is generally free from federal taxes. These bonds generally
have maturities of more than 10 years.

Munis – High-yield: Bonds issued by various state and local governments to fund public projects. The income from these bonds is generally free from federal taxes. These bonds generally
offer higher yields than other types of bonds, but they are also more vulnerable to economic and credit risk. These bonds are rated BB+ and below.
Treasuries: A marketable, fixed-interest U.S. government debt security. Treasury bonds make interest payments semi-annually and the income that holders receive is only taxed at the federal level.

TIPS (Treasury Inflation Protected Securities): A special type of Treasury note or bond that offers protection from inflation. Like other Treasuries, an inflation-indexed security pays interest every six months and pays the principal when the security matures. The difference is that the underlying principal is automatically adjusted for inflation as measured by the consumer price index (CPI).

Mortgage-Backed Securities: A type of asset-backed security that is secured by a mortgage or collection of mortgages. These securities must also be grouped in one of the top two ratings as determined by a accredited credit rating agency, and usually pay periodic payments that are similar to coupon payments. Furthermore, the mortgage must have originated from a regulated and authorized financial institution.

Investment-Grade Corporates: Securities issued by corporations with a credit ratning of BBB- or higher. Bond rating firms, such as Standard & Poor’s, use different designations consisting of upper- and lower-case letters ‘A’ and ‘B’ to identify a bond’s investment-grade credit quality rating. ‘AAA’ and ‘AA’ (high credit quality) and ‘A’ and ‘BBB’ (medium credit quality) are considered investment-grade.

Preferred Stocks: A class of ownership in a corporation that has a higher claim on the assets and earnings than common stock. Preferred stock generally has a dividend that must be paid
out before dividends to common stockholders and the shares usually do not have voting rights.

High-Yield Corporates: Securities issued by corporations with a credit rating of BB+ and below. These bonds generally offer higher yields than investment-grade bonds, but they are also
more vulnerable to economic and credit risk.

Bank Loans: In exchange for their credit risk, these floating-rate bank loans offer interest payments that typically float above a common short-term benchmark such as the London
interbank offered rate, or LIBOR.

Foreign Bonds – Hedged: Non-U.S. fixed income securities generally from investment-grade issuers in developed countries, with hedged currency exposure.

Foreign Bonds – Unhedged: Non-U.S. fixed income securities normally denominated in major foreign currencies.

Emerging Market Debt: The debt of sovereigns, agencies, local issues, and corporations of emerging markets countries and subject to currency risk.

______________________________________________________________________________________________________________________________________________

IMPORTANT DISCLOSURES

The opinions voiced in this material are for general information only and are not intended to provide or be construed as providing specific investment advice or recommendations for any individual. To determine which investments may be appropriate for you, consult your financial advisor prior to investing. All performance referenced is historical and is no guarantee of future results. All indexes are unmanaged and cannot be invested into directly.

Past performance is no guarantee of future results.

For the purposes of this publication, intermediate-term bonds have maturities between 3 and
Stock investing involves risk including loss of principal.

Preferred stock investing involves risk, which may include loss of principal.

Distressed investing involves significant risks, including a total loss of capital. The risks associated with distressed investing arise from several factors including: limited diversification,
the use of leverage, limited liquidity, and the possibility that investors may be required to accept cash or securities with a value less than their original investment and/or may be required to accept payment over an extended period of time.

The Standard & Poor’s 500 Index is a capitalization-weighted index of 500 stocks designed to measure performance of the broad domestic economy through changes in the aggregate
market value of 500 stocks representing all major industries.

This research material has been prepared by LPL Financial.

To the extent you are receiving investment advice from a separately registered independent investment advisor, please note that LPL Financial is not
an affiliate of and makes no representation with respect to such entity.

Not FDIC or NCUA/NCUSIF Insured | No Bank or Credit Union Guarantee | May Lose Value | Not Guaranteed by any Government Agency | Not a Bank/Credit Union Deposit

What’s Fueling Gasoline?
April 10, 2013

This week, markets digest a variety of reports on the U.S. economy in February, March, and April 2013. Of particular interest to market participants will be the reports on producer prices and retail sales for March — both due out on Friday, April 12. The Consumer Price Index (CPI) is due out next Tuesday, April 16, 2013. The price of gasoline will feature prominently in all three reports. This time of year, gasoline prices typically garner plenty of attention from the media with the approach of the unofficial summer driving season right around the corner. Readers often want to know:

  • How have gasoline prices behaved thus far in 2013, and what might they do in the months ahead?
  • How much gasoline do we use in the United States?
  • How big an influence do gas prices have on consumer spending and the overall economy?

How Have Gasoline Prices Behaved So Far in 2013?

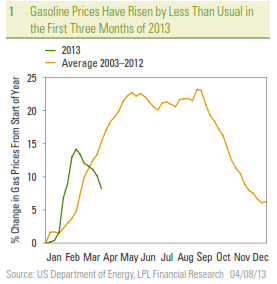
Gasoline prices are a product of global oil prices, federal, state, and local taxes, the cost of transporting the gasoline from refinery to filling station, and marketing costs. Prices can vary widely from region to region within the United States, and all prices in this report reflect the national average retail price for gasoline. Refinery shutdowns, refinery capacity, and differences in transportation and pipeline costs account for the U.S. regional differences in gasoline prices.  In the latest week, retail gasoline prices were $3.65 per gallon, and have declined by 20 cents per gallon over the past six weeks. While retail gasoline prices have increased by 28 cents per gallon this year, they remain 51 cents per gallon below the all-time high set in July 2008 at $4.16 per gallon. In a typical year, gasoline prices rise from January through the end of May, hit a plateau in the summer driving months of June, July, and August, and prices decline from the beginning of September through year-end.  Figure 1 shows that the price increase in gasoline in the first two months of 2013 was steeper than usual, but here in early April, the year-to-date price rise in gasoline prices has been more muted than usual.  Wholesale prices can often provide a window into what gasoline prices at the retail level will look like in a few weeks. Like gold, silver, copper, corn, wheat, etc., wholesale gasoline trades on commodity exchanges. Prices in the wholesale market have dropped 51 cents per gallon since mid February 2013, suggesting that the retail price is poised to drop by another $0.30 – 0.35 cents per gallon in the coming weeks, barring any major refinery outages or other disruptions. Wholesale gasoline prices are driven by global oil prices and supply and demand in the market place for gasoline from retail consumers, businesses, and government.

1_-_Gasoline_Prices_Have_Risen

How Much Gasoline Does the United States Use?

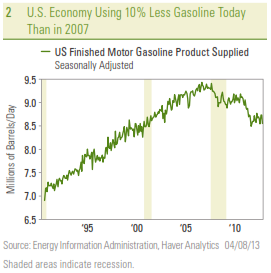
Each week, the Department of Energy produces the Weekly Petroleum Status Report (WPSR). The report has a variety of information on the nation’s petroleum industry, including  production, inventories, imports, exports, and prices. A key statistic in that report is the “gasoline supplied” figure, a good proxy for gasoline use (by all end users — consumers, businesses, industry, and government). On balance, the data reveals that the United States is using far less gasoline today than it did in 2007 [Figure 2]. In the last week of March 2013, the nation used 8.5 million barrels of gasoline per day, down 1 million barrels per day from the peak in January 2007, when the economy used 9.5 million barrels of gasoline per day. A combination of slowing economic growth, a slight increase in fuel economy among the nation’s vehicle fleet, and a sharp slowdown in miles driven (in part driven by an aging population) has helped to curtail U.S. gasoline use.

2_-_US_Economy_Using_10%_Less

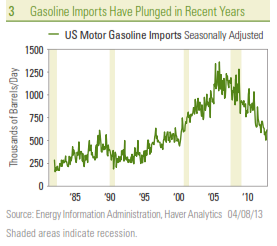
Gasoline imports (and exports) are also captured in the WPSR [Figure 3]. In March 2013, gasoline imports were around 600,000 barrels per day, levels not seen since the early 2000s. Some of the drop in imports in recent years is due to environmental standards and ethanol mandates, but our reliance on foreign gasoline is waning. Still, the vast majority (95%) of the gasoline we use is produced domestically.

3_-_Gasoline_Imports_Have_Plunged

Gasoline carries a weight of 5.5% in the CPI, an 8% weight in the Producer Price Index (PPI), and sales at gasoline service stations account for about 11% of retail sales. Although gasoline represents only a small portion of the most widely watched price indices and measures of consumer spending, spending on gasoline and gasoline prices garner plenty of attention in the media and from politicians. Why? Gasoline is one of those items (like groceries) that consumers see the price of almost every day, and most of us fill up our gas tanks regularly. Even small changes in gasoline prices can elicit plenty of news coverage and consumer backlash.

How Much Does Gasoline Influence Consumer Spending and the Overall Economy?

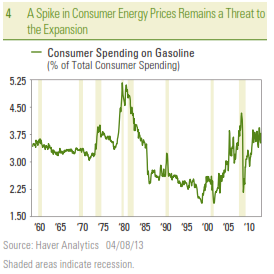
What consumers spend on gasoline is carefully measured by the U.S. Commerce Department’s personal income and spending report released each month. The last report (for February 2013) was released on March 28, 2013. This report revealed that consumers spent an annualized $431 billion on gasoline in February 2013. This was equal to 3.8% of total consumer spending ($1.1 trillion) in February 2013, and 3.2% of personal income ($1.4 trillion). At the peak of oil prices in 2008, 4.3% of U.S. consumer spending

LPL_Financial_Research_Weekly_Calendar

went to gasoline, and gasoline purchases were 3.2% of personal income. Both of these figures were well below the all-time peaks on these metrics hit during the early 1980s [Figure 4]. Another surge in energy prices relative to consumer income and spending remains a threat to the health and longevity of the current expansion, which will turn four years old in June 2013.

4_-_A_Spike_in_Consumer_Energy

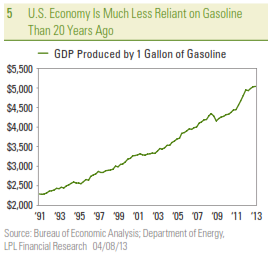
To put economy-wide gasoline use in perspective, in 1991, the U.S. economy used 7 million barrels per day of gasoline and produced gross domestic product (GDP) of $5.9 trillion, or put another way, produced $2,288 of GDP per gallon of gasoline used. In the first quarter of 2013, the U.S. economy used 8.7 millions of barrels of gasoline per day and produced $16 trillion in GDP, as the economy produced $5,036 in GDP for every gallon of gasoline used. Thus, looking back over the past 20-plus years, the U.S. economy’s output has nearly tripled, as gasoline usage increased by just 22%. In short, the U.S. economy has become much more gasoline efficient in the past 20 years, and this trend has been in place since the late 1970s/early 1980s [Figure 5]. Still, even with the emerging energy renaissance now underway, it may be years, or even decades — if ever — where the average U.S. consumer does not know (or care) what a gallon of gasoline costs.

5_-_US_Economy_is_Much_Less_Reliant

_________________________________________________________________________

IMPORTANT DISCLOSURES
The opinions voiced in this material are for general information only and are not intended to provide specific advice or recommendations for any individual. To determine which investment(s) may be appropriate for you, consult your financial advisor prior to investing. All performance reference is historical and is no guarantee of future results. All indices are unmanaged and cannot be invested into directly.

The economic forecasts set forth in the presentation may not develop as predicted and there can be no guarantee that strategies promoted will be successful.

Gross Domestic Product (GDP) is the monetary value of all the finished goods and services produced within a country’s borders in a specific time period, though GDP is usually calculated on an annual basis. It includes all of private and public consumption, government outlays, investments and exports less imports that occur within a defined territory.

Stock investing involves risk including loss of principal.

Commodity-linked investments may be more volatile and less liquid than the underlying instruments or measures, and their value may be affected by the performance of the overall commodities baskets as well as weather, disease, and regulatory developments.

The fast price swings in commodities and currencies will result in significant volatility in an investor’s holdings. Job Openings and Labor Turnover Survey (JOLTS) is a survey done by the United States Bureau of Labor Statistics to help measure job vacancies. It collects data from employers including retailers, manufacturers and different offices each month. Respondents to the survey answer quantitative and qualitative questions about their businesses’ employment, job openings, recruitment, hires and separations. The JOLTS data is published monthly and by region and industry.

______________________________________________________________________________________

INDEX DESCRIPTIONS
Producer Price Index is an inflationary indicator published by the U.S. Bureau of Labor Statistics to evaluate wholesale price levels in the economy.

The Consumer Price Index (CPI) is a measure of the average change over time in the prices paid by urban consumers for a market basket of consumer goods and services.

______________________________________________________________________________________

This research material has been prepared by LPL Financial.

To the extent you are receiving investment advice from a separately registered independent investment advisor, please note that LPL Financial is
not an affiliate of and makes no representation with respect to such entity.

Not FDIC/NCUA Insured | Not Bank/Credit Union Guaranteed | May Lose Value | Not Guaranteed by any Government Agency | Not a Bank/Credit Union Deposit

Investor’s Guide to the State of the Union Address
February 12, 2013

Investor’s Guide to the State of the Union Address

President Obama’s State of the Union (SOTU), scheduled for Tuesday, February 12, is unlikely to be a big market mover. In fact, most SOTU speeches see less than a 1% move in the stock market on the following day, and the average move is only 0.15% [Figure 1].

Screen Shot 2013-02-13 at 1.26.17 PMIn his SOTU address on Tuesday, President Obama will present key themes that may impact certain industries and asset classes. While gun control and immigration will likely comprise important themes, they have minor market impact. The two major themes that we will be listening for with potential to impact the markets are: the fiscal cliff and energy independence.

Fiscal Cliff Part II

Early in his speech, the President will be forced to talk about the fiscal cliff part II. There are three remaining components to the fiscal cliff that are yet to be resolved: the sequester taking effect March 1, the government shutdown set for March 27, and the debt ceiling to be hit on May 19.

  • The President will likely restate his recent comments about replacing the spending cuts that kick in on March 1, known as the sequester, with some combination of tax increases and spending cuts. However, this has little chance of passing the House after Republicans supported tax increases in the first fiscal cliff deal. The Congressional Budget Office estimates that the fiscal drag from the sequester in 2013 would be about $85 billion, or about 0.5% of gross domestic product (GDP.) This adds to the roughly 1.5% drag on the economy from the fiscal cliff tax increases that went into place January 1. That is a materially negative impact for an economy that registered a contraction in the fourth quarter and is on track for only sluggish growth in the current quarter.

Comments that suggest the President is open to mitigating the defense cuts in exchange for cuts elsewhere, rather than tax increases, may be a positive for the markets — especially for stocks in the defense industry, which have been pulling back lately as the cuts have loomed. Unless changed, defense spending (other than for military personnel) will be cut by around 8% across the board, while nondefense funding that is subject to the automatic reductions will be cut by between 5% and 6%.

  • The continuing resolution funding the government expires on March 27 and could prompt a government shutdown (though certain essential components like the armed forces will continue to operate). While tax collections will be reaching their seasonal peak as the April 15 deadline approaches, tax refunds processed by the IRS may take much longer than usual and could cause consumer spending to drop and negatively impact stocks in the consumer discretionary sector. In 2012, the average tax refund check was nearly $3,000, all together totaling $175 billion. The drag on incomes could be felt since consumers have lacked the confidence to fund spending with credit cards in recent years [Figure 2]. Screen Shot 2013-02-13 at 1.29.29 PMDuring the previous two government shutdowns, it was short-lived. It lasted five days in November 1995 and was followed by 21 days in January 1996. As long as talks are proceeding, we expect another continuing resolution to be passed to fund the government for a few more months or until September 30 to avoid a lengthy shutdown.
  • While the debt ceiling has been pushed back to May 19, it will soon be upon us again. If no further action is taken before May 19, the Treasury will once again resort to extraordinary measures to allow the government to continue operating. As precursor to restating these negotiations, President Obama will likely talk about a “balanced package” of spending cuts and tax increases to reduce the deficit and need for additional borrowing. With the potential for additional tax rate increases on the horizon, high dividend-paying stocks and municipal bonds (given the potential elimination of some deductions) could react negatively, which may present a buying opportunity.

These fiscal cliff issues leave little likelihood that other recurring themes in the President’s SOTU address see any legislative action that otherwise could impact certain asset classes. For example, the President is likely to again tout the need for greater infrastructure investment — a potential positive for some stocks in the industrial and materials sectors were it to actually take place. Another example is a new program to modify underwater mortgages that could act as a negative for mortgage-backed securities, if implemented.

Energy Independence

The President is likely to highlight the need for U.S. energy independence, noting the increasing domestic oil and gas production and voicing his continued support for sources of clean energy. Given their dependence on federal support programs, the stocks of producers of wind, solar, and other clean energy sources often tend to be volatile around the SOTU addresses in recent years — sometimes seeing a big bounce that soon fades.

Regarding traditional sources of energy, investors are unlikely to hear anything on natural gas or coal that may turn around slumping coal stocks, but probably nothing that would accelerate their decline either. However, the President will likely highlight energy tax incentives for elimination known as the “percentage depletion allowance” and “expensing of intangible drilling costs.” These incentives exist to encourage small companies to produce oil from marginal wells that become profitable with the tax breaks. These marginal wells are old or small wells that do not produce much oil individually, but in total constitute most of the U.S.’s domestic oil and gas production. The percentage depletion allowance was eliminated in 1975 for the major oil companies, and their ability to expense intangible drilling costs expensing is very limited. Therefore, the potential elimination of these tax breaks would be unlikely to have a major negative effect on the major companies in the energy sector. However, the exploration and production industry of the energy sector could be negatively impacted, were these incentives to be eliminated, which we doubt will happen in 2013.

________________________________________________________________________________________

­­­­­­­­­­­­­­­­­­

IMPORTANT DISCLOSURES

The opinions voiced in this material are for general information only and are not intended to provide specific advice or recommendations for any individual. To determine which investment(s) may be appropriate for you, consult your financial advisor prior to investing. All performance reference is historical and is no guarantee of future results. All indices are unmanaged and cannot be invested into directly.

The economic forecasts set forth in the presentation may not develop as predicted and there can be no guarantee that strategies promoted will be successful.

Stock investing involves risk including loss of principal.

The commentary expresses the political view of the author and in no way represents the views of LPL Financial. The assumptions made are based upon approvals by Congress and are subject to change. While individual advisors and investors may of course have their own personal views or preferences when it comes to matters of public and political policy, the author is trying to provide insights from the available data, allowing readers to make fully informed decisions.

Municipal bonds are subject to availability and change in price. They are subject to market and interest rate risk if sold prior to maturity. Bond values will decline as interest rates rise. Interest income may be subject to the alternative minimum tax. Municipal bonds are federally tax-free but other state and local taxes may apply.

Mortgage-Backed Security (MBS) is a type of asset-backed security that is secured by a mortgage or collection of mortgages. These securities must also be grouped in one of the top two ratings as determined by a accredited credit rating agency, and usually pay periodic payments that are similar to coupon payments. Furthermore, the mortgage must have originated from a regulated and authorized financial institution.

Mortgage-Backed Securities are subject to credit, default risk, prepayment risk that acts much like call risk when you get your principal back sooner than the stated maturity, extension risk, the opposite of prepayment risk, and interest rate risk.

Investments in specialized industry sectors have additional risk such as credit, regulatory, operational, business, economic and political risk which should carefully be considered before investing.

Consumer Discretionary Sector: Companies that tend to be the most sensitive to economic cycles. Its manufacturing segment includes automotive, household durable goods, textiles and apparel, and leisure equipment. The service segment includes hotels, restaurants and other leisure facilities, media production and services, consumer retailing and services and education services.

Energy Sector: Companies whose businesses are dominated by either of the following activities: The construction or provision of oil rigs, drilling equipment and other energy-related service and equipment, including seismic data collection. The exploration, production, marketing, refining and/or transportation of oil and gas products, coal and consumable fuels.

Industrials Sector: Companies whose businesses manufacture and distribute capital goods, including aerospace and defense, construction, engineering and building products, electrical equipment and industrial machinery. Also, companies that provide commercial services and supplies, including printing, employment, environmental and office services, or provide transportation services, including airlines, couriers, marine, road and rail, and transportation infrastructure.

Materials Sector: Companies that are engaged in a wide range of commodity-related manufacturing. Included in this sector are companies that manufacture chemicals, construction materials, glass, paper, forest products and related packaging products, metals, minerals and mining companies, including producers of steel.

________________________________________________________________________________________

INDEX DEFINITIONS

The Standard & Poor’s 500 Index is a capitalization-weighted index of 500 stocks designed to measure performance of the broad domestic economy through changes in the aggregate market value of 500 stocks representing all major industries.

This research material has been prepared by LPL Financial.

To the extent you are receiving investment advice from a separately registered independent investment advisor, please note that LPL Financial is not an affiliate of and makes no representation with respect to such entity.

Not FDIC or NCUA/NCUSIF Insured | No Bank or Credit Union Guarantee | May Lose Value | Not Guaranteed by any Government Agency | Not a Bank/Credit Union Deposit

Member FINRA/SIPC

Page 4 of 4

RES 4079 0213

Tracking #1-141165 (Exp. 02/14)

________________________________________________________________________________________

Stay Connected with Us!


www.garrettandrobinson.com

Weather or Not: Be Prepared
August 30, 2012

It is difficult to forecast the economy and markets accurately, but accurately forecasting the weather can be downright exasperating. But, from time to time, predicting the weather – or at least paying very close attention to how it is developing – is part of making economic and market forecasts. The effects of weather could be a major factor affecting the commodities markets and, in turn, the economy in the coming months.

Isaac is the ninth named storm of the Atlantic hurricane season this year. The National Oceanic and Atmospheric Administration latest forecast includes 17 named storms this season, including 5-8 hurricanes and 2-3 major hurricanes. Storms are being fueled by the warmer-than-normal sea surface temperatures in the Atlantic along with conducive wind patterns. The potential for severe weather activity is a risk that could result in:

  • Lost economic output
  • A rise in unemployment in affected areas
  • Downgrades to municipal debt ratings as emergency reserve funds are depleted
  • Losses for insurance companies
  • Higher agriculture prices, and
  • Higher energy prices

The biggest threat to economic growth from hurricanes is the nationwide surge in gasoline prices.

With Hurricane Isaac on the way toward the key production areas of the Gulf of Mexico, energy companies have begun suspending crude and gas operations in the Gulf region, home to 23% of U.S. oil production, 7% of natural-gas output and 44% of refining capacity, according to the U.S. Energy Department. Four back-to-back hurricanes that hit the southern United States in summer 2004 resulted in a loss of 25% of Gulf of Mexico energy production. In 2005 hurricanes Katrina, Rita and Wilma devastated the Gulf Coast and shut down 24% of annual oil production during the six months that followed the storms. In addition, the source of much of the United States foreign oil, the Louisiana Offshore Oil Port, had to be closed. This drove oil prices to increase by over $10 per barrel and gasoline prices at the pump rocketed to near $5 a gallon in some areas. A repeat would be an unwelcome burden to U.S. consumers. After all, 2012 presents a much more fragile economic backdrop than in 2005 when the major hurricanes last struck.