2013’s Top 10 Lessons for Investors
December 26, 2013

Each year that passes contains some wisdom for investors, but along with that wisdom can be some folly. 2013 was a year that bestowed an abundance of each on investors.

The top 10 lessons of 2013 for investors need to be put into two categories:  those that investors can take to heart as sound wisdom for the year to come, and those they should try to forget as they prepare for 2014.

Lessons investors can take to heart for 2014:

1. Bonds can lose money. After a 13-year streak of annual gains, the bond market measured by the Barclay’s Capital Aggregate Bond Index fell about 2% on a total return basis in 2013, as interest rates rose from their all-time low in 2012.

2. Sentiment can matter more than fundamentals. Investors were willing to pay more for stocks, leading to a rise in the price-to-earnings ratio as they grew more confident in the durability of future growth. This brighter outlook drove most of the S&P 500 Index’s gain in 2013, not the mid-single-digit pace of earnings growth or lackluster 2% gross domestic product (GDP). This is not uncommon. Historically, stocks have posted the most consistent gains when GDP has been around 3%. When GDP for a quarter was within plus or minus a half of a percentage point of 3%, the S&P 500 has posted an average gain of 6.5% during that quarter — the highest of any 1% range in quarterly GDP and nearly triple the 2.4% gain when GDP was more than twice as strong.

3. Time heals all wounds. In fall 2013, the one-, three-, and five-year trailing returns for the stock market rose into the double digits, and money finally started flowing into U.S. stock funds after the five years of net outflows that followed the financial crisis.

4. Defensive stocks can lead the market higher. During the first four months of the year, the defensive sectors — those that are less economically sensitive and tend to fare better when growth is weakening such as utilities, telecommunications, consumer staples, and health care — led the overall market to double-digit gains. For the year as a whole, the defensive health care sector outperformed with a powerful gain of 39%, as measured by the S&P 500 Health Care Index. This was an unusually strong performance for a sector that tends only to be among the top-performing sectors in years when overall S&P 500 returns are low (2011) or negative (2008). While overall cyclical stocks generally fared the best, for parts of the year defensive stocks led the way up.

5. Annual returns are rarely average. The 27% gain in the S&P 500 Index (30% including dividends) in 2013 was well above the long-term average of 5% (10% including dividends). Historically, annual returns have only been in the 5 – 10% range in eight of the past 86 years.

Lessons that may have to be unlearned to pursue investment success in 2014:

6. Diversification is worthless. A passive, buy-and-hold portfolio of U.S. stocks did very well in 2013, whereas diversification, tactical positioning, or hedging generally acted as a drag on returns. History shows that 2013 was an outlier and that risk management tools like diversification have tended to benefit investors.

7. Risks are never realized. The key risks of 2013 were not realized:a recession from higher taxes and spending cuts, a default from government brinkmanship over the debt ceiling, a European financial crisis from Italian election debacle and Cyprus bank bailouts, a collapse in the housing market due to rising interest rates, etc. But that did not mean the risks were not threatening; any of them could have resulted in a very different outcome for the year. Risks may not always be as well behaved.

8. Stocks go up in a straight line. In 2013, the S&P 500 Index jumped 27%, but it saw only one notable pullback along the way. The pullback was less than 6% from peak to trough and lasted just one month. That compares to an average year that holds four market pullbacks of greater than 5% with at least one major pullback that has a peak-to-trough decline of 15.8% in the S&P 500 over the past 20 years. More volatility may be in store in the years ahead.

9. Dividends do not matter. The S&P 500 Dividend Aristocrats Index, composed of companies that have increased dividends every year for the last 25 consecutive years, performed in line with the overall S&P 500 in 2013. Instead, it was those companies that used their cash to do the most buybacks that outperformed. The S&P 500 Buyback Index, which focuses on the 100 companies in the S&P 500 that are doing the most buybacks, posted a total return of 45% — outperforming the S&P 500 by 16%. However, in an income-hungry market, dividends are likely to be attractive to many investors in the years ahead.

10. Policy is all that matters. In 2013, all eyes were on Washington as investors and the media obsessed over the fiscal cliff, sequester, tapering, shutdown, and debt ceiling. In 2014, the economy and markets will likely be more independent of policymakers as growth accelerates and high stakes fiscal battles are avoided.

These lessons are helpful for pursuing investing success in the year ahead. The accumulated wisdom from lessons learned over many years suggests that with long-term interest rates remaining historically low, corporate earnings likely to grow in the high-single digits, job growth improving, and inflation remaining below 3%, conditions are ripe for stocks to again reward investors in 2014.

__________________________________________________________________________________________________________________________

IMPORTANT DISCLOSURES

The opinions voiced in this material are for general information only and are not intended to provide specific advice or recommendations for any individual. To determine which investment(s) may be appropriate for you, consult your financial advisor prior to investing. All performance reference is historical and is no guarantee of future results. All indices are unmanaged and cannot be invested into directly. Unmanaged index returns do not reflect fees, expenses, or sales charges. Index performance is not indicative of the performance of any investment. Past performance is no guarantee of future results.

The economic forecasts set forth in the presentation may not develop as predicted and there can be no guarantee that strategies promoted will be successful.

Stock and mutual fund investing involves risk including loss of principal.

Bonds are subject to market and interest rate risk if sold prior to maturity. Bond values and yields will decline as interest rates rise and bonds are subject to availability and change in price.

There is no guarantee that a diversified portfolio will enhance overall returns or outperform a non-diversified portfolio. Diversification does not protect against market risk.

____________________________________________________________________________________________________________________________
INDEX DESCRIPTIONS
The Barclays Capital U.S. Aggregate Index is comprised of the U.S. investment-grade, fixed-rate bond market.

The Standard & Poor’s 500 Index is a capitalization-weighted index of 500 stocks designed to measure performance of the broad domestic economy through changes in the aggregate market value of 500 stocks representing all major industries.

The S&P Healthcare Index is comprised of companies in this sector primarily include healthcare equipment and supplies, health care providers and services, biotechnology, and pharmaceuticals industries.

____________________________________________________________________________________________________________________________

This research material has been prepared by LPL Financial.
To the extent you are receiving investment advice from a separately registered independent investment advisor, please note that LPL Financial is not
an affiliate of and makes no representation with respect to such entity.

Not FDIC or NCUA/NCUSIF Insured | No Bank or Credit Union Guarantee | May Lose Value | Not Guaranteed by any Government Agency | Not a Bank/Credit Union Deposit

Member FINRA/SIPC

Navigating the Markets
November 26, 2013

Compass Changes

  • No Changes

Investment Takeaways

  • We expect the S&P 500 Index to grind higher through year-end, supported by durable U.S. economic growth, accommodative Federal Reserve (Fed) policy, and earnings gains.

  • Our positive small cap view reflects our U.S. focus and potential to capture further stock market gains.

  • We continue to favor the more U.S.-focused, consumer-oriented sectors over the global, export-focused sectors.

  • We find bond valuations roughly fair and expect yields to remain largely range-bound through year-end.

  • Higher-yielding, fundamentally sound segments of the bond market such as high-yield bonds, bank loans, and preferred securities remain among the more attractive fixed income options.

  • Among high-quality bonds, we favor investment-grade corporate bonds due to the potential for higher yields and good fundamentals.

  • We find high-yield municipal bonds attractive, but high-quality municipal bonds possess more attractive valuations and compelling taxable-equivalent yields.

  • From a technical perspective, the S&P 500 Index price continues to make new all-time highs, establishing a new bullish price objective at 1845.

Broad Asset Class Views

LPL Financial Research’s views on stocks, bonds, cash, and alternatives are illustrated below. The positions of negative, neutral, or positive are indicated by the solid black compass needle, while an outlined needle shows a previous view.

Figure_1_001

Equity & Alternative Asset Classes

Favor Small Caps for U.S. Focus Potential for Further Stock Market Gains

  • We expect the S&P 500 Index to continue to grind higher over the balance of the year, supported by durable U.S. economic growth, accommodative Fed policy, and earnings gains.
  • We favor small caps for their potential to capture further stock market gains.

  • We favor U.S. stocks relative to emerging markets (EM) and developed foreign, as Europe struggles to grow, and the growth trajectory in several key EM countries has been uneven. The recent pickup in China’s growth is encouraging.

  • We maintain a preference for growth over value due to growth’s tendency to outperform in slow-growth environments and our positive consumer discretionary view.

  • We believe further downside to crude oil (WTI) may be limited in the near term from a technical perspective, though the latest inventory data and relative calm in the Middle East are bearish.

  • The potential for the Fed not to taper its bond purchases until after the New Year may provide near-term support for gold.

Figure_2

Equity Sectors

Maintain Preference for U.S. and Consumer-Focused Cyclical Sectors

  • We continue to favor the more U.S.- focused, consumer-oriented sectors over the global, export-focused sectors.

  • Our consumer discretionary view remains positive as spending continues to increase, albeit modestly, and the housing recovery continues despite higher mortgage rates.

  • Our financials view is neutral. We see the U.S. focus, earnings gains, and valuations as positives, although mortgage activity, fixed income trading, and regulation remain concerns.

  • Our modestly positive health care view reflects our U.S. focus, robust pace of product innovation, and demand uptick from the Affordable Care Act (ACA).

  • The materials sector is one to watch for a potentially more positive view due to positive technicals and evidence of a pickup in growth in China.

  • We expect a potential pickup in business spending and improving growth in China to help industrials sector performance.

  • We remain cautious on telecom and utilities due to their interest rate sensitivity, though telecom valuations have become more reasonable in recent months.

  • Our recent downgrade in our consumer staples view was driven by above-average valuations and weakening technicals, but lower oil prices help the outlook.

Figure_3

Fixed Income

A New Yield Range

  • We find bond valuations roughly fair and expect bond prices and yields to continue to be largely range-bound between now and year-end 2013.

  • We believe intermediate maturity bonds provide a better risk/return trade-off compared to short-term bonds.

  • We find high-yield municipal bonds attractive, but high-quality municipal bonds possess more attractive valuations and compelling taxable-equivalent yields.

  • A modest rise in yields to start November shows the bond market remains sensitive to tapering fears, but clarity from economic data, Washington, and the Fed may take months to become evident.

  • Higher-yielding, fundamentally sound segments of the bond market such as high-yield bonds, bank loans, and preferred securities remain among the more attractive fixed income options.

  • Among high-quality bonds, we favor investment-grade corporate bonds due to the potential for higher yields and good fundamentals.

Figure_4

Figure_5

All performance referenced herein is as of November 19, 2013, unless otherwise noted.

Global macro strategies risk include but are not limited to imperfect knowledge of macro events, divergent movement from macro events, loss of principal, and related geopolitical risks.

Real estate/REITs may result in potential illiquidity and there is no assurance the objectives of the program will be attained. The fast price swings of commodities will result in significant volatility in an investor’s holdings. International and emerging markets involve special risks such as currency fluctuation and political instability. The price of small and mid-cap stocks are generally more volatile than large cap stocks. Value investments can perform differently from the market as a whole. They can remain undervalued by the market for long periods of time. Precious metal investing is subject to substantial fluctuation and potential for loss. These securities may not be suitable for all investors. Alternative strategies may not be suitable for all investors and should be considered as an investment for the risk capital portion of the investor’s portfolio. The strategies employed in the management of alternative investments may accelerate the velocity of potential losses. Stock investing may involve risk including loss of principal.

Because of their narrow focus, sector investing will be subject to greater volatility than investing more broadly across many sectors and companies.

For the purposes of this publication, intermediate-term bonds have maturities between three and 10 years, and short-term bonds are those with maturities of less than three years.

All bonds are subject to market and interest rate risk if sold prior to maturity. Bond values will decline as interest rates rise and are subject to availably and change in price. High-yield/junk bonds are not investment-grade securities, involve substantial risks, and generally should be part of the diversified portfolio of sophisticated investors. Municipal interest income may be subject to the alternative minimum tax. Federally tax-free but other state and local taxes may apply. Corporate bonds are considered higher risk than government bonds but normally offer a higher yield and are subject to market, interest rate and credit risk as well as additional risks based on the quality of issuer coupon rate, price, yield, maturity, and redemption features.

______________________________________________________________________________________________________________________________

DEFINITIONS:

EQUITY AND ALTERNATIVES ASSET CLASSES

Large Growth: Stocks in the top 70% of the capitalization of the U.S. equity market are defined as Large Cap. Growth is defined based on fast growth (high growth rates for earnings,

sales, book value, and cash flow) and high valuations (high price ratios and low dividend yields).

Large Value: Stocks in the top 70% of the capitalization of the U.S. equity market are defined as Large Cap. Value is defined based on low valuations (low price ratios and high dividend yields) and slow growth (low growth rates for earnings, sales, book value, and cash flow).

Mid Growth: The U.S. mid-cap range for market capitalization typically falls between $1 billion and $8 billion and represents 20% of the total capitalization of the U.S. equity market. Growth is defined based on fast growth (high growth rates for earnings, sales, book value, and cash flow) and high valuations (high price ratios and low dividend yields).

Mid Value: The U.S. Mid Cap range for market capitalization typically falls between $1 billion and $8 billion and represents 20% of the total capitalization of the U.S. equity market. Value is defined based on low valuations (low price ratios and high dividend yields) and slow growth (low growth rates for earnings, sales, book value, and cash flow).

Small Growth: Stocks in the bottom 10% of the capitalization of the U.S. equity market are defined as Small Cap. Growth is defined based on fast growth (high growth rates for earnings, sales, book value, and cash flow) and high valuations (high price ratios and low dividend yields).

Small Value: Stocks in the bottom 10% of the capitalization of the U.S. equity market are defined as Small Cap. Value is defined based on low valuations (low price ratios and high dividend yields) and slow growth (low growth rates for earnings, sales, book value, and cash flow).

U.S. Stocks: Stock of companies domiciled in the U.S.

Large Foreign: Large-cap foreign stocks have market capitalizations greater than $5 billion. The majority of the holdings in the large foreign category are in the MSCI EAFE Index.

Small Foreign: Small-cap foreign stocks typically have market capitalizations of $250M to $1B. The majority of the holdings in the small foreign category are in the MSCI Small Cap EAFE Index.

Emerging Markets: Stocks of a single developing country or a grouping of developing countries. For the most part, these countries are in Eastern Europe, Africa, the Middle East, Latin America, the Far East and Asia.

REITs: REITs are companies that develop and manage real-estate properties. There are several different types of REITs, including apartment, factory-outlet, health-care, hotel, industrial, mortgage, office, and shopping center REITs. This would also include real-estate operating companies.

Commodities – Industrial Metals: Stocks in companies that mine base metals such as copper, aluminum and iron ore. Also included are the actual metals themselves. Industrial metals companies are typically based in North America, Australia, or South Africa.

Commodities – Precious Metals: Stocks of companies that do gold- silver-, platinum-, and base-metal-mining. Precious-metals companies are typically based in North America, Australia, or South Africa.

Commodities – Energy: Stocks of companies that focus on integrated energy, oil & gas services, oil & gas exploration and equipment. Public energy companies are typically based in North

America, Europe, the UK, and Latin America.

Merger Arbitrage is a hedge fund strategy in which the stocks of two merging companies are simultaneously bought and sold to create a riskless profit. A merger arbitrageur looks at the risk that the merger deal will not close on time, or at all. Because of this slight uncertainty, the target company’s stock will typically sell at a discount to the price that the combined company will have when the merger is closed. This discrepancy is the arbitrageur’s profit.

Long/Short is an investment strategy generally associated with hedge funds. It involves buying long equities that are expected to increase in value and selling short equities that are expected to decrease in value.

______________________________________________________________________________________________________________________________

EQUITY SECTORS

Materials: Companies that engage in a wide range of commodity-related manufacturing. Included in this sector are companies that manufacture chemicals, construction materials, glass, paper, forest products and related packaging products, metals, minerals and mining companies, including producers of steel.

Energy: Companies whose businesses are dominated by either of the following activities: The construction or provision of oil rigs, drilling equipment and other energy-related service and equipment, including seismic data collection or the exploration, production, marketing, refining and/or transportation of oil and gas products, coal and consumable fuels.

Industrials: Companies whose businesses: Manufacture and distribute capital goods, including aerospace and defense, construction, engineering and building products, electrical equipment and industrial machinery; provide commercial services and supplies, including printing, employment, environmental and office services; provide transportation services, including airlines, couriers, marine, road and rail, and transportation infrastructure.

Consumer Discretionary: Companies that tend to be the most sensitive to economic cycles. Its manufacturing segment includes automotive, household durable goods, textiles and apparel, and leisure equipment. The service segment includes hotels, restaurants and other leisure facilities, media production and services, consumer retailing and services and education services.

Technology: Companies that primarily develop software in various fields such as the Internet, applications, systems and/or database management and companies that provide information technology consulting and services. Technology hardware & equipment include manufacturers and distributors of communications equipment, computers and peripherals, electronic equipment and related instruments, and semiconductor equipment and products.

Financials: Companies involved in activities such as banking, consumer finance, investment banking and brokerage, asset management, insurance and investment, and real estate, including REITs.

Utilities: Companies considered electric, gas or water utilities, or companies that operate as independent producers and/or distributors of power.

Health Care: Companies in two main industry groups: Healthcare equipment and supplies or companies that provide healthcare-related services, including distributors of healthcare products, providers of basic healthcare services, and owners and operators of healthcare facilities and organizations or companies primarily involved in the research, development, production and marketing of pharmaceuticals and biotechnology products.

Consumer Staples: Companies whose businesses are less sensitive to economic cycles. It includes manufacturers and distributors of food, beverages and tobacco, and producers of nondurable household goods and personal products. It also includes food and drug retailing companies.

Telecommunications: Companies that provide communications services primarily through a fixed line, cellular, wireless, high bandwidth and/or fiber-optic cable network.

______________________________________________________________________________________________________________________________

FIXED INCOME

Credit Quality: An individual bond’s credit rating is determined by private independent rating agencies such as Standard & Poor’s, Moody’s and Fitch. Their credit quality designations range from high (‘AAA’ to ‘AA’) to medium (‘A’ to ‘BBB’) to low (‘BB’, ‘B’, ‘CCC’, ‘CC’ to ‘C’).

Duration: A measure of the sensitivity of the price (the value of principal) of a fixed-income investment to a change in interest rates. Duration is expressed as a number of years. Rising interest rates mean falling bond prices, while declining interest rates mean rising bond prices. The bigger the duration number, the greater the interest-rate risk or reward for bond prices.

Munis – Short-term: Bonds issued by various state and local governments to fund public projects. The income from these bonds is generally free from federal taxes. These bonds generally have maturities of less than three years.

Munis – Intermediate: Bonds issued by various state and local governments to fund public projects. The income from these bonds is generally free from federal taxes. These bonds generally have maturities of between 3 and 10 years.

Munis – Long-term: Bonds issued by various state and local governments to fund public projects. The income from these bonds is generally free from federal taxes. These bonds generally have maturities of more than 10 years.

Munis – High-yield: Bonds issued by various state and local governments to fund public projects. The income from these bonds is generally free from federal taxes. These bonds generally offer higher yields than other types of bonds, but they are also more vulnerable to economic and credit risk. These bonds are rated BB+ and below.

Treasuries: A marketable, fixed-interest U.S. government debt security. Treasury bonds make interest payments semi-annually and the income that holders receive is only taxed at the federal level.

TIPS (Treasury Inflation Protected Securities): A special type of Treasury note or bond that offers protection from inflation. Like other Treasuries, an inflation-indexed security pays interest every six months and pays the principal when the security matures. The difference is that the underlying principal is automatically adjusted for inflation as measured by the consumer price index (CPI).

Mortgage-Backed Securities: A type of asset-backed security that is secured by a mortgage or collection of mortgages. These securities must also be grouped in one of the top two ratings as determined by a accredited credit rating agency, and usually pay periodic payments that are similar to coupon payments. Furthermore, the mortgage must have originated from a regulated and authorized financial institution.

Investment-Grade Corporates: Securities issued by corporations with a credit ratning of BBB- or higher. Bond rating firms, such as Standard & Poor’s, use different designations consisting of upper- and lower-case letters ‘A’ and ‘B’ to identify a bond’s investment-grade credit quality rating. ‘AAA’ and ‘AA’ (high credit quality) and ‘A’ and ‘BBB’ (medium credit quality) are considered investment-grade.

Preferred Stocks: A class of ownership in a corporation that has a higher claim on the assets and earnings than common stock. Preferred stock generally has a dividend that must be paid out before dividends to common stockholders and the shares usually do not have voting rights.

High-Yield Corporates: Securities issued by corporations with a credit rating of BB+ and below. These bonds generally offer higher yields than investment-grade bonds, but they are also more vulnerable to economic and credit risk.

Bank Loans: In exchange for their credit risk, these floating-rate bank loans offer interest payments that typically float above a common short-term benchmark such as the London interbank offered rate, or LIBOR.

Foreign Bonds – Hedged: Non-U.S. fixed income securities generally from investment-grade issuers in developed countries, with hedged currency exposure.

Foreign Bonds – Unhedged: Non-U.S. fixed income securities normally denominated in major foreign currencies.

Emerging Market Debt: The debt of sovereigns, agencies, local issues, and corporations of emerging markets countries and subject to currency risk.

______________________________________________________________________________________________________________________________

IMPORTANT DISCLOSURES

The opinions voiced in this material are for general information only and are not intended to provide or be construed as providing specific investment advice or recommendations for any individual. To determine which investments may be appropriate for you, consult your financial advisor prior to investing. All performance referenced is historical and is no guarantee of future results. All indexes are unmanaged and cannot be invested into directly.

Past performance is no guarantee of future results.

Stock investing involves risk including loss of principal.

Preferred stock investing involves risk, which may include loss of principal.

Distressed investing involves significant risks, including a total loss of capital. The risks associated with distressed investing arise from several factors including: limited diversification, the use of leverage, limited liquidity, and the possibility that investors may be required to accept cash or securities with a value less than their original investment and/or may be required to accept payment over an extended period of time.

The Standard & Poor’s 500 Index is a capitalization-weighted index of 500 stocks designed to measure performance of the broad domestic economy through changes in the aggregate market value of 500 stocks representing all major industries.

Quantitative easing is a government monetary policy occasionally used to increase the money supply by buying government securities or other securities from the market. Quantitative easing increases the money supply by flooding financial institutions with capital in an effort to promote increased lending and liquidity.

______________________________________________________________________________________________________________________________

This research material has been prepared by LPL Financial.

To the extent you are receiving investment advice from a separately registered independent investment advisor, please note that LPL Financial is not an affiliate of and makes no representation with respect to such entity.

Not FDIC or NCUA/NCUSIF Insured | No Bank or Credit Union Guarantee | May Lose Value | Not Guaranteed by any Government Agency | Not a Bank/Credit Union Deposit

Member FINRA/SIPC

Trading Partners
September 3, 2013

The upward revision to second quarter gross domestic product (GDP) garnered a great deal of market attention last week (August 26 – 30, 2013). The report, released on Thursday, August 29, revealed that second quarter GDP — initially reported in late July 2013 as a 1.7% gain — was revised higher to a 2.5% gain. All of the upward revision to second quarter GDP can be explained by a narrower trade deficit. Initially, the trade deficit in the second quarter was reported as $451 billion, a 0.8% drag on overall GDP growth. Now, the revised data show that the trade gap stood at “only” 422 billion in the second quarter — the same as in the first quarter of 2013 — and as a result, the economic drag from trade for the quarter was eliminated. Looking ahead to the third quarter of 2013 and beyond, market participants and policymakers are asking: Can trade make a significant positive contribution to GDP growth in the quarters ahead, given the outlook for growth in Europe, China, Japan, and emerging markets?

Tracking the Pace of U.S. GDP Growth

While second quarter GDP was revised higher, the first quarter was not subject to revision and remained at 1.1%, leaving GDP growth in the first half of 2013 at a tepid 1.8%. The Federal Reserve (Fed) is still forecasting a 2.45% gain in GDP this year. With 1.8% growth in real GDP in the first half of the year, real GDP would have to grow by more than 3.0% in the third and fourth quarters of 2013 to match the Fed’s consensus forecast for the year. The Fed will release a revised forecast for the economy, labor markets, and inflation for 2013, 2014, and 2015 on September 18, 2013 at the conclusion of the next Federal Open Market Committee (FOMC) meeting. The FOMC is likely to revise downward its 2013 GDP growth forecast. The new forecast, along with the release of the FOMC’s initial public forecast for the economy, inflation, and the labor market in 2016 (also due on September 18), may help to soothe market fears about the pace of tapering and tightening.

Figure_1_-_Blog_-_9-5-2013
The data in hand for the first two months of the third quarter of 2013 suggest that third quarter GDP is tracking to well under 2%, and may be closer to 1%. The data released thus far for the third quarter of 2013 include:

  • Personal consumption expenditures for July;
  • Industrial production for July;
  • Retail sales for July and August;
  • Durable goods shipments and orders for July;
  • Vehicle sales for July;
  • Weekly initial claims for unemployment insurance through the week ending August 24;
  • ISM and regional Federal Reserve Manufacturing Indexes for July and August; and
  • New and existing home sales for July.

Data due out this week (September 2 – 6, 2013) on vehicle sales, the Institute for Supply Management (ISM) Purchasing Managers’ Index (PMI), merchandise trade, construction spending, factory shipments and inventories for July and August 2013, and, of course, the August employment report (due out on Friday, September 6) will help to further clarify the pace of GDP growth in the current quarter, the rest of 2013, and into 2014.

GDP Overseas

Data released over the past several months suggest that the economies in Europe and China have stabilized. Meanwhile, market participants have increased their GDP growth forecasts for Japan over the past nine months, as Japanese policymakers have ramped up monetary and fiscal policy and embarked on a series of structural reforms aimed at jarring Japan’s economy out of a multi-decade slumber. Our view remains that while the economies in China and Europe have stopped getting worse, it may take several more quarters before they can meaningfully re-accelerate. While growth has picked up in Japan — second quarter GDP growth in Japan was 2.6% — it remains disappointing relative to elevated expectations. In addition, many emerging market nations (about 50% of U.S. exports head to emerging markets), including India, Brazil, and Indonesia are now experiencing growth and inflation scares, and some (Brazil and Indonesia) are raising interest rates to head off inflation. Many of the market participants and Fed policymakers who expect U.S. GDP to accelerate in the second half of 2013 and in 2014 are likely counting on accelerating growth in Europe, China, Japan, and emerging markets to drive U.S. exports higher. But is that enough to boost U.S. GDP growth?

As noted in our Weekly Economic Commentary: Exporting Good Old American Know-How, from August 19, 2013, the United States has run a trade deficit (importing more goods and services from other countries than it exports) since the mid-1970s, and our large deficit on the goods side (around $759 billion in 2012) more than offsets the trade surplus we have on the service side of the ledger (around $213 billion in 2012). Combined, our goods and services trade deficit was $547 billion in 2012, slightly smaller than the $569 billion deficit in 2011. As a result of the slight narrowing of the deficit between 2011 and 2012, net exports contributed 0.1% to the 2.8% gain in GDP in 2012.

Net Exports Typically Do Not Boost U.S. GDP Growth

The infographic on page 2, “Profile of U.S. Exports” (Profile) reveals that over the past 40 years — aside from recessions (when imports fall faster than exports, narrowing the trade deficit) — net exports have never added more than 1.0% to overall GDP growth. Thus, even if the economies of Europe, China, Japan, and emerging markets accelerate sharply in the next few quarters, it is unlikely that net exports will provide a large boost to GDP growth this year.

In theory, an unexpected uptick in economic activity among our largest  export destinations should be a plus for our exports to that region, but in practice, the impact to our trade balance and economy may not immediately reflect the better growth prospects overseas. In addition, exchange rate movements also can influence cross-border trade, but movements often work with a long lag. Since many of our exports do not compete on price, the value of the dollar is not always the best way to gauge the relative strength of our exports to many markets. Generally speaking, U.S. exports compete globally on quality, rather than price.

Export Destinations: Economic Prospects in Canada and Mexico

The Profile details the destinations (trading partners) and mix (goods versus services) of our exports. Fourteen percent of our exports (both goods and services) are bound for the Eurozone, while just 6% head to China. Remarkably, only 5% of our exports go to Japan. Combined, our exports to the Eurozone, Japan, and China account for 25% of our total exports. Closer to home, 16% of our exports head north of the border to Canada, and another 11% head south of the border to Mexico. Thus, our exports to our two closest neighbors (27% of all exports) are larger than our exports to the Eurozone, Japan, and China combined (25%). Accordingly, market participants should probably pay more attention to the economic prospects of Canada and Mexico and a bit less to the prospects of China, the Eurozone, and Japan.

Mix of Goods/Services: Goods Are 70% of All Exports

The Profile also details the goods/services mix of our exports. Currently, goods account for around 70% of all exports, but that varies widely by trading partner. The export mix to Canada and Mexico is skewed toward goods rather than services, which is partially explained by auto production, since auto parts factories and final assembly plants account for such a large portion of trade. Our export mix to the Eurozone, China, and Japan is…well… more mixed. Services, at around 40%, account for more of our trade to the Eurozone and Japan than in our overall trade mix. In China, however, an above-average 78% of our exports are goods. All else being equal, an unexpected and permanent shift higher in economic growth for trading partners like China, the Eurozone, and Japan should boost our exports to those nations over time and, in turn, our GDP. But it is important to note that outside of recessions, net exports rarely add more than 0.5% to GDP growth. So while we spend a great deal of time discussing the health of the economy in China, the Eurozone, Japan, and emerging markets, the economic prospects of our nearest neighbors (Canada and Mexico) have a bigger influence on our overall exports.
______________________________________________________________________________________________________________________________________________________________________________

IMPORTANT DISCLOSURES

The opinions voiced in this material are for general information only and are not intended to provide specific advice or recommendations for any individual. To determine which investment(s) may be appropriate for you, consult your financial advisor prior to investing. All performance reference is historical and is no guarantee of future results. All indices are unmanaged and cannot be invested into directly.

Gross domestic product (GDP) is the monetary value of all the finished goods and services produced within a country’s borders in a specific time period, though GDP is usually calculated on an annual basis. It includes all of private and public consumption, government outlays, investments and exports less imports that occur within a defined territory.

The economic forecasts set forth in the presentation may not develop as predicted and there can be no guarantee that strategies promoted will be successful.

International investing involves special risks, such as currency fluctuation and political instability, and may not be suitable for all investors.

Purchasing Managers Index (PMI) is an indicator of the economic health of the manufacturing sector. The PMI index is based on five major indicators: new orders, inventory levels, production, supplier deliveries and the employment environment.

Markit is a leading, global financial information services company that provides independent data, valuations and trade processing across all asset classes in order to enhance transparency, reduce risk and improve operational efficiency. The Markit Purchasing Managers’ Index (PMIT) is a composite index based on five of the individual indexes with the following weights: New Orders – 0.3, Output – 0.25, Employment – 0.2, Suppliers’ Delivery Times – 0.15, Stocks of Items Purchased – 0.1, with the Delivery Times Index inverted so that it moves in a comparable direction.

The Institute for Supply Management (ISM) index is based on surveys of more than 300 manufacturing firms by the Institute of Supply Management. The ISM Manufacturing Index monitors employment, production inventories, new orders, and supplier deliveries. A composite diffusion index is created that monitors conditions in national manufacturing based on the data from these surveys.

Challenger, Gray & Christmas is the oldest executive outplacement firm in the United States. The firm conducts regular surveys and issues reports on the state of the economy, employment, job-seeking, layoffs, and executive compensation.

This research material has been prepared by LPL Financial.

To the extent you are receiving investment advice from a separately registered independent investment advisor, please note that LPL Financial is not an affiliate of and makes no representation with respect to such entity.

Not FDIC/NCUA Insured | Not Bank/Credit Union Guaranteed | May Lose Value | Not Guaranteed by any Government Agency | Not a Bank/Credit Union Deposit

Member FINRA/SIPC

Beige Book: Window on Main Street
July 23, 2013

Unseasonable Weather Still Weighing on the Economy

The latest edition of the Federal Reserve’s (Fed) Beige Book, released on July 17, 2013, described the economy as increasing at a modest-to- moderate pace, with little wage or inflation pressures. Housing and commercial real estate were mentioned as key drivers of growth. The report, along with comments made by Fed Chairman Ben Bernanke at his semi-annual Monetary Policy Testimony to Congress last week (July 15 – 19), suggest that the Fed is still on track to begin scaling back its quantitative easing (QE) program this fall, but that it remains a long way from tightening monetary policy by raising its fed funds rate target.

In order to provide one snapshot of the entire Beige Book collage of data, we created our proprietary Beige Book Barometer (BBB) [Figure 1]. The barometer ticked down to +79 in July 2013, from +82 last  month. The April 2013 reading was +112. Despite the downtick since April, the BBB remains well above its Superstorm Sandy-related dip to +30 in November 2012. Note that the April 2013 reading (+112) was  both a post-Great Recession high and also the highest reading since 2005, suggesting a broadening and deepening of the economic expansion. The move down to +79 from +112 between the April and July 2013 editions of the Beige Books came as the number of positive words dropped and the number of negative words hit a fresh seven year low in July 2013. The drop in the number of negative words in the Beige Book to a seven-year low can be viewed as reflecting the diminishing pace of headwinds (e.g., fiscal policy, Europe, China, housing) that have hampered the U.S. economic recovery over the past four years.

2013-07-24_Figure_1

Our BBB, a diffusion index that measures the number of times the word “strong” or its variations (stronger, strength, strengthen, etc.) appear in the Beige Book less the number of times the word “weak” or its variations (weaken, weaker, etc.) appear, is displayed in Figure 1. The barometer is an easy-to-use, quantitative way to derive the shades between strong and weak in the predominately qualitative Beige Book report.

Headwinds From Fiscal Policy Diminish

The word “fiscal” appeared just four times in the latest Beige Book, down from five in June 2013, and 12 in April. There were 17 mentions in the March 2013 Beige Book, and a whopping 38 in the January 2013 edition. Because of the timing of the collection of comments for the January 2013 Beige Book (comments from contacts in the business and banking community were collected throughout December 2012 and during the first few days of January 2013), we noted that with 38 mentions of the word “fiscal,” the January 2013 Beige Book likely overstated the impact of the fiscal cliff on economic activity in early 2013.

2013-07-24_Figure_2

At the start of 2013, as Congress passed legislation to avoid the worst case scenario of the fiscal cliff, but allowed the sequester (i.e., government spending cuts prescribed in the debt ceiling agreement reached in 2011) to proceed, we expected that the word “sequester” would start to appear more often in the Beige Book. Thus far, however, that has not been the case. The word sequester was not used at all in the latest two Beige Books (July and June 2013) and appeared just once in the April 2013 Beige Book. Mentions of budget or budget cuts have been almost non-existent in the recent Beige Books as well. Looking ahead, we still expect the word sequester (or related words) to show up in the next several Beige Books, but with the debt ceiling debate and possible government shutdown now pushed back until late 2013, fiscal uncertainty outside of the impact of the sequester will likely continue to fade in upcoming Beige Books. The peak of the impact of the sequester will likely be felt in the recently completed second quarter and third (current) quarter of 2013.

Word Clouds Show Unseasonably Cool Weather and Growing Concern About Impact of Health Care Reform Still Acting as Headwinds

The word clouds in Figure 3 are dominated by words describing the tone of the economy when the Beige Books were published. Below are some observations on the current Beige Book (released on July 17, 2013) relative to other recent editions of the Beige Book.

2013-07-24_Figure_3

  • In the last two Beige Books (June and July 2013), the word “weather” appeared a total of 43 times, 27 times in the June 2013 edition of the Beige Book, and 16 times in the July 2013 version. The 43 mentions were nearly double the 24 mentions of weather in the same two Beige Books in June and July 2012. All but a few of the mentions of weather in the last two (June and July 2013) were in a negative context. The words rain, wet, cool, and cold appeared a total of 22 times in the June and July 2013 Beige Books. These words did not appear at all in the June and July 2012 Beige Books. This helps to explain, in part, the poor U.S. economic data reports — both on an absolute basis and relative to expectations — for much of the spring (March, April, May, and early June), especially in housing. In corporate earnings reports for the second quarter (April, May, and June 2013), managements in the housing construction, lodging, and leisure and hospitality industries have also mentioned unseasonably cold and wet weather as having a negative impact on results. The key takeaway here is that a return to “normal” weather could provide a significant lift to weather-sensitive portions of the economy and to upcoming readings on our BBB. Indeed, the first three weeks of July 2013 have generally seen warmer-than-usual temperatures and less-than-usual amounts of rainfall across the nation.
  • In the Beige Books released in late November 2012 and early January 2013, economic uncertainty surrounding the fiscal cliff and the rebound from the economic disruption wrought by Superstorm Sandy dominated. Sandy and the fiscal cliff have since faded as concerns, and uncertainty has faded a bit as well. There were just seven mentions of the word “uncertain” in the July 2013 Beige Book, down from 13 in the June Beige Book. It was used 26 times in March 2013, and 43 in January 2013. The seven mentions of uncertain in the June 2013 Beige Book were the fewest since June 2011.
  • The word “confidence” appeared just nine times in the latest Beige Book, 10 times in the June 2013 Beige Book, seven times in the April 2013 Beige Book, and 11 times in the March 2013 Beige Book. However, unlike in 2011 and most of 2012, when the word was used in a negative context (i.e., lack of confidence, weak confidence), most of the mentions of the word confidence in the Beige Book have been in a positive context. Eight of the nine mentions in July, nine of the 10 mentions in June, five of the seven mentions in April, and nine of the 11 mentions in the March 2013 Beige Book were in a positive context. Thus, over the past few Beige Books since Superstorm Sandy, business and banking contacts have generally become more confident in the recovery, especially in housing. This suggests that a sustained, multi-year recovery in the housing market is likely underway.
  • Although the number of mentions of “health care,” “health insurance,” and the “Affordable Care Act” (ACA) totaled just 15 in the latest Beige Book, heath care remains a major issue for Main Street as the ACA begins to be implemented. Health care, health insurance, and the Affordable Care Act were mentioned 28 times in June 2013, 26 times in April, and 18 times in the March 2013 Beige Book. The topic warranted just eight mentions in the January 2013 Beige Book. In contrast, those words were found just a handful of times in the Beige Book released a year ago (June and July 2012). We will continue to monitor these health care words closely in the upcoming Beige Books, as the economy continues to adjust to the impact of the ACA. We expect this set of words to grow in importance in the coming months.
  • There were just three mentions of Europe in the latest Beige Book, down from eight mentions in the June 2013 Beige Book. Europe was mentioned nine times in the April 2013 edition of the Beige Book. The three mentions of Europe in July 2013 were the fewest since October 2012, and well below the 15 – 20 mentions seen in the summer and fall of 2012, as Europe struggled through elections in Greece and increased fears of a break-up. Not surprisingly, nearly all of the mentions of Europe in the latest Beige Book were in a negative context. Perhaps business and banking contacts on Main Street are not as exposed to Europe as some of the larger businesses and financial institutions on Wall Street are that dominate media coverage. But it is also worth noting that the European debt crisis is well into its fourth year, and Main Street may be getting used to it now. The relatively few mentions of Europe are consistent with our view that the European economy has probably stopped getting worse, even though it may not accelerate anytime soon.
  • Despite the well-publicized slowdown in China’s economy in the second quarter of 2013, the concerns around an overheated Chinese property market, and a sudden rise in overnight borrowing costs in China, China warranted just two mentions in the latest Beige Book, down from three mentions each in the April and June 2013 Beige Books. The Beige Book suggests that while China has not entirely disappeared from Main Street’s radar, it is far less of a concern than the media makes it out to be. Indeed, the last time China warranted as many as six mentions in the Beige Book was in January 2012, as fears of a “hard landing” in China began to gather steam. The Chinese economy appeared to have bottomed out in late 2012, avoiding a “hard landing,” but recent data in China suggest that it has not re-accelerated as quickly as some market participants hoped.

___________________________________________________________________________________________________________________________________

IMPORTANT DISCLOSURES

The opinions voiced in this material are for general information only and are not intended to provide specific advice or recommendations for any individual. To determine which investment(s) may be appropriate for you, consult your financial advisor prior to investing. All performance reference is historical and is no guarantee of future results. All indices are unmanaged and cannot be invested into directly.

Gross domestic product (GDP) is the monetary value of all the finished goods and services produced within a country’s borders in a specific time period, though GDP is usually calculated on an annual basis. It includes all of private and public consumption, government outlays, investments and exports less imports that occur within a defined territory.

The economic forecasts set forth in the presentation may not develop as predicted and there can be no guarantee that strategies promoted will be successful.

Quantitative easing (QE) is a government monetary policy occasionally used to increase the money supply by buying government securities or other securities from the market. Quantitative easing increases the money supply by flooding financial institutions with capital in an effort to promote increased lending and liquidity.

The Federal Open Market Committee (FOMC), a committee within the Federal Reserve System, is charged under the United States law with overseeing the nation’s open market operations (i.e., the Fed’s buying and selling of United States Treasure securities).
_____________________________________________________________________________________________________________________________________

INDEX DESCRIPTIONS

Purchasing Managers’ Index (PMI) is an indicator of the economic health of the manufacturing sector. The PMI index is based on five major indicators: new orders, inventory levels, production, supplier deliveries and the employment environment.

What’s Broken in Europe?
May 21, 2013

Last week (May 13 – 17), markets digested reports on gross domestic product (GDP) growth in the Eurozone during the first quarter of 2013 (please see “The Big Picture” for details about the Eurozone’s structure). Overall real GDP in the Eurozone contracted by 0.2% in the first quarter of 2013, following the 0.6% drop in the fourth quarter of 2012. The Eurozone’s economic contraction in the first quarter of 2013 was its sixth consecutive quarter of decline, dating back to the fourth quarter of 2011. Among the larger economies in Europe, only Germany (+0.1%) and Belgium (+0.1%) saw first quarter 2013 gains in their economies, while Austria’s GDP was unchanged between the fourth quarter of 2012 and the first quarter of 2013. France (-0.2%), Italy (-0.5%), Spain (-0.5%), and the Netherlands (-0.1%) all saw their economies contract in the first quarter of 2013.

Among the smaller economies on the Eurozone’s periphery, the news was just as bad, but the string of weak GDP readings extends back much further. Real GDP in Greece declined 0.6% in the first quarter of 2013, marking the 13th consecutive quarter of contraction. Greece’s economy has now contracted in 20 of the past 23 quarters since mid-2007. Over that time, the Greek economy has shrunk by 23%. Real GDP in Portugal contracted by 0.3% in the first quarter of 2013, marking the 10th consecutive quarterly decline. Ireland’s GDP fell just 0.1% in the first quarter of 2013, and it has managed just three quarters of growth since late 2010.

Looking ahead, financial markets seem to suggest that the double-dip recession in Europe — recession in 2008 and 2009, a modest, halting recovery in 2010 and early 2011, followed by another recession since mid-2011 — may be ending, and that the Eurozone economy may eke out small gains in the second half of 2013. The consensus of economists (as compiled by Bloomberg News) sees real GDP in the Eurozone contracting in both the second and third quarters of 2013, before a modest upswing begins in late 2013. Our view remains that the Eurozone is likely to be in a recession throughout 2013, despite the best efforts of the ECB and other policymakers.

Figure_1

The Fix? Some Keys to Help Strengthen Eurozone Economic Growth

As we have noted in prior publications, there are several keys to help strengthen economic growth in the Eurozone, including, but not limited to:

  • ƒ Fixing Europe’s broken financial transmission mechanism;
  • ƒ Broad-based labor market reforms;
  • ƒ European-wide banking reform (including a pan-European deposit insurance scheme); and
  • ƒ Financial sector reforms.

In our view, fixing Europe’s broken financial transmission mechanism should be at the top of European policymakers’ long list of “to dos.” The ECB, like almost every other major central bank around the globe, has lowered the rate at which banks can borrow from the ECB, expanded the ECB’s balance sheet to purchase securities in the open market (QE), and tried to encourage banks and other financial institutions to lend, and businesses and consumers in Europe to borrow. The results, however, have not (as yet) had the intended effect: to get badly needed credit (in the form of loans) into the European economy, and especially to the consumer and small businesses. In short, the mechanism that allows credit to flow from the ECB, to banks and financial institutions, and finally to businesses and consumers was badly damaged in the Great Recession and its aftermath.

Major European-based global corporations are benefitting from the ECB’s actions, and are taking advantage of low borrowing costs and relatively healthy — although not quite back to normal — European capital markets to issue debt and fund operations. While credit via traditional credit markets is flowing to large, global corporations in Europe, credit to SMEs, is severely restricted dampening economic activity.

How European Banks Can Help

As in the United States, most SMEs in Europe cannot borrow in the capital markets, so they rely on bank loans, and other types of bank-based funding for working capital and cash to expand existing business. This is especially true in countries at the periphery of Europe, like Greece, Portugal, Cyprus, and increasingly in core European nations like Spain and Italy. The problem is that the main conduits of the ECB’s low rates and QE policies are European banks, which:

  • ƒ Are undercapitalized;
  • ƒ Are reluctant to lend;
  • ƒ Are losing deposits;
  • ƒ Lack regulatory clarity; and
  • ƒ Have impaired balance sheets.

Therefore, European banks are not lending, or more precisely, not lending enough.

Figure 1 shows the breakdown in the financial transmission mechanism in Europe. Money supply growth (a decent proxy for the ECB’s actions to pump liquidity into the system) is running at around 2 – 3% year over year. Not robust growth, but enough to foster some lending by financial institutions. The other line on Figure 1 shows that despite the 2 – 3% growth in money supply in Europe, loans by financial institutions in Europe to private sector borrowers (SMEs and consumers) have turned negative. Therefore, credit to two key components of the Eurozone economy is contracting. The gap between these two lines is a good proxy for the broken financial transmission mechanism in Europe.

A quick look at Figure 2, which shows similar U.S. metrics (M2: money supply and bank lending), reveals that the financial transmission mechanism — while not quite back to normal — is functioning a lot better than Europe’s. M2 growth is running at around 7% year over year, while bank lending to businesses is running close to 10% year over year.

Figure_2

How the ECB and Policymakers Can Help

What would help to repair Europe’s broken transmission mechanism, and in turn, help to boost economic growth in the Eurozone? One way would be if the ECB was willing to take some credit risk on their balance sheet, and take an approach similar to the Bank of England’s (BOE) “credit easing” program. The BOE announced in late 2011 and mid-2012 that it would provide cheap loans and loan guarantees to the banking system to encourage the banks to lend more. Or, the ECB could decide to make loans directly to SMEs, essentially bypassing the broken European financial mechanism. Such a move by the ECB, of course, remains difficult — although not impossible — to achieve, given the fractured state of banking regulation in Europe and reluctance by key constituencies within the Eurozone to expand the ECB’s mandate. The bottom line is that until the ECB (or other policymakers) can agree on a plan to get more credit to capital-starved SMEs and consumers in Europe, we don’t think a meaningful recovery in Europe’s economy is in the cards.

The_Big_Picture

________________________________________________________________________________________________________________________

IMPORTANT DISCLOSURES
The opinions voiced in this material are for general information only and are not intended to provide specific advice or recommendations for any individual. To determine which investment(s) may be appropriate for you, consult your financial advisor prior to investing. All performance reference is historical and is no guarantee of future results. All indices are unmanaged and cannot be invested into directly.

Gross domestic product (GDP) is the monetary value of all the finished goods and services produced within a country’s borders in a specific time period, though GDP is usually calculated on an annual basis. It includes all of private and public consumption, government outlays, investments and exports less imports that occur within a defined territory.

The economic forecasts set forth in the presentation may not develop as predicted and there can be no guarantee that strategies promoted will be successful.

Stock investing involves risk including loss of principal.

Quantitative easing is a government monetary policy occasionally used to increase the money supply by buying government securities or other securities from the market. Quantitative easing increases the money supply by flooding financial institutions with capital in an effort to promote increased lending and liquidity.

________________________________________________________________________________________________________________________

INDEX DESCRIPTIONS
Purchasing Managers’ Index (PMI) is an indicator of the economic health of the manufacturing sector. The PMI index is based on five major indicators: new orders, inventory levels, production, supplier deliveries and the employment environment.

________________________________________________________________________________________________________________________

This research material has been prepared by LPL Financial.

To the extent you are receiving investment advice from a separately registered independent investment advisor, please note that LPL Financial is
not an affiliate of and makes no representation with respect to such entity.

Not FDIC/NCUA Insured | Not Bank/Credit Union Guaranteed | May Lose Value | Not Guaranteed by any Government Agency | Not a Bank/Credit Union Deposit

Listening to the leaders
May 14, 2013

Leading Indicators Continue to Point to Slow Economic Growth, but no Recession

The April Index of Leading Economic Indicators (LEI), due out on Friday, May 17, 2013, caps off a busy week for economic reports in the United States. This week includes reports on:

  • The consumer: Retail sales for April 2013 and the University of MichiganIndex of Consumer Sentiment for early May 2013;
  • Housing: Housing starts and building permits for April 2013 and the National Association of Homebuilders sentiment index for May 2013;
  • Manufacturing: Empire State Manufacturing Index for May, the Philadelphia Fed Manufacturing Index for May 2013, industrial production and capacity utilization for April 2013; and
  • Inflation: Consumer Price Index (CPI) and Producer Price Index (PPI) for April 2013.

On balance, these reports are likely to continue to show that the U.S. economy is growing at around 2.0% in the second quarter of 2013, that inflation remains muted, and that the odds of a recession in the next year to 18 months remains low. Policymakers at the Federal Reserve (Fed) will digest all of this data, and likely conclude that its quantitative easing (QE) program — the purchase of $85 billion per month of Treasury securities — should continue over the remainder of 2013.

1-We_Continue_to_Expect_the_Facts

LEI Updates

If you have not seen the LEI lately, there have been several changes made to its components, although as before, virtually all of the components of the LEI are known before the data are actually released. So in theory, the LEI itself should not be a surprise to market participants, the media, or pundits. Of course, that will not prevent anyone from ascribing movements in financial markets on Friday, May 17 to the LEI data, but we are always quick to point out that the S&P 500 itself is a component in the LEI.

In December 2011, the Conference Board, the private “think tank” that compiles and releases the data each month, made four changes to the LEI:

  • The Conference Board’s proprietary “Leading Credit Index” (LCI), an aggregate of several well-known financial market and credit market metrics like swap spreads, investor sentiment, margin account, etc., replaced the inflation adjusted M2 money supply.
  • The Institute for Supply Management’s (ISM) New Orders Index replaced the ISM’s Supplier Deliveries Index.
  • The U.S. Department of Census’ new orders for non-defense capital goods excluding aircraft replaced new orders for non-defense capital goods.
  • A combination of consumer expectations and business and economic conditions replace the University of Michigan’s Consumer Expectations Index.

LEI Places Very Low Odds of Recession in Next 12 Months

According to the consensus estimates compiled by Bloomberg News, the LEI is expected to post a 0.2% month-over-month gain in April 2013. The expected 0.2% month-over-month gain would put the year-over-year gain in the LEI at 2.1%. The LEI is designed to predict the future path of the economy, with a lead time of between six and 12 months. Since 1960 — 640 months or 53 years and four months — the year-over-year increase in the LEI has been at least 2.1% in 397 months. Not surprisingly, the U.S. economy was not in recession in any of those 397 months. Thus, it is highly unlikely that the economy was in recession in April 2013, despite the impact of the sequester, the fiscal cliff (spending cuts, payroll tax increases, income tax rate increases, etc.), the recession in Europe, or the slowdown in China.

But the LEI is designed to tell market participants what is likely to happen to the U.S. economy, not what has already happened. Three months after each of the 397 months that the LEI was up 2.1% or more, the economy was in recession in just two of the 397 months — both in 1973. Six months after the LEI was up by 2.1% or more on a year-over-year basis, the U.S. economy has been in recession in just six of the 397 months or 2% of the time. Looking out 12 months after the LEI was up 2.1% or more, the economy was in recession in just 27 of the 397 months, or 7% of the time. Based on this relationship, the odds of a recession within the next 18 months and two years increase to between 10% and 15%.

2_-_LEI_Suggests_a_Low_Probability_of_Recession

LPL_Financial_Research_Weekly_Calendar

On balance, the LEI says the risk of recession in the next 12 months is negligible (7%), but not zero. We would agree. But, the still-fragile state of the economy, and the uncertainty surrounding domestic fiscal policy, the recession in Europe, and the ongoing slowdown in China are telling us that the risk of recession is much higher than 7%. Our view remains that — aided by the Fed’s QE program, the early stages of a housing recovery, and a nascent manufacturing recovery — the U.S. economy is likely to grow at around 2.0% this year. The full impact of the sequester, the looming debate over the federal debt ceiling, weak exports, and ongoing contraction in both federal and state and local government spending are all acting to restrain growth, and these factors are likely to be in place for most of this year. A dramatic deterioration of the fiscal and financial situation in Europe, a fiscal or monetary policy mistake here in the United States or abroad, or an exogenous event (a major terror attack, natural disaster, etc.), among other events, may cause us to change our view.

______________________________________________________________________________________________________________________________________________

IMPORTANT DISCLOSURES
The opinions voiced in this material are for general information only and are not intended to provide specific advice or recommendations for any individual. To determine which investment(s) may be appropriate for you, consult your financial advisor prior to investing. All performance reference is historical and is no guarantee of future results. All indices are unmanaged and cannot be invested into directly.

* Over the last three quarters (third quarter of 2012, fourth quarter of 2012, and first quarter of 2013) , real GDP growth has averaged 2.0%.

Gross domestic product (GDP) is the monetary value of all the finished goods and services produced within a country’s borders in a specific time period, though GDP is usually calculated on an annual basis. It includes all of private and public consumption, government outlays, investments and exports less imports that occur within a defined territory.

The economic forecasts set forth in the presentation may not develop as predicted and there can be no guarantee that strategies promoted will be successful.

Stock investing involves risk including loss of principal.

Quantitative easing is a government monetary policy occasionally used to increase the money supply by buying government securities or other securities from the market. Quantitative easing increases the money supply by flooding financial institutions with capital in an effort to promote increased lending and liquidity.

The Federal Open Market Committee (FOMC) , a committee within the Federal Reserve System, is charged under the United States law with overseeing the nation’s open market operations (i.e., the Fed’s buying and selling of U.S. Treasury securities).

The Congressional Budget Office is a non-partisan arm of Congress, established in 1974, to provide Congress with non-partisan scoring of budget proposals.

______________________________________________________________________________________________________________________________________________

INDEX DESCRIPTIONS
The Consumer Price Index (CPI) is a measure of the average change over time in the prices paid by urban consumers for a market basket of consumer goods and services.

The Empire State Manufacturing Index is a seasonally-adjusted index that tracks the results of the Empire State Manufacturing Survey. The survey is distributed to roughly 175 manufacturing executives and asks questions intended to gauge both the current sentiment of the executives and their six-month outlook on the sector.

The Institute for Supply Management (ISM) index is based on surveys of more than 300 manufacturing firms by the Institute of Supply Management. The ISM Manufacturing Index monitors employment, production inventories, new orders, and supplier deliveries. A composite diffusion index is created that monitors conditions in national manufacturing based on the data from these surveys.

The index of leading economic indicators (LEI) is an economic variable, such as private-sector wages, that tends to show the direction of future economic activity.

The Leading Credit Index constitutes financial market indicators including bond market yield curve data, interest rate swaps, and Fed bank lending survey data.

The NAHB/Wells Fargo Housing Market Index gauges builder perceptions of current single-family home sales and sales expectations for the next six months as “good,” “fair” or “poor.” The survey also asks builders to rate traffic of prospective buyers as “high to very high,” “average,” or “low to very low.” Scores from each component are then used to calculate a seasonally adjusted index where any number over 50 indicates that more builders view conditions as good than poor.

The Philadelphia Fed Manufacturing Index is a survey produced by the Federal Reserve Bank of Philadelphia, which questions manufacturers on general business conditions. The index covers the Philadelphia, New Jersey, and Delaware region. Higher survey figures suggest higher production, which contribute to economic growth. Results are calculated as the difference between percentage scores with zero acting as the centerline point. As such, values greater than zero indicate growth, while values less than zero indicate contraction.

The Producer Price Index (PPI) program measures the average change over time in the selling prices received by domestic producers for their output. The prices included in the PPI are from the first commercial transaction for many products and some services.

Purchasing Managers’ Index (PMI) is an indicator of the economic health of the manufacturing sector. The PMI index is based on five major indicators: new orders, inventory levels, production, supplier deliveries, and the employment environment.

The University of Michigan Consumer Sentiment Index (MCSI) is a survey of consumer confidence conducted by the University of Michigan. The Michigan Consumer Sentiment Index (MCSI) uses telephone surveys to gather information on consumer expectations regarding the overall economy.

______________________________________________________________________________________________________________________________________________

This research material has been prepared by LPL Financial.
To the extent you are receiving investment advice from a separately registered independent investment advisor, please note that LPL Financial is
not an affiliate of and makes no representation with respect to such entity.

Not FDIC/NCUA Insured | Not Bank/Credit Union Guaranteed | May Lose Value | Not Guaranteed by any Government Agency | Not a Bank/Credit Union Deposit

Navigating the Markets
April 23, 2013

Navigating the Markets

Compass Changes

  • ƒUpgraded health care to neutral from negative/neutral
  • Upgraded emerging market debt to neutral/positive from neutral
  • Upgraded oil commodity from neutral/negative to neutral
  • Downgraded precious metals commodities from neutral/positive to neutral
  • Downgraded technology from neutral/positive to neutral

Investment Takeaways

  • ƒOur near-term stock market view is slightly cautious, given our Base Path expectation for modest single-digit returns in 2013.*
  • We continue to favor cyclical sectors over defensives over the balance of the year, but our near-term views are balanced.
  • Higher-yielding, fundamentally sound segments of the bond market remain attractive, but low yields and valuations temper our enthusiasm.
  • We upgraded our emerging market debt view following under performance during the first quarter.
  • We see the oil commodity as near fair value following the latest correction, while deteriorating technicals drive our lowered precious metals view.
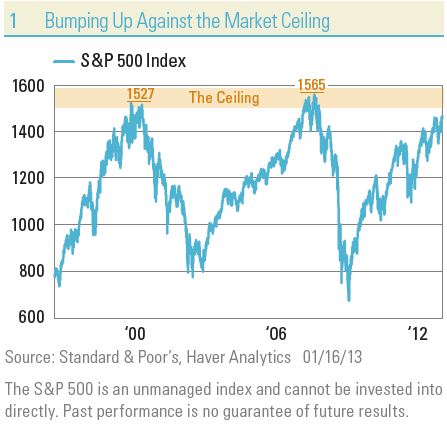
  • From a technical perspective, the S&P 500 may turn lower over the next few weeks; next support is at 1540, followed by 1500.

Bond_Class_Views

Broad Asset Class Views

LPL Financial Research’s views on stocks, bonds, cash, and alternatives are illustrated below. The positions of negative, neutral, or positive are indicated by the solid black compass needle, while an outlined needle shows a previous view.

Equity & Alternative Asset Classes

Maintain Slightly Cautious Stock Market View as S&P 500 Remains Near All-Time Highs

Our near-term stock market view is slightly cautious, given our Base Path expectation for modest single-digit returns in 2013.*
ƒ
Our views are generally aligned across market cap, with a slight preference for large and mid caps. In our Base Path scenario in Outlook 2013, we expect the market to favor the stability, lower valuations, and higher yields associated with large caps.
ƒ
We maintain a modest preference for growth over value due to growth’s potential to perform well in slow-growth environments, although our conviction has lessened as our sector views have become more balanced.
ƒ
Our neutral emerging markets (EM) view reflects higher near-term risks as China implements measures to curb its property markets and has produced uneven growth.
ƒ
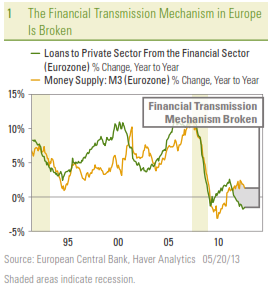
Our large foreign view is neutral. Although bold policy actions and valuations are supportive, and the outlook in Japan has improved, Europe remains mired in recession and the Eurozone debt crisis is not yet over.
ƒ
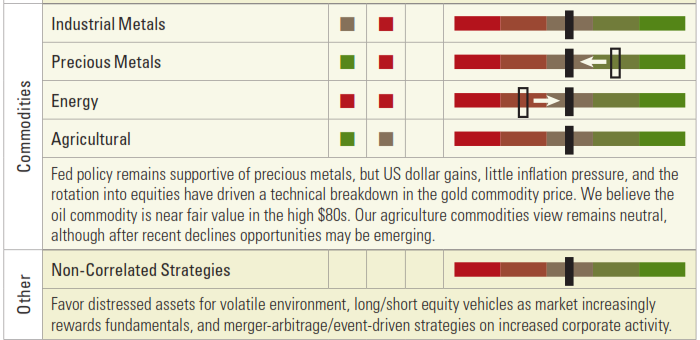
Fed policy remains supportive of precious metals, but US dollar gains, little inflation pressure, and the rotation into equities have driven a technical breakdown in the gold commodity price.
ƒ
Now that the oil commodity has pulled back into the high $80s, we believe it is near fair value.

Image_1

Image_2

Image_3

All performance referenced herein is as of April 16, 2013, unless otherwise noted. * LPL Financial Research provided these forecasts based on: a low-single-digit earnings growth rate supported by modest share buybacks combined with 2% dividend yields and little change in valuations for the S&P 500. Please see our Outlook 2013 for details.

Real Estate/REITs may result in potential illiquidity and there is no assurance the objectives of the program will be attained. The fast price swings of commodities will result in significant volatility in an investor’s holdings. International and emerging markets involve special risks such as currency fluctuation and political instability. The price of small and mid-cap stocks are generally more volatile than large capstocks. Value investments can perform differently from the market as a whole. They can remain undervalued by the market for long periods of time. Precious metal investing is subject to substantial fluctuation and potential for loss. These securities may not be suitable for all investors. Alternative strategies may not be suitable for all investors and should be considered as an investment for the risk capital portion of  the investor’s portfolio. The strategies employed in the management of alternative investments may accelerate the velocity of potential losses. Stock investing may involve risk including loss of principal.

Equity Sectors

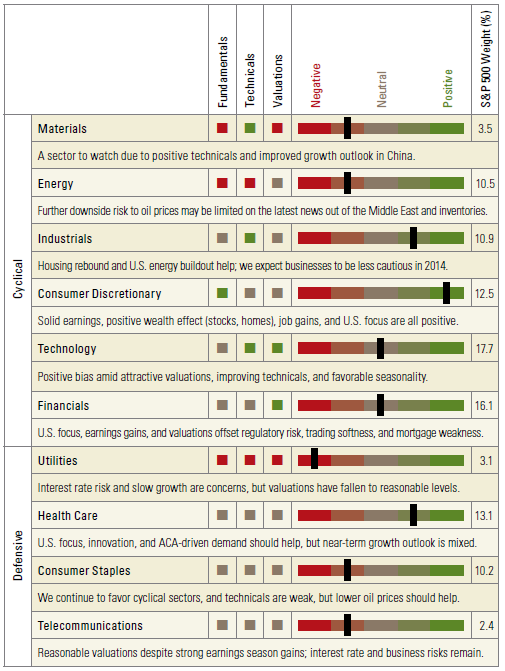
More Balanced Sector Mix After Health Care Upgrade to Neutral

We continue to favor cyclical sectors over defensives over the balance of the year, but our near-term views are balanced as we anticipate a modest pullback in the S&P 500.

While we continue to expect a pickup in business spending, our lowered technology view reflects a weaker earnings outlook and deteriorating technicals. Industrials is our favored way to play a potential pickup in business spending.

Our recent decision to lower our materials view reflected the risk to China’s growth and strength in the US dollar amid concerns that the Federal Reserve (Fed) will soon pare back  stimulus.

Our energy view remains neutral due to our expectation that elevated inventories will prevent a rebound in crude oil prices from current levels in the high $80s.

Our upgraded, neutral health care view reflects our desire to balance out the economic sensitivity of our sector mix, policy clarity, and a strong technical picture.

Our utilities view is modestly negative due to interest rate risk and rich valuations, although our outlook is less negative amid improved technicals.

Our consumer staples view is neutral despite rich valuations due to the potential to benefit from lower commodity prices and the potential for a pullback.

Our financials view is modestly negative. Bank fundamentals have improved some, but the challenging regulatory and interest rate environment persists and loan growth is stalling.

Equity_Sectors_Graphic

Because of their narrow focus, sector investing will be subject to greater volatility than investing more broadly across many sectors and companies.

Fixed Income

Focus on Higher-Yielding Segments Due to Better Valuation and as Buffer Against Rise in Rates

  • A range-bound environment persists in the bond market. Lingering uncertainties augur for a stable rate environment, which favors intermediate bonds that still possess a substantial yield advantage relative to short-term bonds.
  • By committing to refrain from raising interest rates until unemployment falls to 6.5%, intermediate maturity bonds may also benefit from Fed policy as investors seek higher yields amid a low-yield world.
  • We continue to find municipal bonds among the more attractive high-quality bond options, and valuations remain attractive following a difficult March.

Focus on Higher-Yielding Segments Due to Better Valuation and as Buffer Against Rise in Rates

  • We upgrade emerging market debt following underperformance during the first quarter relative to other higher-yielding segments of the bond market, thereby providing an opportunity for investors.
  • Higher-yielding, fundamentally sound segments of the bond market such as high-yield bonds, bank loans, and preferred securities remain attractive, but we temper our enthusiasm due to a strong start to 2013. Lower yields and higher valuations augur for lower returns going forward.
  • Bank loans remain attractive due to a much narrower yield differential to high-yield bonds.

Fixed_Income_Graphic

All bonds are subject to market and interest rate risk if sold prior to maturity. Bond values will decline as interest rates rise and are subject to availably and change in price. High-yield/junk bonds are not investment-grade securities, involve substantial risks, and generally should be part of the diversified portfolio of sophisticated investors. Mortgage-backed securities are subject to credit, default risk, prepayment risk that acts much like call risk when you get your principal back sooner than the stated maturity, extension risk, the opposite of prepayment risk, and interest rate risk. International and emerging market investing involves risks such as currency fluctuation and political instability and may not be suitable for all investors. Bank loans are loans issued by below investment-grade companies for short term funding purposes with higher yield than short-term debt and involve risk. Treasury inflation-protected securities (TIPS) help eliminate inflation risk to your portfolio as the principal is adjusted semiannually for inflation based on the Consumer Price Index – while providing a real rate of return guaranteed by the U.S. government. Corporate bonds are considered higher risk than government bonds but normally offer a higher yield and are subject to market, interest rate and credit risk as well as additional risks based on the quality of issuer coupon rate, price, yield, maturity and redemption features. Foreign Bonds – Hedged: Non-U.S. fixed income securities generally from investment-grade issuers in developed countries, with hedged currency exposure. Foreign Bonds – Unhedged: Non-U.S. fixed income securities normally denominated in major foreign currencies.

DEFINITIONS:

EQUITY AND ALTERNATIVES ASSET CLASSES
Large Growth: Stocks in the top 70% of the capitalization of the U.S. equity market are defined as Large Cap. Growth is defined based on fast growth (high growth rates for earnings,
sales, book value, and cash flow) and high valuations (high price ratios and low dividend yields).

Large Value: Stocks in the top 70% of the capitalization of the U.S. equity market are defined as Large Cap. Value is defined based on low valuations (low price ratios and high dividend
yields) and slow growth (low growth rates for earnings, sales, book value, and cash flow).

Mid Growth: The U.S. mid-cap range for market capitalization typically falls between $1 billion and $8 billion and represents 20% of the total capitalization of the U.S. equity market.
Growth is defined based on fast growth (high growth rates for earnings, sales, book value, and cash flow) and high valuations (high price ratios and low dividend yields).

Mid Value: The U.S. Mid Cap range for market capitalization typically falls between $1 billion and $8 billion and represents 20% of the total capitalization of the U.S. equity market. Value
is defined based on low valuations (low price ratios and high dividend yields) and slow growth (low growth rates for earnings, sales, book value, and cash flow).

Small Growth: Stocks in the bottom 10% of the capitalization of the U.S. equity market are defined as Small Cap. Growth is defined based on fast growth (high growth rates for earnings,
sales, book value, and cash flow) and high valuations (high price ratios and low dividend yields).

Small Value: Stocks in the bottom 10% of the capitalization of the U.S. equity market are defined as Small Cap. Value is defined based on low valuations (low price ratios and high
dividend yields) and slow growth (low growth rates for earnings, sales, book value, and cash flow).

U.S. Stocks: Stock of companies domiciled in the U.S.

Large Foreign: Large-cap foreign stocks have market capitalizations greater than $5 billion. The majority of the holdings in the large foreign category are in the MSCI EAFE Index.
Small Foreign: Small-cap foreign stocks typically have market capitalizations of $250M to $1B. The majority of the holdings in the small foreign category are in the MSCI Small Cap EAFE Index.

Emerging Markets: Stocks of a single developing country or a grouping of developing countries. For the most part, these countries are in Eastern Europe, Africa, the Middle East, Latin
America, the Far East and Asia.

REITs: REITs are companies that develop and manage real-estate properties. There are several different types of REITs, including apartment, factory-outlet, health-care, hotel, industrial, mortgage, office, and shopping center REITs. This would also include real-estate operating companies.

Commodities – Industrial Metals: Stocks in companies that mine base metals such as copper, aluminum and iron ore. Also included are the actual metals themselves. Industrial metals
companies are typically based in North America, Australia, or South Africa.

Commodities – Precious Metals: Stocks of companies that do gold- silver-, platinum-, and base-metal-mining. Precious-metals companies are typically based in North America, Australia, or South Africa.

Commodities – Energy: Stocks of companies that focus on integrated energy, oil & gas services, oil & gas exploration and equipment. Public energy companies are typically based in North America, Europe, the UK, and Latin America.

Merger Arbitrage is a hedge fund strategy in which the stocks of two merging companies are simultaneously bought and sold to create a riskless profit. A merger arbitrageur looks at
the risk that the merger deal will not close on time, or at all. Because of this slight uncertainty, the target company’s stock will typically sell at a discount to the price that the combined
company will have when the merger is closed. This discrepancy is the arbitrageur’s profit.

Long/Short is an investment strategy generally associated with hedge funds. It involves buying long equities that are expected to increase in value and selling short equities that are
expected to decrease in value.

EQUITY SECTORS

Materials: Companies that engage in a wide range of commodity-related manufacturing. Included in this sector are companies that manufacture chemicals, construction materials, glass,
paper, forest products and related packaging products, metals, minerals and mining companies, including producers of steel.

Energy: Companies whose businesses are dominated by either of the following activities: The construction or provision of oil rigs, drilling equipment and other energy-related service and equipment, including seismic data collection or the exploration, production, marketing, refining and/or transportation of oil and gas products, coal and consumable fuels.

Industrials: Companies whose businesses: Manufacture and distribute capital goods, including aerospace and defense, construction, engineering and building products, electrical
equipment and industrial machinery; provide commercial services and supplies, including printing, employment, environmental and office services; provide transportation services,
including airlines, couriers, marine, road and rail, and transportation infrastructure.

Consumer Discretionary: Companies that tend to be the most sensitive to economic cycles. Its manufacturing segment includes automotive, household durable goods, textiles and apparel, and leisure equipment. The service segment includes hotels, restaurants and other leisure facilities, media production and services, consumer retailing and services and education services.

Technology: Companies that primarily develop software in various fields such as the Internet, applications, systems and/or database management and companies that provide information technology consulting and services. Technology hardware & equipment include manufacturers and distributors of communications equipment, computers and peripherals, electronic equipment and related instruments, and semiconductor equipment and products.

Financials: Companies involved in activities such as banking, consumer finance, investment banking and brokerage, asset management, insurance and investment, and real estate, including REITs.

Utilities: Companies considered electric, gas or water utilities, or companies that operate as independent producers and/or distributors of power.

Health Care: Companies in two main industry groups: Healthcare equipment and supplies or companies that provide healthcare-related services, including distributors of healthcare
products, providers of basic healthcare services, and owners and operators of healthcare facilities and organizations or companies primarily involved in the research, development,
production and marketing of pharmaceuticals and biotechnology products.

Consumer Staples: Companies whose businesses are less sensitive to economic cycles. It includes manufacturers and distributors of food, beverages and tobacco, and producers of non-durable household goods and personal products. It also includes food and drug retailing companies.

Telecommunications: Companies that provide communications services primarily through a fixed line, cellular, wireless, high bandwidth and/or fiber-optic cable network.

FIXED INCOME

Credit Quality: An individual bond’s credit rating is determined by private independent rating agencies such as Standard & Poor’s, Moody’s and Fitch. Their credit quality designations
range from high (‘AAA’ to ‘AA’) to medium (‘A’ to ‘BBB’) to low (‘BB’, ‘B’, ‘CCC’, ‘CC’ to ‘C’).

Duration: A measure of the sensitivity of the price (the value of principal) of a fixed-income investment to a change in interest rates. Duration is expressed as a number of years. Rising
interest rates mean falling bond prices, while declining interest rates mean rising bond prices. The bigger the duration number, the greater the interest-rate risk or reward for bond prices.

Munis – Short-term: Bonds issued by various state and local governments to fund public projects. The income from these bonds is generally free from federal taxes. These bonds generally have maturities of less than three years.

Munis – Intermediate: Bonds issued by various state and local governments to fund public projects. The income from these bonds is generally free from federal taxes. These bonds
generally have maturities of between 3 and 10 years.

Munis – Long-term: Bonds issued by various state and local governments to fund public projects. The income from these bonds is generally free from federal taxes. These bonds generally
have maturities of more than 10 years.

Munis – High-yield: Bonds issued by various state and local governments to fund public projects. The income from these bonds is generally free from federal taxes. These bonds generally
offer higher yields than other types of bonds, but they are also more vulnerable to economic and credit risk. These bonds are rated BB+ and below.
Treasuries: A marketable, fixed-interest U.S. government debt security. Treasury bonds make interest payments semi-annually and the income that holders receive is only taxed at the federal level.

TIPS (Treasury Inflation Protected Securities): A special type of Treasury note or bond that offers protection from inflation. Like other Treasuries, an inflation-indexed security pays interest every six months and pays the principal when the security matures. The difference is that the underlying principal is automatically adjusted for inflation as measured by the consumer price index (CPI).

Mortgage-Backed Securities: A type of asset-backed security that is secured by a mortgage or collection of mortgages. These securities must also be grouped in one of the top two ratings as determined by a accredited credit rating agency, and usually pay periodic payments that are similar to coupon payments. Furthermore, the mortgage must have originated from a regulated and authorized financial institution.

Investment-Grade Corporates: Securities issued by corporations with a credit ratning of BBB- or higher. Bond rating firms, such as Standard & Poor’s, use different designations consisting of upper- and lower-case letters ‘A’ and ‘B’ to identify a bond’s investment-grade credit quality rating. ‘AAA’ and ‘AA’ (high credit quality) and ‘A’ and ‘BBB’ (medium credit quality) are considered investment-grade.

Preferred Stocks: A class of ownership in a corporation that has a higher claim on the assets and earnings than common stock. Preferred stock generally has a dividend that must be paid
out before dividends to common stockholders and the shares usually do not have voting rights.

High-Yield Corporates: Securities issued by corporations with a credit rating of BB+ and below. These bonds generally offer higher yields than investment-grade bonds, but they are also
more vulnerable to economic and credit risk.

Bank Loans: In exchange for their credit risk, these floating-rate bank loans offer interest payments that typically float above a common short-term benchmark such as the London
interbank offered rate, or LIBOR.

Foreign Bonds – Hedged: Non-U.S. fixed income securities generally from investment-grade issuers in developed countries, with hedged currency exposure.

Foreign Bonds – Unhedged: Non-U.S. fixed income securities normally denominated in major foreign currencies.

Emerging Market Debt: The debt of sovereigns, agencies, local issues, and corporations of emerging markets countries and subject to currency risk.

______________________________________________________________________________________________________________________________________________

IMPORTANT DISCLOSURES

The opinions voiced in this material are for general information only and are not intended to provide or be construed as providing specific investment advice or recommendations for any individual. To determine which investments may be appropriate for you, consult your financial advisor prior to investing. All performance referenced is historical and is no guarantee of future results. All indexes are unmanaged and cannot be invested into directly.

Past performance is no guarantee of future results.

For the purposes of this publication, intermediate-term bonds have maturities between 3 and
Stock investing involves risk including loss of principal.

Preferred stock investing involves risk, which may include loss of principal.

Distressed investing involves significant risks, including a total loss of capital. The risks associated with distressed investing arise from several factors including: limited diversification,
the use of leverage, limited liquidity, and the possibility that investors may be required to accept cash or securities with a value less than their original investment and/or may be required to accept payment over an extended period of time.

The Standard & Poor’s 500 Index is a capitalization-weighted index of 500 stocks designed to measure performance of the broad domestic economy through changes in the aggregate
market value of 500 stocks representing all major industries.

This research material has been prepared by LPL Financial.

To the extent you are receiving investment advice from a separately registered independent investment advisor, please note that LPL Financial is not
an affiliate of and makes no representation with respect to such entity.

Not FDIC or NCUA/NCUSIF Insured | No Bank or Credit Union Guarantee | May Lose Value | Not Guaranteed by any Government Agency | Not a Bank/Credit Union Deposit

The Market’s March Madness
March 21, 2013

It has been a sweet sixteen weeks for the S&P 500. The broad stock market index has had only three down weeks out of the past sixteen. While
this stretch is tied by the same period a year ago, it is important to note that there has not been a sixteen-week period with fewer weeks of losses in
over 20 years — since the period ending September 1, 1989.

March has been maddening for investors in the past few years (2010 – 2012) as the S&P 500 raced higher in March only to reverse all of those gains in a pullback of about 10% that began in late March or April. It later took stocks at least five months to climb back to the peaks of March.

As the NCAA tournament gets down to its own sweet sixteen at the end of this week, it is a good time to reflect on the competing drivers of the markets that may make for an exciting showdown in the weeks and months to come.

March Madness Bracket

As we narrow down stocks’ “sweet sixteen” potential drivers this year, the four “regions” of market-moving factors vying for investor attention are: economy, policy, fundamentals, and market dynamics.

Economy

  • „Employment – Job growth has been picking up with more than 200,000 jobs created in three of the past four months and first-time filings for unemployment benefits have started to fall after stabilizing around 350,000 for over a year.
  • Housing – The powerfully rebounding housing market, as seen in data such as housing starts and building permits, is a positive for growth.
  • Confidence – Last week’s University of Michigan data showed that consumer confidence fell sharply in the preliminary reading for March to the lowest level in over a year.
  • Gasoline Prices – Retail gasoline prices are back up near the “danger zone” that coincided with stock market pullbacks in each of the past few years.

Policy

  • „Federal Reserve – “Don’t Fight the Fed” rally is intact, but as the Federal Reserve publicly contemplates ending the latest stimulus program, the stock market may suffer the same sell-off that surrounded the ending of prior quantitative easing programs, so-called QE1 and QE2.
  • Europe – With the Eurozone back in recession, an inconclusive election leaving no government in Italy, a political scandal hampering the ability to implement needed reforms in Spain, Greece unlikely to meet the terms of its own bailout, and Germany pushing hard terms on any aid ahead of its fall elections, the events in Cyprus could provide the catalyst for another Europe-driven spring slide in the world’s stock markets.
  • Geopolitics – The hot spots are heating up again given the power grab following the death of Chavez in Venezuela, the coming elections in Iran, different factions vying for power in war-torn Syria, and North Korea annulling its cease fire agreement.
  • Fiscal Cliff – A fiscal drag on gross domestic product (GDP) of about 2%, and showdowns over the continuing resolution funding the government and the debt ceiling still to come, may weigh on investor sentiment as the recently implemented sequester threatens to halt labor market improvement with an estimated cost of 750,000 jobs, according to the Congressional Budget Office.

Fundamentals

  • „Earnings – Earnings are the most fundamental of all drivers of stocks.  Earnings growth has been the most consistent factor driving the markets in recent years, but growth has now slowed to the low-single digits for S&P 500 companies.
  • Valuations – The price-to-earnings ratio of the S&P 500, at around 15 on the past four quarters’ earnings, is well below the 17 – 18 seen at the end of all prior bull markets since WWII.
  • Credit – Demand for credit has improved and credit spreads have

    narrowed; both trends are key supports to growth.

  • Corporate Cash – Strong cash balances provide a cheap source of

    capital to invest and incentive to buy back shares to boost earnings per s

    hare growth.

Market Dynamics

  • „Momentum – Stocks have been on a strong winning streak that could continue.
  • Volume – Trading volume in the markets has been light this year, 10 – 15% below last year, traditionally seen as a sign that a trend has become vulnerable.
  • Volatility – Investors have once again become net sellers of U.S. stock mutual funds in the past two weeks, according to data from the Investment Company Institute (ICI), despite strong and steady gains. A return to more volatile markets may further undermine individual investor support.
  • Interest Rates – Interest rates are on the rise, potentially acting as a drag on everything from housing to the U.S. budget, but from very low levels.

There are quite a few listed here, but these certainly are not all the factors that are influencing the markets.

The key message for investors in considering these factors is: don’t be too confident in any particular outcome. Respect the complexity of the situation. This is a time for caution and taking some profits, not for indiscriminate selling. It is a time to nibble at opportunities as they emerge; it is not a time to jump in with both feet.

Investing is not a game, but it is important also to remember that forecasting is not an exact science, and many factors can affect outcomes that are hard to predict. Two years ago, the Japanese earthquake had a big impact on markets and natural disasters — despite tremendous advances in technology — are very hard to predict with any degree of accuracy. Geopolitical outcomes can also be hard to foresee as we look to the stresses in the Middle East. For example, the outcome of the Arab Spring uprisings and the changes they have led to in countries including Syria and Egypt were hard to foresee. The markets rarely offer perfect clarity on their direction because they are driven by these factors as well as many others. Even this week’s NCAA March Madness can be seen as a reminder of how it can be notoriously hard to predict winners. Historically, a team’s ranking has meant nothing after getting down to the elite eight.

These factors will play out in the markets over the course of the year, not just in the coming weeks. This means there will likely be some upsets that result in volatility and pullbacks as these factors face off against each other. In the end, we expect a positive year with many opportunities for investors.

____________________________________________________________________________________________________________________________________________

IMPORTANT DISCLOSURES
The opinions voiced in this material are for general information only and are not intended to provide specific advice or recommendations for any individual. To determine which investment(s) may be appropriate for you, consult your financial advisor prior to investing. All performance reference is historical and is no guarantee of future results. All indices are unmanaged and cannot be invested into directly.

The economic forecasts set forth in the presentation may not develop as predicted and there can be no guarantee that strategies promoted will be successful.

Stock and mutual fund investing involves risk, including the risk of loss.

The Standard & Poor’s 500 Index is an unmanaged index, which cannot be invested into directly. Past performance is no guarantee of future results.

Quantitative easing is a government monetary policy occasionally used to increase the money supply by buying government securities or other securities from the market. Quantitative easing increases the money supply by flooding financial institutions with capital in an effort to promote increased lending and liquidity.

The Congressional Budget Office is a non-partisan arm of Congress, established in 1974, to provide Congress with non-partisan scoring of budget proposals.

The P/E ratio (price-to-earnings ratio) is a measure of the price paid for a share relative to the annual net income or profit earned by the firm per share. It is a financial ratio used for valuation: a higher P/E ratio means that investors are paying more for each unit of net income, so the stock is more expensive compared to one with lower P/E ratio.

Earnings per share (EPS) is the portion of a company’s profit allocated to each outstanding share of common stock. EPS serves as an indicator of a company’s profitability. Earnings per share is generally considered to be the single most important variable in determining a share’s price. It is also a major component used to calculate the price-to-earnings valuation ratio.
The Investment Company Institute (ICI) is the national association of U.S. investment companies, including mutual funds, closed-end funds, exchange-traded funds (ETFs) , and unit investment trusts (UITs). Members of ICI manage total assets of $11.18 trillion and serve nearly 90 million shareholders.

The credit spread is the yield the corporate bonds less the yield on comparable maturity Treasury debt. This is a market-based estimate of the amount of fear in the bond market Bass-rated bonds are the lowest quality bonds that are considered investment-grade, rather than high-yield. They best reflect the stresses across the quality spectrum.

International and emerging market investing involves special risks such as currency fluctuation and political instability and may not be suitable for all investors.

____________________________________________________________________________________________________________________________________________

INDEX DESCRIPTIONS
The Standard & Poor’s 500 Index is a capitalization-weighted index of 500 stocks designed to measure performance of the broad domestic economy through changes in the aggregate market value of 500 stocks representing all major industries.

____________________________________________________________________________________________________________________________________________
„This research material has been prepared by LPL Financial.

To the extent you are receiving investment advice from a separately registered independent investment advisor, please note that LPL Financial is not
an affiliate of and makes no representation with respect to such entity.

Not FDIC or NCUA/NCUSIF Insured | No Bank or Credit Union Guarantee | May Lose Value | Not Guaranteed by any Government Agency | Not a Bank/Credit Union Deposit

Beige Book Bounce-Back
March 13, 2013

Positive Tone; More Modest Expansion 

Our proprietary “Beige Book Barometer” ticked up to +66 in March 2013 (from +56 in January 2013), continuing the rebound from a Superstorm Sandy-related dip to +30 in November 2012. Despite the post-Sandy bounce, our Barometer remains well below its recent high of +101, hit in April 2012, and describes an economy that is growing — but only Screen Shot 2013-03-13 at 5.20.34 PMmodestly. The improvement in our Barometer since November 2012 has come as the number of positive words in the Beige Book surged to a nine-month high. The number of negative words ticked up slightly between the January and March 2013 Beige Books, but remains well below the levels seen just after Superstorm Sandy hit.

Our Barometer, a diffusion index that measures the number of times the word “strong” or its variations (stronger, strength, strengthen, etc.) appear in the Beige Book less the number of times the word “weak” or its variations (weaken, weaker, etc.) appear, is displayed in Figure 1. The barometer is an effective, quantitative way to derive the shades between strong and weak in the predominately qualitative Beige Book report.

Still Bouncing Back From the Fiscal Cliff and Sandy

When we wrote about the Beige Book in early December 2012, we noted that despite the tepid reading of our Barometer in November 2012 (+30), there was some reason for modest optimism on the economic outlook. First, the Barometer generally suggested the economy was stronger during the summer and early Screen Shot 2013-03-13 at 5.21.02 PMfall of 2012, prior to the impact of Superstorm Sandy and uncertainty ahead of the fiscal cliff than it was in early 2011, before the bruising debt ceiling debate. In addition, we noted that many of the factors that weighed on our Barometer in November 2012 appeared to be temporary. Indeed, with key indicators like consumer sentiment hitting a five-year high, a sustainable housing recovery in place, and the private economy adding more than 200,000 jobs per month in four of the past five months, the U.S. economy is now on a firmer footing than it was in the summer and fall of 2011. A big driver of the uncertainty in the November 2012 Beige Book was Superstorm Sandy, which had 48 mentions, and virtually all of the mentions were associated with disruptions to economic activity.

In contrast, nearly every one of the 25 mentions of Sandy in January 2013 and all but one of the 11 mentions in the March 2013 edition of the Beige Book was associated with a rebound in, or resumption of, economic activity that was disrupted by the storm in late 2012. Because of the timing of the collection of comments for the January 2013 Beige Book (comments Screen Shot 2013-03-13 at 5.21.40 PMfrom contacts in the business and banking community were collected throughout December 2012 and in the first few days of January 2013), we noted that the Beige Book likely overstated the impact of the fiscal cliff on economic activity in early 2013. Indeed, there were 38 mentions of the word “fiscal” in the January 2013 Beige Book, and almost every mention was accompanied by a word like “uncertainty.” Clearly, the uncertainty was a drag on economic activity among consumers and businesses alike as 2012 drew to a close.

The word “fiscal” appeared just 17 times in the March 2013 Beige Book, and almost all of them were used in a negative context. Looking ahead, the word “sequester” (across the board federal spending cuts that began to go into effect on March 1, 2013) is likely to make a prominent appearance in the next several Beige Books. However, with the debt ceiling debate and possible government shutdown now pushed back until August or September 2013, fiscal uncertainty outside of the impact of the sequester may fade in upcoming Beige Books. The rebound from Sandy will also likely fade in the coming months, although rebuilding from the storm may take years.

While the fiscal cliff debate and the sequester — along with the impact of Sandy may be temporary, though significant — other more persistent factors have weighed on the Barometer since it peaked in April 2012. The ongoing recession in Europe, the economic slowdown in China, the severe damage to the agricultural economy as a result of the drought, and a return to “normal” weather all helped to push the Beige Book Barometer down from +101 in April 2012 to around +50 over the summer and early fall of 2012.

As we expected, the uncertainty surrounding the fiscal cliff and the disruptions caused by Sandy have reversed in recent Beige Books, and our Barometer has returned to the +60 range seen over the spring and summer of 2012. A quick look at Figure 1, however, reveals that our Barometer remains below the range seen in 2005 and 2006, the years just prior to the Great Recession. In short, the Barometer is consistent with other more quantitative metrics on the U.S. economy that suggest that the economy rebounded from the impact of Sandy in early 2013, but is still not back to “normal,” where normal is defined as the pre-Great Recession years of 2005 – 2006, where real gross domestic product (GDP) growth averaged between 2.5% and 3.0%.

Screen Shot 2013-03-13 at 5.21.51 PM

Word Clouds Show Modest Expansion

The nearby word clouds are dominated by words describing the tone of the economy when the Beige Books were published. Screen Shot 2013-03-13 at 5.23.05 PMBelow are some observations on the current Beige Book (released on March 6, 2013) relative to other recent editions of the Beige Book.

  • The economy continued to expand at a “modest to moderate pace” in February and early March 2013. Although the Beige Book corroborates other, more quantitative evidence that the economy is expanding modestly, it is not doing so at a pace that would concern the Federal Reserve that there is upward pressure on wages or prices, which in turn might cause the Fed to slow down or stop its latest round of quantitative easing. The latest Beige Book described wages pressures as “mostly limited” and pricing pressures as “modest.”
  • In the Beige Books released in late November 2012 and early January 2013, economic uncertainty surrounding the fiscal cliff and the rebound from the economic disruption wrought by Superstorm Sandy dominated. There were 43 mentions of “uncertainty,” 25 of “Sandy,” and 38 of “fiscal” in the January 2013 Beige Book, and 26 mentions of “uncertainty,” 48 of “Sandy,” and 15 of “fiscal” in the November 2012 Beige Book. In the latest Beige Book, there were just 26 mentions of “uncertainty,” only 11 of “Sandy,” and just 17 of “fiscal.” While the battle over the sequester (and impact on the economy) is likely to begin appearing in the Beige Books released over the next few quarters, all of these words will likely fade as concerns. However, the debt ceiling debate is likely to heat up again in mid-to-late summer 2013, and could once again return fiscal uncertainty to the pages of the Beige Book.
  • The word “confidence” appeared 11 times in the latest Beige Book. However, unlike in 2011 and most of 2012, when the word was used in a negative context (i.e., lack of confidence, weak confidence), nine of the 11 mentions in the latest Beige Book were in a positive context. Thus, over the past few Beige Books since Superstorm Sandy, business and banking contacts have generally seen increased confidence in the recovery, especially in housing. This suggests that a sustained, multiyear recovery in the housing market is likely underway.
  • Health care, health insurance, and the Affordable Care Act (ACA) were mentioned a total of 15 times in the latest Beige Book, up from eight mentions in the January 2013 Beige Book. In contrast, those words were found just three times in the Beige Book released a year ago (February 2012). We will continue to monitor these health care words closely in the upcoming Beige Books, as the economy continues to adjust to the impact of the ACA.
  • In the Beige Book released in January 2013, China received no mentions, marking the first time since early 2012 that China was not mentioned by business and banking contacts. In the March 2013 edition, China had six mentions, many related to the timing of the Chinese Lunar New Year in 2013 (February) versus 2012 (January). Over the course of 2012, the financial media was chock full of stories on the economic slowdown in China and the recession and debt crisis in Europe. The Beige Book suggests that while those issues have not entirely disappeared from Main Street’s radar, they are far less of a concern than the media makes them out to be. Indeed, the last time China warranted as many as six mentions was in January 2012, as fears of a “hard landing” in China began to gather steam. The Chinese economy appeared to have bottomed out in late 2012, avoiding a “hard landing.” The recent data suggest that China’s economy is re-accelerating as 2013 begins, although, as the Beige Book points out, the timing of the Lunar New Year this year, which can impact economic data, is making it difficult to draw any conclusions about the health of the Chinese economy right now.
  • Despite the recent flare-up in Europe, related to the lack of a clear winner in the Italian presidential elections, there were only six mentions of Europe in the latest Beige Book, down from eight in January 2013’s Beige Book. The six mentions in March’s Beige Book were well below the 15 – 20 mentions seen in the summer and fall of 2012, as Europe struggled through elections in Greece and increased fears of a break-up. Not surprisingly, nearly all of the mentions of Europe in the latest Beige Book were in a negative context. Perhaps business and banking contacts on Main Street are not as exposed to Europe as some of the larger businesses and financial institutions on Wall Street that dominate media coverage. But it is also worth noting that the European debt crisis is in its fourth year, and Main Street may be getting used to it now.

_______________________________________________________________________________________IMPORTANT DISCLOSURES

The opinions voiced in this material are for general information only and are not intended to provide specific advice or recommendations for any individual. To determine which investment(s) may be appropriate for you, consult your financial advisor prior to investing. All performance reference is historical and is no guarantee of future results. All indices are unmanaged and cannot be invested into directly.

Gross domestic product (GDP) is the monetary value of all the finished goods and services produced within a country’s borders in a specific time period, though GDP is usually calculated on an annual basis. It includes all of private and public consumption, government outlays, investments and exports less imports that occur within a defined territory.

The economic forecasts set forth in the presentation may not develop as predicted and there can be no guarantee that strategies promoted will be successful.

Stock investing involves risk including loss of principal.

The Federal Open Market Committee action known as Operation Twist began in 1961. The intent was to flatten the yield curve in order to promote capital inflows and strengthen the dollar. The Fed utilized open market operations to shorten the maturity of public debt in the open market. The action has subsequently been reexamined in isolation and found to have been more effective than originally thought. As a result of this reappraisal, similar action has been suggested as an alternative to quantitative easing by central banks.

The Federal Open Market Committee (FOMC), a committee within the Federal Reserve System, is charged under the United States law with overseeing the nation’s open market operations (i.e., the Fed’s buying and selling of United States Treasure securities).

_______________________________________________________________________________________INDEX DESCRIPTIONS

Purchasing Managers Index (PMI) is an indicator of the economic health of the manufacturing sector. The PMI index is based on five major indicators: new orders, inventory levels, production, supplier deliveries and the employment environment.

The Consumer Price Index (CPI) is a measure of the average change over time in the prices paid by urban consumers for a market basket of consumer goods and services.

_______________________________________________________________________________________ This research material has been prepared by LPL Financial.

To the extent you are receiving investment advice from a separately registered independent investment advisor, please note that LPL Financial is not an affiliate of and makes no representation with respect to such entity.

Not FDIC/NCUA Insured | Not Bank/Credit Union Guaranteed | May Lose Value | Not Guaranteed by any Government Agency | Not a Bank/Credit Union Deposit

_______________________________________________________________________________________

Stay Connected with Us!


www.garrettandrobinson.com

Overcoming the Twin Ceiling Conundrum
January 29, 2013

Burt White PhotoThe so-called fiscal cliff, a series of economically devastating tax increases and spending cuts that were due to come on line at the start of 2013, was temporarily averted after a last-second deal in Congress. The compromise, known as the American Taxpayer Relief Act of 2012, is not the grand solution to our nation’s surging debt issues that many had hoped for. Rather, it is more like a temporary Band-Aid that resolved most of the revenue (tax) elements of the fiscal cliff, but delayed addressing and resolving the tougher decisions surrounding spending cuts and raising the debt ceiling until later in 2013.

This leaves the market held hostage by the resolution of part of the fiscal problem, and the anxiety of knowing that the rest of the problem will be looming over the next few months. In a sense, the market faces a period of the dreaded no-man’s-land — sandwiched between partial clarity and nervous unknown.

I have always felt that markets (and unfortunately our government) are great parallels to raising children. In particular, market recoveries remind me somewhat of parental advice I once received from my grandmother, who said: “you know your kids are growing up when they stop asking you where they came from and start refusing to tell you where they are going.”

You see, many investors often miss the early parts of market rallies coming out of the recessions, including the most recent Great Recession of 2008. This is because, similar to the quote above, early in a market recovery investors are often focused on where the market has been and less on where it is going. As a result, the backward glance creates a slow re-engagement in the markets for many investors.

But like kids growing up, eventually investor focus turns to where the market is going. However, as a market rally matures, the future direction becomes cloudier as the market’s growth climbs higher toward the “ceiling” that eventually caps all recoveries. In a sense, a mature market rally resembles teenagers — still growing, but increasingly mysterious and quite volatile.

And, like my and your kids, the market isn’t going to tell you where it’s going.

It Is 11PM. Do You Know Where Your Market Rally Is?

Figure 1 - Bumping Up Against the Marketing CeilingThe level of mystery related to the eventual resolution of the nation’s fiscal dilemma comes as the market, as measured by the S&P 500 Index, currently sits close to its all-time highs (the ceiling) established in 2000 and again in 2007. Therefore, as Figure 1 illustrates, during this 15-year time period the market has rallied twice only to find an invisible, albeit solid, ceiling that has limited further market advances. The levels were 1527 in 2000 and 1565 in 2007. The question remains: can the market finally break through the ceiling and find new market highs given the level of lingering uncertainty?

2013 may indeed see the market challenge its all-time “ceiling,” which is currently about 5% away. However, it is our opinion that this will not happen until all of the components of the fiscal cliff are resolved — including the spending/debt ceiling questions that loom as a specter over this market.

This is the Twin Ceiling Conundrum: the irony that resolving the impending debt dilemma may be the catalyst to lift the market to further gains. But, until that happens: what is the best strategy to navigate this “teenaged” market that is bouncing up against a price ceiling that is hard to crack and being pushed down by concern over a debt ceiling that will be challenging to fix?

The Twin Ceiling Investment Strategy

Despite the fact that unknowns remain, there are plenty of investment strategies to effectively navigate the current twin ceiling environment. Frankly, uncertainty breeds opportunity, which a resourceful and adaptive investment strategy uses to its advantage. Our preferred strategies for this period are:

  • Managing the Trading Range
  • Recognizing the Decision Box
  • Seeking Clear Winners

Managing the Trading Range

We believe that the market will remain relatively range-bound over the near term, which refers to a type of market that seems to oscillate within a relatively confined price or trading range. Similar to a bouncy ball within a box, a trading range-bound market will simply “bounce” from the ceiling (top of the range) to the floor (bottom of the range).

Trading range markets often occur when there are conflicting positive and negative forces that keep the balance of power between bulls and bears at a standoff in a competitive bout of tug-of-war. On the upside, cheap valuations, a recovering U.S. housing market, steady employment gains, and the resurgence of China’s growth should provide enough positive ammunition to keep the bulls active. But the bears also have a powerful tug-of-war position, given the looming debt ceiling battle and slowing corporate earnings growth.

The end result is likely a stalemate over the near term, as any upper hand by either the bulls or the bears is quickly reversed. The result could be a relatively narrow trading range for the market. This certainly requires a different strategy for investors. First of all, if the market is confined to a range, the investment strategy that may work best is having the discipline to trim risk near the top end of the range and adding risk near the lower end of the range. Using a tactical approach, when the bulls get a temporary upper hand, a slight trim of risk is prudent, just as an addition to risk is likely a good approach to short-term market pullbacks.

Currently, the top end of the trading range is around 1527 on the S&P 500 Index, which is the 2000 market peak and a level that serves as a form of resistance that may prove difficult for the market to pass. The lower end of the trading range is around 1423 — a level that represents the average price level for the S&P 500 Index over the last 50 trading days (otherwise known as the 50-day simple moving average). In general, previous market peaks and key moving average levels are often boundaries for market moves, and in this case, likely serve as the ceiling and floor for our temporary trading range.

Recognizing the Decision Box

While we expect this market to be confined to a trading range over the near term, which could allow tactical allocators to add value, trading ranges do not last forever. And, you need to make sure you realize when you are really in one versus when you think you are in one. While the trim-at-the-top-and-add-at-the-bottom strategy works well in the trading range, any breakout or a pullback outside of the range needs to be watched for. In other words, the key is to know if the ceiling and floor of the trading range are made of wood or tissue paper.

While trading range markets can exist for lengthy periods of time, eventually, the balance of positive to negative news tips, and the tug-of-war turns from a stalemate to a trending market in one direction or the other. Essentially the strong ceiling or floor turns from wood to tissue paper. It is for this reason that a trading range is often referred to by market technicians — those investors that study market movements — as a decision box.

A decision box implies that when the market is in a trading range, it is essentially bouncing in a zone until there is a trend of good or bad news that creates a break out of the range — either to the upside or the downside. Therefore, with the current trading range serving as a decision box between the levels 1423 and 1527 for the S&P 500 Index, any sustained move outside of the boundaries would be considered a breakout. In a sense, it would be a decision made by the market that either the bulls or the bears have regained control.

There are certainly many factors that could drive this market out of its trading range, including better or worse news from the current earnings season, Europe, China, or a wide number of market-moving events. However, the most likely factors will be the ongoing battle and potential resolution of the debt ceiling that looms over the next few months. A shift and favorable resolution to the debt ceiling battle could result in a measured move by the market above the upper threshold levels of the decision box, while a drawn-out battle or even the failure to resolve the debate could be a bearish outcome of the decision box.

Seeking Clear Winners

Over long periods of time, factors like demographic trends, earnings, and valuations are the primary drivers of investment winners and losers. These macroeconomic forces shape the overall direction of the market and end up as the currents that push investment ideas to either strong or weak results. However, over shorter periods, like when in the decision box, these broad

macroeconomic forces take a back seat to more short-term, microeconomic factors that end up driving market behavior. Usually these micro themes are derived from economic data, short-term market-moving events, central bank activity, or geopolitical events.

In this current decision box, we see the following micro factors having the most significant impact on the market:

  1. Taxes: Given the early January compromise to avert a portion of the fiscal cliff by raising taxes on many Americans, there are some likely benefactors that could continue to post solid results including municipal bonds and master limited partnerships (MLPs). Both of these investments maintained their positive tax benefits and, as such, should demand a premium price in an environment of rising taxes.
  2. China and Emerging Markets: With developed markets facing austerity-related growth anchors, emerging markets have continued to benefit from robust organic growth.
  3. Industrials and Manufacturing Sectors: Higher taxes for the wealthiest Americans (who are also the largest spenders) combined with the elimination of the payroll tax cuts that affect nearly every worker could result in sluggish consumer spending. However, robust growth from China and a resurgence of business spending could boost manufacturing-related industries including infrastructure and transportation names, automotive-related companies, and industrials.
  4. Homebuilders: Despite uncertainty in the market, homebuilders appear to have turned the corner, as strong demand for new homes are beginning to emerge. The inventory of unsold existing homes now stands near 10-year lows, prompting demand for new building.

Stay Disciplined but Be Prepared to Duck

Over the short run, the market appears to be pinned in a decision box bound on the upside by an invisible ceiling but buoyed on the downside by a resurgent economy. As a result, the tug-of-war between bulls and bears will likely keep the market somewhat range-bound. Regardless, there are several themes that appear to have favorable short- and long-term investment potential that warrant consideration for opportunistic investors, including strategies benefitting from an environment of higher taxes, the soft-landing in China, the manufacturing renaissance, and the housing recovery.

As we started 2013, the bulls have had the upper hand, and as a result, the market currently stands closer to the top end of the decision box, suggesting that portfolio discipline remains a good strategy. After all, as a relatively tall guy that too often has to navigate tight spaces on planes and in cars, I can speak to my fair share of noggin bumps and bruises. Thus, as I have learned the hard way, the closer the ceiling, the more ready I need to be to duck. The same can be said for how to navigate this market and the fast approaching twin ceilings — stay disciplined in following your investment plan but just in case, be prepared to duck.

__________________________________________________________________________________________________________________________________________

IMPORTANT DISCLOSURES

The opinions voiced in this material are for general information only and are not intended to provide specific advice or recommendations for any individual. To determine which investment(s) may be appropriate for you, consult your financial advisor prior to investing. All performance reference is historical and is no guarantee of future results. All indices are unmanaged and cannot be invested into directly.

Tactical portfolios are designed to be monitored over a shorter time frame to potentially take advantage of opportunities as short as a few months, weeks, or even days. For these portfolios, more timely changes may allow investors to benefit from rapidly changing opportunities within the market.

Investing in foreign securities involves special additional risks. These risks include, but are not limited to, currency risk, political risk, and risk associated with varying accounting standards. Investing in emerging markets may accentuate these risks.

Because of their narrow focus, sector investing will be subject to greater volatility than investing more broadly across many sectors and companies.

This information is not intended to be a substitute for specific individualized tax advice. We suggest that you discuss your specific tax issues with a qualified tax advisor.

Bonds are subject to market and interest rate risk if sold prior to maturity. Bond values and yields will decline as interest rates rise and bonds are subject to availability and change in price.

Municipal bonds are subject to availability, price, and to market and interest rate risk if sold prior to maturity. Bond values will decline as interest rate rise.

Interest income may be subject to the alternative minimum tax. Federally tax-free but other state and local taxes may apply.

Master Limited Partnership (MLP) is a type of limited partnership that is publicly traded. There are two types of partners in this type of partnership: The limited partner is the person or group that provides the capital to the MLP and receives periodic income distributions from the MLP’s cash flow, whereas the general partner is the party responsible for managing the MLP’s affairs and receives compensation that is linked to the performance of the venture.

There is no assurance that the techniques and strategies discussed are suitable for all investors or will yield positive outcomes.

The purchase of certain securities may be required to effect some of the strategies. Investing involves risks including possible loss of principal.

The economic forecasts set forth in the presentation may not develop as predicted and there can be no guarantee that strategies promoted will be successful.

Stock investing involves risk including loss of principal.

__________________________________________________________________________________________________________________________________________

INDEX DEFINITIONS

The Standard & Poor’s 500 Index is a capitalization-weighted index of 500 stocks designed to measure performance of the broad domestic economy through changes in the aggregate market value of 500 stocks representing all major industries.

__________________________________________________________________________________________________________________________________________

This research material has been prepared by LPL Financial.

To the extent you are receiving investment advice from a separately registered independent investment advisor, please note that LPL Financial is not an affiliate of and makes no representation with respect to such entity.

Not FDIC/NCUA Insured | Not Bank/Credit Union Guaranteed | May Lose Value | Not Guaranteed by any Government Agency | Not a Bank/Credit Union Deposit