Tepid, but Points to Modest Optimism
Heavily influenced by the impact of Superstorm Sandy and the uncertainty generated by the election and fiscal cliff debate, our proprietary Beige Book Barometer (at +30), is down from a recent high in the April 2012 Beige Book (+101). The Barometer is now back down to the levels seen in the summer and fall of 2011, amid the disruptive debt ceiling debate in the United States and the fiscal and financial worries in Europe. Our “Beige Book Barometer,” a diffusion index that measures the number of times the word “strong” or its variations (stronger, strength, strengthen, etc.) appears in the Beige Book less the number of times the word “weak” or its variations (weaken, weaker, etc.) appears, is displayed in Figure 1. The Barometer is an effective, quantitative way to derive the shades between strong and weak in the predominately qualitative, overall report.
Rebuilding and Recovery Likely Ahead
Despite the tepid reading of our Beige Book Barometer, there is some reason for modest optimism. First, the Barometer generally suggested that the economy was stronger heading into the fiscal cliff and Sandy in the summer and fall of 2012 than it was in early 2011, ahead of the debt ceiling debate. Our Barometer averaged just over +60 in the spring and summer of 2012, well above the +40 reading seen, on average, in the first half of 2011. In addition, many of the factors weighing on our Barometer based on the most recent Beige Book appear to be temporary. The base path in our 2013 Outlook suggests that the economy will mostly avoid the fiscal cliff, and that in our view, the resolution of the debate around the fiscal cliff will likely lift some, but not all, of the uncertainty emanating from Washington. In addition, the significant disruption caused to the economy by Sandy that is reflected in the most recent Beige Book is likely to soon give way to rebuilding and recovery, and generate more positive words for our Barometer.
While the fiscal cliff debate and the impact of Sandy may be temporary, though significant, other more persistent factors have weighed on the Barometer since it peaked at +101 in April 2012. The ongoing recession in Europe, the economic slowdown in China, the severe damage to the agricultural economy as a result of the drought, and a return to “normal” weather all helped to push the Beige Book Barometer from +101 in April 2012 to around +50 over the summer of 2012.

Even if the uncertainty surrounding the fiscal cliff and the disruptions caused by Sandy reversed, and our Barometer returned to the +60 range seen over the spring and summer of 2012, it would still remain below the range seen in 2005 and 2006, the years just prior to the Great Recession. In short, the Beige Book Barometer is consistent with other more quantitative metrics on the U.S. economy that suggest that the economy is in recovery, and growing at around 2.0% (as measured by gross domestic product [GDP]) but is still not back to “normal,” where normal is defined as the pre-Great Recession years of 2005 – 2006, where real GDP growth averaged between 2.5% and 3.0%.


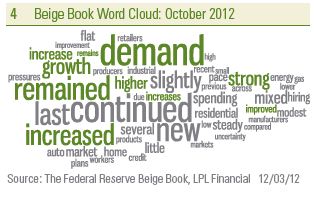
Word Clouds Show Measured Expansion
The nearby word clouds are dominated by words describing the tone of the economy at the time the Beige Books were published. Below are some observations on the current Beige Book (released on November 28, 2012) relative to other recent editions of the Beige Book.
- The economy is expanding at a measured pace, perhaps just a step down from the modest pace of expansion seen in the prior few Beige Books released over the summer and early fall of 2012.
- The latest Beige Book was dominated by uncertainty surrounding the fiscal cliff and the damage and disruption wrought by Superstorm Sandy, but nevertheless, described an economy that was growing, but severely impacted by uncertainty (26 mentions), Sandy (48), storm (44), and the fiscal cliff (15).
- The word “confidence,” which was used 11 times in the September 2011 Beige Book amid the worst of the situation in Europe, appeared just four times in the latest Beige Book. During the summer and fall of 2011, the word confidence appeared an average of eight times in each Beige Book. Increased uncertainty (Sandy, fiscal cliff, and election), rather than lack of economic confidence, seems to best describe the current economic environment on Main Street.
- The lack of rain and concerns over the drought in the midsection of the United States made another significant appearance in the latest Beige Book. The word “drought” was mentioned 18 times in November 2012, 19 times in October 2012, and 22 times in August 2012. Drought warranted only a handful of mentions in the Beige Book in early 2012. The word “crop” was mentioned 20 times in the November Beige Book, after 26 mentions in October and 22 in August. A look back to the Beige Books of a year ago (July – November 2011) finds that drought was also a concern (mentioned 31 times in those four Beige Books). However, in the last four Beige Books (July – November 2012) the word drought appeared 62 times. Looking ahead, we would expect drought and the damage to crops due to the lack of rain this past summer in the Midwest to continue to impact the Beige Book in the coming months.
- The financial media is chock full of stories on the economic slowdown in China and the recession and debt crisis in Europe. The Beige Book suggests that while those issues have not entirely disappeared from Main Street’s radar, they are far less of a concern than the media makes them out to be. China was mentioned just twice in the latest Beige Book, up from one mention in each of the past two Beige Books (August 2012, October 2012). The recent peak for mentions of China was six in the January 2012 Beige Book. We continue to expect a soft landing, not a hard landing, in China. Recent data in China has helped to corroborate that view.

- There were just seven mentions of Europe in the latest Beige Book, down from 12 in October 2012 and 20 in August 2012. Perhaps business and banking contacts on Main Street are not as exposed to Europe as some of the larger businesses and financial institutions on Wall Street that dominate media coverage. But it is also worth noting that the European debt crisis is now entering its fourth year, and Main Street may be getting used to it now.
Beige Book Background
The Beige Book compiles qualitative observations made by community bankers and business owners about economic (labor market, prices, wages, housing, nonresidential construction, tourism, manufacturing) and banking (loan demand, loan quality, lending conditions) conditions in each of the 12 Fed districts (Boston, New York, Philadelphia, Kansas City, etc.). This local color that makes up each Beige Book is compiled by one of the 12 regional Federal Reserve districts on a rotating basis — the report is much more “Main Street” than “Wall Street” focused. It provides an excellent window into economic activity around the nation using plain, everyday language. The report is prepared eight times a year ahead of each of the eight Federal Open Market Committee (FOMC) meetings. The next FOMC meeting is December 11 – 12, 2012.
The previous word clouds or text clouds, which are a visual format useful for quickly perceiving the most important words in a speech, text, report, or other transcript, are culled from the Fed’s Beige Books published last week (November 28, 2012) and the prior month (October 10, 2012). In general, the more often a word appears in a speech, text, report or other transcript, the larger that word appears in the word cloud. The word clouds show the top 50 words for each of the two Beige Books mentioned above. Similar words are grouped together and common words like “the,” “and,” “a,” and “is” are excluded, as are words that appear frequently in all Beige Books (Federal, district, loan, level, activity, sales, conditions, firms, etc.).

IMPORTANT DISCLOSURES
The opinions voiced in this material are for general information only and are not intended to provide specific advice or recommendations for any individual. To determine which investment(s) may be appropriate for you, consult your financial advisor prior to investing. All performance reference is historical and is no guarantee of future results. All indices are unmanaged and cannot be invested into directly.
* Gross Domestic Product (GDP) is the monetary value of all the finished goods and services produced within a country’s borders in a specific time period, though GDP is usually calculated on an annual basis. It includes all of private and public consumption, government outlays, investments and exports less imports that occur within a defined territory.
^ Federal Funds Rate is the interest rate at which depository institutions actively trade balances held at the Federal Reserve, called federal funds, with each other, usually overnight, on an uncollateralized basis.
† Private Sector – the total nonfarm payroll accounts for approximately 80% of the workers who produce the entire gross domestic product of the United States. The nonfarm payroll statistic is reported monthly, on the first Friday of the month, and is used to assist government policy makers and economists determine the current state of the economy and predict future levels of economic activity. It doesn’t include:
- general government employees
- private household employees
- employees of nonprofit organizations that provide assistance to individuals
- farm employees
The economic forecasts set forth in the presentation may not develop as predicted and there can be no guarantee that strategies promoted will be successful.
Stock investing involves risk including loss of principal.
International investing involves special risks, such as currency fluctuation and political instability, and may not be suitable for all investors.
Quantitative Easing is a government monetary policy occasionally used to increase the money supply by buying government securities or other securities from the market. Quantitative easing increases the money supply by flooding financial institutions with capital in an effort to promote increased lending and liquidity.
The Federal Open Market Committee action known as Operation Twist began in 1961. The intent was to flatten the yield curve in order to promote capital inflows and strengthen the dollar. The Fed utilized open market operations to shorten the maturity of public debt in the open market. The action has subsequently been reexamined in isolation and found to have been more effective than originally thought. As a result of this reappraisal, similar action has been suggested as an alternative to quantitative easing by central banks.
The Federal Open Market Committee (FOMC), a committee within the Federal Reserve System, is charged under the United States law with overseeing the nation’s open market operations (i.e., the Fed’s buying and selling of United States Treasure securities).
INDEX DESCRIPTIONS
Purchasing Managers Index (PMI) is an indicator of the economic health of the manufacturing sector. The PMI index is based on five major indicators: new orders, inventory levels, production, supplier deliveries and the employment environment.
This research material has been prepared by LPL Financial.
To the extent you are receiving investment advice from a separately registered independent investment advisor, please note that LPL Financial is
not an affiliate of and makes no representation with respect to such entity.
Not FDIC/NCUA Insured | Not Bank/Credit Union Guaranteed | May Lose Value | Not Guaranteed by any Government Agency | Not a Bank/Credit Union Deposit
