Last week (May 13 – 17), markets digested reports on gross domestic product (GDP) growth in the Eurozone during the first quarter of 2013 (please see “The Big Picture” for details about the Eurozone’s structure). Overall real GDP in the Eurozone contracted by 0.2% in the first quarter of 2013, following the 0.6% drop in the fourth quarter of 2012. The Eurozone’s economic contraction in the first quarter of 2013 was its sixth consecutive quarter of decline, dating back to the fourth quarter of 2011. Among the larger economies in Europe, only Germany (+0.1%) and Belgium (+0.1%) saw first quarter 2013 gains in their economies, while Austria’s GDP was unchanged between the fourth quarter of 2012 and the first quarter of 2013. France (-0.2%), Italy (-0.5%), Spain (-0.5%), and the Netherlands (-0.1%) all saw their economies contract in the first quarter of 2013.
Among the smaller economies on the Eurozone’s periphery, the news was just as bad, but the string of weak GDP readings extends back much further. Real GDP in Greece declined 0.6% in the first quarter of 2013, marking the 13th consecutive quarter of contraction. Greece’s economy has now contracted in 20 of the past 23 quarters since mid-2007. Over that time, the Greek economy has shrunk by 23%. Real GDP in Portugal contracted by 0.3% in the first quarter of 2013, marking the 10th consecutive quarterly decline. Ireland’s GDP fell just 0.1% in the first quarter of 2013, and it has managed just three quarters of growth since late 2010.
Looking ahead, financial markets seem to suggest that the double-dip recession in Europe — recession in 2008 and 2009, a modest, halting recovery in 2010 and early 2011, followed by another recession since mid-2011 — may be ending, and that the Eurozone economy may eke out small gains in the second half of 2013. The consensus of economists (as compiled by Bloomberg News) sees real GDP in the Eurozone contracting in both the second and third quarters of 2013, before a modest upswing begins in late 2013. Our view remains that the Eurozone is likely to be in a recession throughout 2013, despite the best efforts of the ECB and other policymakers.
The Fix? Some Keys to Help Strengthen Eurozone Economic Growth
As we have noted in prior publications, there are several keys to help strengthen economic growth in the Eurozone, including, but not limited to:
- Fixing Europe’s broken financial transmission mechanism;
- Broad-based labor market reforms;
- European-wide banking reform (including a pan-European deposit insurance scheme); and
- Financial sector reforms.
In our view, fixing Europe’s broken financial transmission mechanism should be at the top of European policymakers’ long list of “to dos.” The ECB, like almost every other major central bank around the globe, has lowered the rate at which banks can borrow from the ECB, expanded the ECB’s balance sheet to purchase securities in the open market (QE), and tried to encourage banks and other financial institutions to lend, and businesses and consumers in Europe to borrow. The results, however, have not (as yet) had the intended effect: to get badly needed credit (in the form of loans) into the European economy, and especially to the consumer and small businesses. In short, the mechanism that allows credit to flow from the ECB, to banks and financial institutions, and finally to businesses and consumers was badly damaged in the Great Recession and its aftermath.
Major European-based global corporations are benefitting from the ECB’s actions, and are taking advantage of low borrowing costs and relatively healthy — although not quite back to normal — European capital markets to issue debt and fund operations. While credit via traditional credit markets is flowing to large, global corporations in Europe, credit to SMEs, is severely restricted dampening economic activity.
How European Banks Can Help
As in the United States, most SMEs in Europe cannot borrow in the capital markets, so they rely on bank loans, and other types of bank-based funding for working capital and cash to expand existing business. This is especially true in countries at the periphery of Europe, like Greece, Portugal, Cyprus, and increasingly in core European nations like Spain and Italy. The problem is that the main conduits of the ECB’s low rates and QE policies are European banks, which:
- Are undercapitalized;
- Are reluctant to lend;
- Are losing deposits;
- Lack regulatory clarity; and
- Have impaired balance sheets.
Therefore, European banks are not lending, or more precisely, not lending enough.
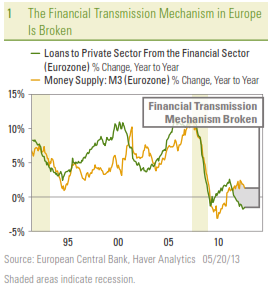
Figure 1 shows the breakdown in the financial transmission mechanism in Europe. Money supply growth (a decent proxy for the ECB’s actions to pump liquidity into the system) is running at around 2 – 3% year over year. Not robust growth, but enough to foster some lending by financial institutions. The other line on Figure 1 shows that despite the 2 – 3% growth in money supply in Europe, loans by financial institutions in Europe to private sector borrowers (SMEs and consumers) have turned negative. Therefore, credit to two key components of the Eurozone economy is contracting. The gap between these two lines is a good proxy for the broken financial transmission mechanism in Europe.
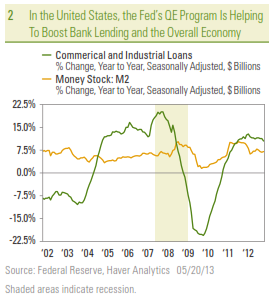
A quick look at Figure 2, which shows similar U.S. metrics (M2: money supply and bank lending), reveals that the financial transmission mechanism — while not quite back to normal — is functioning a lot better than Europe’s. M2 growth is running at around 7% year over year, while bank lending to businesses is running close to 10% year over year.
How the ECB and Policymakers Can Help
What would help to repair Europe’s broken transmission mechanism, and in turn, help to boost economic growth in the Eurozone? One way would be if the ECB was willing to take some credit risk on their balance sheet, and take an approach similar to the Bank of England’s (BOE) “credit easing” program. The BOE announced in late 2011 and mid-2012 that it would provide cheap loans and loan guarantees to the banking system to encourage the banks to lend more. Or, the ECB could decide to make loans directly to SMEs, essentially bypassing the broken European financial mechanism. Such a move by the ECB, of course, remains difficult — although not impossible — to achieve, given the fractured state of banking regulation in Europe and reluctance by key constituencies within the Eurozone to expand the ECB’s mandate. The bottom line is that until the ECB (or other policymakers) can agree on a plan to get more credit to capital-starved SMEs and consumers in Europe, we don’t think a meaningful recovery in Europe’s economy is in the cards.

________________________________________________________________________________________________________________________
IMPORTANT DISCLOSURES
The opinions voiced in this material are for general information only and are not intended to provide specific advice or recommendations for any individual. To determine which investment(s) may be appropriate for you, consult your financial advisor prior to investing. All performance reference is historical and is no guarantee of future results. All indices are unmanaged and cannot be invested into directly.
Gross domestic product (GDP) is the monetary value of all the finished goods and services produced within a country’s borders in a specific time period, though GDP is usually calculated on an annual basis. It includes all of private and public consumption, government outlays, investments and exports less imports that occur within a defined territory.
The economic forecasts set forth in the presentation may not develop as predicted and there can be no guarantee that strategies promoted will be successful.
Stock investing involves risk including loss of principal.
Quantitative easing is a government monetary policy occasionally used to increase the money supply by buying government securities or other securities from the market. Quantitative easing increases the money supply by flooding financial institutions with capital in an effort to promote increased lending and liquidity.
________________________________________________________________________________________________________________________
INDEX DESCRIPTIONS
Purchasing Managers’ Index (PMI) is an indicator of the economic health of the manufacturing sector. The PMI index is based on five major indicators: new orders, inventory levels, production, supplier deliveries and the employment environment.
________________________________________________________________________________________________________________________
This research material has been prepared by LPL Financial.
To the extent you are receiving investment advice from a separately registered independent investment advisor, please note that LPL Financial is
not an affiliate of and makes no representation with respect to such entity.
Not FDIC/NCUA Insured | Not Bank/Credit Union Guaranteed | May Lose Value | Not Guaranteed by any Government Agency | Not a Bank/Credit Union Deposit


Health Care Checkup
October 1, 2013
What We Spend on Health Care
This week, health care is likely to be in the news as a key component of the 2010 Affordable Care Act (ACA). Enrollment for individuals seeking insurance coverage takes effect on October 1, as members of Congress continue to debate the merits (and funding) of the law as part of the discussion around providing funding for the federal government. We’ll leave the pros and cons of the ACA to the politicians and pundits and focus instead on the size and scope of the health care sector in the U.S. economy. In future Weekly Economic Commentaries, we’ll explore the impact of health care on the labor market, various segments of the economy, the federal budget, inflation, and the impact of demographics on health care spending. On balance, how we (as individuals and as an economy) consume, pay for, and manage the cost of health care will play a crucial role not only in the economy, but in the federal budget in the years and decades to come.
How We’re Covered
Most, though not all, of the spending patterns discussed below are driven by what type of health insurance, if any, individuals have. Using data compiled by the non-partisan Congressional Budget Office (CBO), which assigns people to their primary source of insurance (many people have multiple sources of insurance, especially those eligible for Medicare who also purchase additional insurance), we find that 156 million people (or 57% of the non-elderly population) have employment-based health insurance. By 2023, the CBO projects that this figure will increase to 162 million but will remain at 57% of the non-elderly population. At 57 million, or 21% of the non-elderly population, the uninsured made up the second-largest portion of the population in 2012. The CBO projects that under current law, the number of uninsured will drop to 31 million or 11% of the non-elderly population by 2023. More people are likely to move onto Medicaid and to the government-run health insurance exchanges as prescribed by the ACA while those purchasing non-group insurance will remain roughly steady at 8% of the non-elderly population. This potential shift in how Americans purchase health insurance has major implications for the overall economy and the outlook for the budget, which we’ll discuss in depth in future editions of the Weekly Economic Commentary.
How We Spend Our Health Care Dollars
Economy-wide (federal, state, and local governments, corporations, and individuals), Americans spent $2.7 trillion (or roughly 18% of gross domestic product [GDP]) on health care products, services, and investment in 2011, the latest data available.
To put that in perspective, only three countries, China, Japan, and Germany, have economies larger than $2.7 trillion. Ten years ago, the figure was closer to 15% of GDP, and 30 years ago (1982) health care represented less than 10% of GDP. The rise in the percentage of the economy accounted for by health care is because spending on health care has risen much faster than GDP. Over the last 10 years, for example, health care spending has increased at a 5.5% annualized rate while overall GDP has increased at only a 4.0% pace. Although the aging population has played a role in this increase, and will continue to for many decades to come, health care spending per capita has increased 5% per year over the past 10 years to nearly $9,000, suggesting that even without the demographic shift, we are spending more on health care than ever before.
Of the $2.7 trillion spent economy-wide on health care in 2011, about one-third is on hospital services, another 25% is on professional services (doctors, dentists, clinics), and 15% is on medical products, including pharmaceuticals, medical equipment, and medical supplies. $308 billion is spent by individuals out of pocket on health care, more than is spent by individuals on new passenger cars and light trucks (approximately $240 billion in 2012), furniture and appliances (~$275 billion), or clothing (~$290 billion). Health insurance pays for another $2 trillion in health care expenses. Private insurance covers $900 billion of that $2 trillion, Medicare insurance for the elderly covers $550 billion, and Medicaid insurance for the poor covers $400 billion. The surprise here is that out-of-pocket expenses (~$300 billion) as a percent of total health care expenditures ($2.7 trillion) are just 11%, and have been moving lower for more than five decades.
As noted above, we’ll discuss the impact of health care spending on the federal budget in a future edition of the Weekly Economic Commentary, but it’s important to note that the portion of health care spending economywide “sponsored” by governments has risen steadily over the past 25 years and is projected to continue to increase over the next 10 years and beyond, as the population ages and more people move into Medicare.
Allocation of Health Care Dollars Shifting Toward Government
In 1987, 68% of health care spending was initiated by the private sector (private businesses, households, and health-related philanthropic organizations), with one-third coming from businesses and roughly twothirds from households. Within the private sector, the ratio between businesses (one-third) and household spending (two-thirds) has remained relatively steady over the past 25 years. In 2012, just 55% of health care spending was initiated by the private sector, down from 68% in 1987, while government (federal, state, and local) accounted for 45%, up from 32% in 1987. This trend is expected to rise over the next 10 years.
Business spending in this context includes:
Household spending on health care includes:
Shifts in the mix of spending by businesses and consumers on various aspects of health care will continue to impact the economy for many years to come, and hopefully inform policy choices about who pays and how much is paid for health care in the coming decades.
Because the U.S. government is paying an ever-increasing share of health care costs, and more businesses and individuals are paying less out of pocket for health care, the actual cost and quality of health care is not as transparent as it should be. For example, we are likely to know far more about the cost and quality of the house we’re going to buy, the car we’re going to lease, and the vacation we’re going to take than we often do about our health care purchases. The overall cost of health care, combined with the lack of transparency throughout the system, will likely remain ongoing concerns for health care policymakers in the coming years and decades.
_________________________________________________________________________________________________________________________________________________________________________________
IMPORTANT DISCLOSURES
The opinions voiced in this material are for general information only and are not intended to provide specific advice or recommendations for any individual. To determine which investment(s) may be appropriate for you, consult your financial advisor prior to investing. All performance reference is historical and is no guarantee of future results. All indices are unmanaged and cannot be invested into directly.
The economic forecasts set forth in the presentation may not develop as predicted and there can be no guarantee that strategies promoted will be successful.
Stock investing involves risk including loss of principal.
Gross domestic product (GDP) is the monetary value of all the finished goods and services produced within a country’s borders in a specific time period, though GDP is usually calculated on an annual basis. It includes all of private and public consumption, government outlays, investments and exports less imports that occur within a defined territory.
The Congressional Budget Office is a non-partisan arm of Congress, established in 1974, to provide Congress with non-partisan scoring of budget proposals.
This research material has been prepared by LPL Financial.
To the extent you are receiving investment advice from a separately registered independent investment advisor, please note that LPL Financial is not an affiliate of and makes no representation with respect to such entity.
Not FDIC/NCUA Insured | Not Bank/Credit Union Guaranteed | May Lose Value | Not Guaranteed by any Government Agency | Not a Bank/Credit Union Deposit
Member FINRA/SIPC
Posted in Affordable Care Act, China, Congressional Budget Office (CBO), GDP - Gross Domestic Product, Germany, Health Care, Healthcare cost, Hospital Cost, Insurance, Japan, Medicaid, Medicare, Weekly Economic Commentary | Tagged: Affordable Care Act, CBO, China, Congress, GDP, Germany, healthcare, Healthcare costs, Hospital costs, insurance, Medical, Weekly Economic Commentary | Leave a Comment »