Leading Indicators Continue to Point to Slow Economic Growth, but no Recession
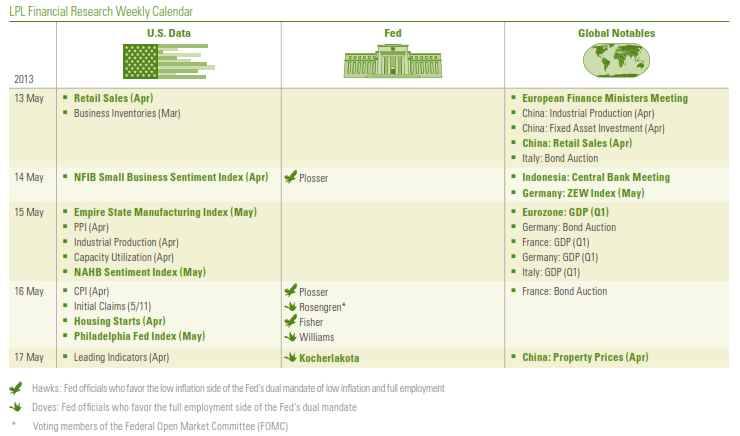
The April Index of Leading Economic Indicators (LEI), due out on Friday, May 17, 2013, caps off a busy week for economic reports in the United States. This week includes reports on:
- The consumer: Retail sales for April 2013 and the University of MichiganIndex of Consumer Sentiment for early May 2013;
- Housing: Housing starts and building permits for April 2013 and the National Association of Homebuilders sentiment index for May 2013;
- Manufacturing: Empire State Manufacturing Index for May, the Philadelphia Fed Manufacturing Index for May 2013, industrial production and capacity utilization for April 2013; and
- Inflation: Consumer Price Index (CPI) and Producer Price Index (PPI) for April 2013.
On balance, these reports are likely to continue to show that the U.S. economy is growing at around 2.0% in the second quarter of 2013, that inflation remains muted, and that the odds of a recession in the next year to 18 months remains low. Policymakers at the Federal Reserve (Fed) will digest all of this data, and likely conclude that its quantitative easing (QE) program — the purchase of $85 billion per month of Treasury securities — should continue over the remainder of 2013.

LEI Updates
If you have not seen the LEI lately, there have been several changes made to its components, although as before, virtually all of the components of the LEI are known before the data are actually released. So in theory, the LEI itself should not be a surprise to market participants, the media, or pundits. Of course, that will not prevent anyone from ascribing movements in financial markets on Friday, May 17 to the LEI data, but we are always quick to point out that the S&P 500 itself is a component in the LEI.
In December 2011, the Conference Board, the private “think tank” that compiles and releases the data each month, made four changes to the LEI:
- The Conference Board’s proprietary “Leading Credit Index” (LCI), an aggregate of several well-known financial market and credit market metrics like swap spreads, investor sentiment, margin account, etc., replaced the inflation adjusted M2 money supply.
- The Institute for Supply Management’s (ISM) New Orders Index replaced the ISM’s Supplier Deliveries Index.
- The U.S. Department of Census’ new orders for non-defense capital goods excluding aircraft replaced new orders for non-defense capital goods.
- A combination of consumer expectations and business and economic conditions replace the University of Michigan’s Consumer Expectations Index.
LEI Places Very Low Odds of Recession in Next 12 Months
According to the consensus estimates compiled by Bloomberg News, the LEI is expected to post a 0.2% month-over-month gain in April 2013. The expected 0.2% month-over-month gain would put the year-over-year gain in the LEI at 2.1%. The LEI is designed to predict the future path of the economy, with a lead time of between six and 12 months. Since 1960 — 640 months or 53 years and four months — the year-over-year increase in the LEI has been at least 2.1% in 397 months. Not surprisingly, the U.S. economy was not in recession in any of those 397 months. Thus, it is highly unlikely that the economy was in recession in April 2013, despite the impact of the sequester, the fiscal cliff (spending cuts, payroll tax increases, income tax rate increases, etc.), the recession in Europe, or the slowdown in China.
But the LEI is designed to tell market participants what is likely to happen to the U.S. economy, not what has already happened. Three months after each of the 397 months that the LEI was up 2.1% or more, the economy was in recession in just two of the 397 months — both in 1973. Six months after the LEI was up by 2.1% or more on a year-over-year basis, the U.S. economy has been in recession in just six of the 397 months or 2% of the time. Looking out 12 months after the LEI was up 2.1% or more, the economy was in recession in just 27 of the 397 months, or 7% of the time. Based on this relationship, the odds of a recession within the next 18 months and two years increase to between 10% and 15%.
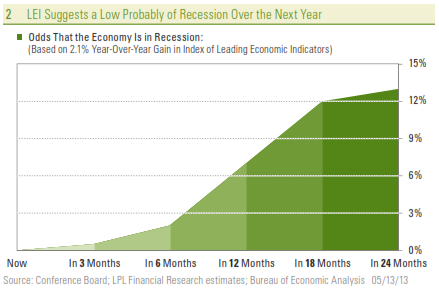
On balance, the LEI says the risk of recession in the next 12 months is negligible (7%), but not zero. We would agree. But, the still-fragile state of the economy, and the uncertainty surrounding domestic fiscal policy, the recession in Europe, and the ongoing slowdown in China are telling us that the risk of recession is much higher than 7%. Our view remains that — aided by the Fed’s QE program, the early stages of a housing recovery, and a nascent manufacturing recovery — the U.S. economy is likely to grow at around 2.0% this year. The full impact of the sequester, the looming debate over the federal debt ceiling, weak exports, and ongoing contraction in both federal and state and local government spending are all acting to restrain growth, and these factors are likely to be in place for most of this year. A dramatic deterioration of the fiscal and financial situation in Europe, a fiscal or monetary policy mistake here in the United States or abroad, or an exogenous event (a major terror attack, natural disaster, etc.), among other events, may cause us to change our view.
______________________________________________________________________________________________________________________________________________
IMPORTANT DISCLOSURES
The opinions voiced in this material are for general information only and are not intended to provide specific advice or recommendations for any individual. To determine which investment(s) may be appropriate for you, consult your financial advisor prior to investing. All performance reference is historical and is no guarantee of future results. All indices are unmanaged and cannot be invested into directly.
* Over the last three quarters (third quarter of 2012, fourth quarter of 2012, and first quarter of 2013) , real GDP growth has averaged 2.0%.
Gross domestic product (GDP) is the monetary value of all the finished goods and services produced within a country’s borders in a specific time period, though GDP is usually calculated on an annual basis. It includes all of private and public consumption, government outlays, investments and exports less imports that occur within a defined territory.
The economic forecasts set forth in the presentation may not develop as predicted and there can be no guarantee that strategies promoted will be successful.
Stock investing involves risk including loss of principal.
Quantitative easing is a government monetary policy occasionally used to increase the money supply by buying government securities or other securities from the market. Quantitative easing increases the money supply by flooding financial institutions with capital in an effort to promote increased lending and liquidity.
The Federal Open Market Committee (FOMC) , a committee within the Federal Reserve System, is charged under the United States law with overseeing the nation’s open market operations (i.e., the Fed’s buying and selling of U.S. Treasury securities).
The Congressional Budget Office is a non-partisan arm of Congress, established in 1974, to provide Congress with non-partisan scoring of budget proposals.
______________________________________________________________________________________________________________________________________________
INDEX DESCRIPTIONS
The Consumer Price Index (CPI) is a measure of the average change over time in the prices paid by urban consumers for a market basket of consumer goods and services.
The Empire State Manufacturing Index is a seasonally-adjusted index that tracks the results of the Empire State Manufacturing Survey. The survey is distributed to roughly 175 manufacturing executives and asks questions intended to gauge both the current sentiment of the executives and their six-month outlook on the sector.
The Institute for Supply Management (ISM) index is based on surveys of more than 300 manufacturing firms by the Institute of Supply Management. The ISM Manufacturing Index monitors employment, production inventories, new orders, and supplier deliveries. A composite diffusion index is created that monitors conditions in national manufacturing based on the data from these surveys.
The index of leading economic indicators (LEI) is an economic variable, such as private-sector wages, that tends to show the direction of future economic activity.
The Leading Credit Index constitutes financial market indicators including bond market yield curve data, interest rate swaps, and Fed bank lending survey data.
The NAHB/Wells Fargo Housing Market Index gauges builder perceptions of current single-family home sales and sales expectations for the next six months as “good,” “fair” or “poor.” The survey also asks builders to rate traffic of prospective buyers as “high to very high,” “average,” or “low to very low.” Scores from each component are then used to calculate a seasonally adjusted index where any number over 50 indicates that more builders view conditions as good than poor.
The Philadelphia Fed Manufacturing Index is a survey produced by the Federal Reserve Bank of Philadelphia, which questions manufacturers on general business conditions. The index covers the Philadelphia, New Jersey, and Delaware region. Higher survey figures suggest higher production, which contribute to economic growth. Results are calculated as the difference between percentage scores with zero acting as the centerline point. As such, values greater than zero indicate growth, while values less than zero indicate contraction.
The Producer Price Index (PPI) program measures the average change over time in the selling prices received by domestic producers for their output. The prices included in the PPI are from the first commercial transaction for many products and some services.
Purchasing Managers’ Index (PMI) is an indicator of the economic health of the manufacturing sector. The PMI index is based on five major indicators: new orders, inventory levels, production, supplier deliveries, and the employment environment.
The University of Michigan Consumer Sentiment Index (MCSI) is a survey of consumer confidence conducted by the University of Michigan. The Michigan Consumer Sentiment Index (MCSI) uses telephone surveys to gather information on consumer expectations regarding the overall economy.
______________________________________________________________________________________________________________________________________________
This research material has been prepared by LPL Financial.
To the extent you are receiving investment advice from a separately registered independent investment advisor, please note that LPL Financial is
not an affiliate of and makes no representation with respect to such entity.
Not FDIC/NCUA Insured | Not Bank/Credit Union Guaranteed | May Lose Value | Not Guaranteed by any Government Agency | Not a Bank/Credit Union Deposit