When Will the Selling Stop?
The past week brought about the summer solstice, the official start of summer, but for bond investors it feels more like the dead of winter. Bond weakness continued in response to a Federal Reserve (Fed) that remains fixated on slowing, or tapering, bond purchases following last week’s policy meeting.
A review of several bond metrics may help answer the question at the forefront of bond investors’ minds: “when will the selling stop?” Although we believe bond market weakness is overdone, we have to respect market action and evaluate how high yields may rise. A look at economic growth, Fed rate hike expectations, and the slope of the yield curve may help investors determine how high bond yields may rise in a more adverse scenario. The measures discussed below are simplistic guides but can still help triangulate how high yields may rise.
Economic growth and Treasury yields – The pace of economic growth has historically been one of the primary drivers of Treasury yields. The yield on the 10-year Treasury note has been roughly similar to annualized economic growth, as measured by nominal gross domestic product (GDP), over long periods of time [Figure 1]. The relationship has changed over the years as market confidence in a persistent low inflation-environment has grown, which has caused the 10-year Treasury to frequently yield less than annualized GDP growth over the past 10 years, but the two remain correlated.
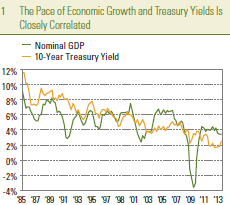
Over the past 10 years, annualized nominal GDP growth has averaged 0.43% more than the 10-year Treasury yield. Assuming this relationship holds, subtracting 0.43% from annualized nominal GDP growth of 3.40% produces a 10-year Treasury yield of 2.97%. However, the Fed has been applying extraordinary stimulus for just under five years. Over the past five years, the 10-year Treasury yield has averaged 0.57% less than annualized nominal GDP growth, which implies a 2.83% 10-year Treasury yield, based upon the metric above. Since the Fed will remain active with bond purchases and remains committed to refrain from raising interest rates, this latter reading may be more appropriate. However, if the bond market is transitioning to a more “normal” state, free of Fed influence, then the2.97% 10-year Treasury yield provides a guide according to the GDP growth-Treasury yield relationship.
Rate hike expectations – The bond market continues to confuse “taper” with “rate hike.” Therefore, assessing market expectations for a first interest rate hike can may help determine how much more weakness is in store. According to fed fund futures, one of the better gauges of assessing market expectations of Fed interest rate changes, the first 0.25% interest rate hike is fully priced in by February 2015. This is a dramatic increase from just a few weeks ago, when fed fund futures indicated a late 2015/early 2016 as the mostly likely timing of a first rate hike.
Should the market move to fully price in a first rate hike by the fourth quarter of 2014, we believe bond selling pressure may subside. Last week, Fed Chairman Ben Bernanke outlined a broad plan to remove stimulus that begins with tapering bond purchases “later this year,” then ending bond purchases completely by mid-2014 (assuming the unemployment rate drops to 7.0% by then), followed by raising interest rate hikes by mid-2015 (assuming a further decline in the unemployment rate to 6.5%). By moving to price in a late-2014 first rate hike, bond market pricing would be more aggressive compared to the Fed’s game plan, while also providing a buffer should the Fed not stay true to its word or the labor market improve more quickly than currently anticipated. Furthermore, a fourth quarter 2014 rate hike would be a relatively short turnaround from the time of ending bond purchases. The Fed has stated in the past that a substantial period of time would elapse between the time bond purchases end and the time when interest rates will be increased.
To determine whether a fourth quarter 2014 rate hike is fully priced in, we can observe the fed fund futures contract expiring on December 2014. As of June 24, 2013, the December 2014 contract was priced to reflect a 0.40% fed funds rate, meaning that a 0.25% rate increase to 0.50% was not fully priced in. From Wednesday through Friday of last week (June 19, 2013 through June 21, 2013) the 10-year Treasury yield rose by 0.34% to 2.53% compared to a 0.12% rise in the implied yield of the December 2014 contract, a ratio of roughly three-to-one. Therefore, if the implied yield of the December 2014 fed fund futures increases by another 0.1%, to reflect a 0.5% fed funds rate, it would translate to an approximate 0.3% increase to the 10-year Treasury yield, taking it to 2.83%.
The yield curve – Over the past five years, the yield differential between the 2-year and 10-year Treasuries has peaked twice at 2.9% [Figure 2]. A greater differential is indicative of a “steep” yield curve, and a low differential represents a “flat” yield curve. At a current yield differential of 2.15%, the 10-year Treasury yield would have to increase by an additional 0.65% to reach the prior yield curve peak of 2.9%, as measured between 2- and 10-year Treasury yields. A 0.65% increase in the 10-year Treasury yield would imply a further increase to a 3.19% 10-year Treasury yield (approximately) based upon Monday’s close of 2.54%. Should the 2-year Treasury yield rise as well, then the 10-year Treasury yield may rise further. Nonetheless, the yield curve relationship indicates a 10-year Treasury yield in the low 3% range.
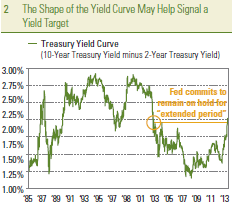
However, prior peaks in the yield curve occurred before the Fed’s commitment to refrain from raising interest rates, and therefore, a return to the prior peak level is unlikely. The Fed’s commitment to refrain from raising interest rates, in conjunction with Fed bond purchases, helped “flatten” the yield curve as investors extended maturity into higher-yielding investments, putting downward pressure on longer-term bond yields. As the Fed removes stimulus it is natural that the yield curve would steepen, but since the Fed’s commitment to refrain from raising interest rate remains intact, a return to prior peaks of yield curve slope remain unlikely. Furthermore, early 2010 and early 2011, the last two times the slope of the yield curve was at this maximum steepness, turned out to be very good buying opportunities for bond investors. High-quality bonds returned 4.7% and 7.4%, respectively, over the remainder of 2010 and 2011, as measured by the Barclays Aggregate Bond Index, from March of each year through the remainder of the calendar year. We doubt the bond market will provide such an easy opportunity for investors, and therefore, the rise in yields is likely to fall short of the target implied by the slope of the yield curve.
Conclusion: Cautious Until Signs of Stability Emerge
These three approaches may provide a guide as to a realistic high end of the range for bond yields. Collectively, they suggest the 10-year Treasury yield could find support between 2.75% and 3.00%, should the rise in bond yields continue.
Our belief is that Treasury yields may begin to stabilize near current yield levels. Bond price declines have been exacerbated by very illiquid trading conditions that, in some cases, pushed bond prices lower than justified by intrinsic value. Two of the more illiquid segments of the bond market, emerging market debt and municipal bonds, have therefore borne the brunt of recent weakness, but no sector has been immune. As a result, more evidence is needed to confirm yields have stabilized. Ultimately, we believe the rise in Treasury yields will likely stop short of the 2.75-3.00% range, since economic growth remains sluggish and inflation remains very low.
Some opportunities are emerging in fixed income markets due to the highest yields in over two years, but illiquid trading conditions, the approach of quarter-end this week which may foster risk aversion, and new issuance in Treasury and municipal bond markets may weigh on the bond market this week. We take a cautious view on the fixed income markets until additional signs of stability emerge.
____________________________________________________________________________________________________________________________________
IMPORTANT DISCLOSURES
The opinions voiced in this material are for general information only and are not intended to provide specific advice or recommendations for any individual. To determine which investment(s) may be appropriate for you, consult your financial advisor prior to investing. All performance referenced is historical and is no guarantee of future results. All indexes are unmanaged and cannot be invested into directly.
The economic forecasts set forth in the presentation may not develop as predicted and there can be no guarantee that strategies promoted will be successful.
Yield is the income return on an investment. This refers to the interest or dividends received from a security and is usually expressed annually as a percentage based on the investment’s cost, its current market value or its face value.
Gross domestic product (GDP) is the monetary value of all the finished goods and services produced within a country’s borders in a specific time period, though GDP is usually calculated on an annual basis. It includes all of private and public consumption, government outlays, investments and exports less imports that occur within a defined territory.
Bonds are subject to market and interest rate risk if sold prior to maturity. Bond values and yields will decline as interest rates rise, and bonds are subject to availability and change in price.
Bonds given an investment grade rating indicate a relatively low risk of default.
Municipal bonds are subject to availability, price, and to market and interest rate risk if sold prior to maturity. Bond values will decline as interest rate rise. Interest income may be subject to the alternative minimum tax. Federally tax-free but other state and local taxes may apply.
Government bonds and Treasury bills are guaranteed by the U.S. government as to the timely payment of principal and interest and, if held to maturity, offer a fixed rate of return and fixed principal value. However, the value of fund shares is not guaranteed and will fluctuate.
Treasuries are marketable, fixed-interest U.S. government debt securities. Treasury bonds make interest payments semi-annually, and the income that holders receive is only taxed at the federal level.
Emerging market debt portfolios invest primarily in sovereigns, agencies, local issues, and corporate debt of emerging markets in the following regions: Americas, Europe, Middle East, Africa, and Asia.
Futures and forward trading is speculative, includes a high degree of risk, and may not be suitable for all investors.
This information is not intended to be a substitute for specific individualized tax, legal or investment planning advice. We suggest that you discuss your specific tax issues with a qualified tax advisor.
______________________________________________________________________________________________________________________________________________________________________________________________________________________________
INDEX DESCRIPTIONS
The Barclays Aggregate Bond Index represents securities that are SEC-registered, taxable, and dollar denominated. The index covers the U.S. investment-grade fixed rate bond market, with index components for government and corporate securities, mortgage pass-through securities, and asset-backed securities.
_____________________________________________________________________________________________________________________________________
This research material has been prepared by LPL Financial.
To the extent you are receiving investment advice from a separately registered independent investment advisor, please note that LPL Financial is not an affiliate of and makes no representation with respect to such entity
Not FDIC/NCUA Insured | Not Bank/Credit Union Guaranteed | May Lose Value | Not Guaranteed by any Government Agency | Not a Bank/Credit Union Deposit
Member FINRA/SIPC
