Less Defense?
On Sunday, February 3, 2013, the Baltimore Ravens defeated the San Francisco Forty Niners 34 – 31 to win Super Bowl XLVII. The talk of the game was certainly not about defense, but defense spending, and its impact on the economy, was a key topic of conversation in financial markets in the week leading up to the Super Bowl.
Economic Data Halftime Show Highlights
The financial markets in the week preceding the Super Bowl (January 28 – February 1) featured four key economic events;
- The Institute for Supply Management’s (ISM) Report on Business for January 2013;
- The January 2013 employment report;
- The fourth quarter 2012 gross domestic product (GDP) report; and
- The Federal Reserve’s Federal Open Market (FOMC) meeting.
Any one of these events happening in one week would draw a great deal of attention from the media and financial market participants, but all of these top-ranked data points playing out in one week is rare — almost as rare as a power outage at the Super Bowl!
On balance, last week’s economic reports, along with the statement accompanying the FOMC meeting, revealed an economic playbook that included economic growth fast enough to create jobs and move the widely watched ISM index, at 53.1, to a nine-month high, but not fast enough to cause the Federal Reserve (Fed) to think about ending its program of bond purchases (quantitative easing, or QE3) anytime soon.
Last week’s economic data halftime show that drew the most attention was Thursday (January 31, 2013) morning’s release of the surprising -0.1% drop in GDP between the third and fourth quarters of 2012. Economists had been expecting a number around 1%. Within that surprisingly weak report was a stunning 22% drop in defense spending, the largest quarter-over-quarter drop in defense spending since 1972, as the Vietnam War was winding down. This drop alone shaved 1.3 percentage points from GDP. Although there is no precise measurement, the effect of Superstorm Sandy likely shaved another 0.5 percentage points off of GDP. Add in the 1.3 percentage point drag from fewer inventories being built up in the fourth quarter than in the third, and it is likely that real GDP growth would have been closer to 3.0% than to zero.

The drawdown in inventories may have been related to uncertainties among businesses ahead of the fiscal cliff and the impact of Superstorm Sandy. These are likely to be at least partially reversed in the first quarter of 2013 and add to GDP growth. However, the outlook for defense spending is a bit less certain due, in part, to yet another piece of the fiscal cliff: spending cuts known as sequestration.
Defense Spending Running at About 4 – 5% of GDP
 At least a portion of the 22% drop in defense spending — from an annualized pace of $698.1 billion in the third quarter of 2012 to an annualized pace of $655.7 billion in the fourth quarter of 2012 — was likely due to the fiscal cliff, as some defense contractors may have curtailed some non-mission critical spending ahead of the pending cuts tied to sequestration. Indeed, the research and development-related portion of defense spending fell at a whopping 58% annualized rate in the fourth quarter, while outlays for troop pay dropped by just 3.0%. Thus, the ongoing drawdown in troop levels in Iraq and Afghanistan also most likely played only a part in the big drop in defense outlays in the fourth quarter. Government spending on big ticket military items like aircraft, missiles, ships, vehicles, and electronics fell by only 2.2% between the third and fourth quarters of 2012.
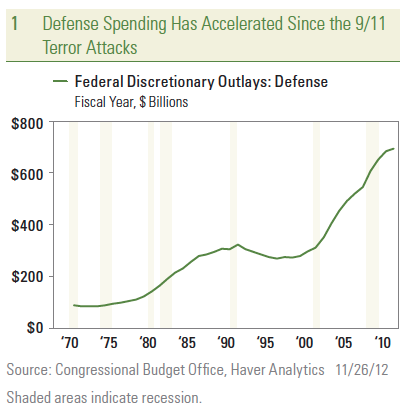
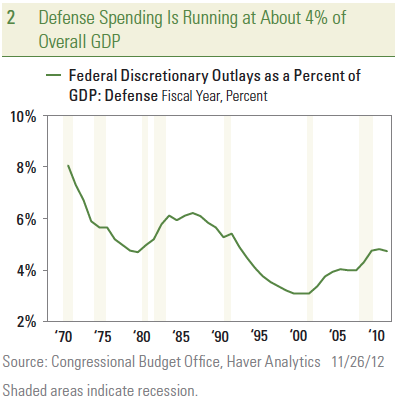 Between $25 billion and $30 billion of automatic spending cuts will hit defense spending on February 28, 2013, representing roughly a 10% cut to defense outlays, unless Congress acts to modify, suspend, or delay the cuts. Moving past the sequestration, the defense sector remains one of the largest single segments of the federal budget. In fiscal year 2012, defense spending was close to $640 billion and is one of the largest categories of discretionary spending. In recent years, defense spending has accounted for between 50% and 55% of discretionary spending, 4.5% of gross domestic product (GDP), and about 20% of overall federal government outlays. During the Reagan administration at the end of the Cold War, defense spending accounted for 65% of total discretionary spending, 6% of GDP, and nearly 30% of all federal government outlays. After the fall of
the Berlin Wall in  1989, defense spending as a percent of discretionary spending fell swiftly — bottoming out in 2001 at under 48%, 3% of GDP, and 15% of total federal outlays — just as the war on terror and the wars in Afghanistan and Iraq began.
Defense spending is often discussed as an area to cut in order to reduce the long-term deficit because it is such a large part of federal outlays. While there is likely some kernel of truth in oft-cited media reports of $600 hammers and $300 toilet seats being purchased by the Pentagon, eliminating all “waste, fraud, and abuse” from the defense budget, while a worthwhile endeavor, would only make a small dent in overall spending.

Potential Slowing in Pace of Defense Spending Ahead
Looking ahead from a budget perspective, perhaps the best that can be hoped for is a slowing in the pace of defense spending, not outright declines similar to those seen in the late 1970s and 1990s Some of the proposals put forth by the deficit commissions and the Congressional Budget Office (CBO) regarding defense spending include:
- Freezing defense spending at current levels of GDP;
- Cutting the rate of increase in defense spending; and
- Finding savings within the Department of Defense’s procurement system.
Please see our Weekly Economic Commentary: Budget Defense from November 26, 2012 for more details.
From a GDP perspective, the best case for defense spending in 2013 is that it has a modest positive impact on GDP. More likely, defense spending, after a rebound in the first quarter of 2013 on the heels of the big drop in the fourth quarter of 2012, is likely to be flat. The worst case — again from a GDP perspective — and least likely, would be if Congress can agree to substantial cuts to defense spending as part of an overall budget deal. In this scenario, defense would likely be a modest 0.1 to 0.2% drag on overall GDP growth in 2013 and beyond.
_______________________________________________________________________________
IMPORTANT DISCLOSURES
The opinions voiced in this material are for general information only and are not intended to provide specific advice or recommendations for any individual. To determine which investment(s) may be appropriate for you, consult your financial advisor prior to investing. All performance reference is historical and is no guarantee of future results. All indices are unmanaged and cannot be invested into directly.
Gross Domestic Product (GDP) is the monetary value of all the finished goods and services produced within a country’s borders in a specific time period, though GDP is usually calculated on an annual basis. It includes all of private and public consumption, government outlays, investments and exports less imports that occur within a defined territory.
The economic forecasts set forth in the presentation may not develop as predicted and there can be no guarantee that strategies promoted will be successful.
Stock investing involves risk including loss of principal.
International investing involves special risks, such as currency fluctuation and political instability, and may not be suitable for all investors.
The Federal Open Market Committee action known as Operation Twist began in 1961. The intent was to flatten the yield curve in order to promote capital inflows and strengthen the dollar. The Fed utilized open market operations to shorten the maturity of public debt in the open market. The action has subsequently been reexamined in isolation and found to have been more effective than originally thought. As a result of this reappraisal, similar action has been suggested as an alternative to quantitative easing by central banks.
The Federal Open Market Committee (FOMC), a committee within the Federal Reserve System, is charged under the United States law with overseeing the nation’s open market operations (i.e., the Fed’s buying and selling of United States Treasure securities).
International Monetary Fund (IMF) is an international organization created for the purpose of promoting global monetary and exchange stability, facilitating the expansion and balanced growth of international trade, and assisting in the establishment of a multilateral system of payments for current transactions.
Quantitative Easing is a government monetary policy occasionally used to increase the money supply by buying government securities or other securities from the market. Quantitative easing increases the money supply by flooding financial institutions with capital in an effort to promote increased lending and liquidity.
INDEX DESCRIPTIONS
The Consumer Price Index (CPI) is a measure of the average change over time in the prices paid by urban consumers for a market basket of consumer goods and services.
The Institute for Supply Management (ISM) index is based on surveys of more than 300 manufacturing firms by the Institute of Supply Management. The ISM Manufacturing Index monitors employment, production inventories, new orders, and supplier deliveries. A composite diffusion index is created that monitors conditions in national manufacturing based on the data from these surveys.
Purchasing Managers Index (PMI) is an indicator of the economic health of the manufacturing sector. The PMI index is based on five major indicators: new orders, inventory levels, production, supplier deliveries and the employment environment.
_______________________________________________________________________________
This research material has been prepared by LPL Financial.
To the extent you are receiving investment advice from a separately registered independent investment advisor, please note that LPL Financial is not an affiliate of and makes no representation with respect to such entity.
Not FDIC/NCUA Insured | Not Bank/Credit Union Guaranteed | May Lose Value | Not Guaranteed by any Government Agency | Not a Bank/Credit Union Deposit
_______________________________________________________________________________
Stay Connected with Us!


