What Demographics Tell Us About Health Care
October 9, 2013

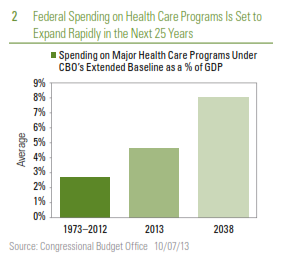
According to the U.S. Census Bureau, in 2013, 14% of the U.S. population is over 65, and by 2028, 20% of the population will be 65 or older. By 2060, 22% of the 420 million Americans will be 65 or older. Put a different way, between now and 2060, as the last of the baby boomers turn 100, the 65-and-under population will grow at just 0.4% per year, while the 65-and over population will grow nearly four times as fast, or 1.6% per year. These trends are well known to financial market participants and policymakers, since most of the changes in the future population can be explained by what birthrates were 10, 20, 30, 40, etc. years ago. Net immigration, projections of future birth rates, and, of course, life expectancy also play a role in these demographic forecasts. In this week’s Commentary, we discuss how these demographic changes (and other factors) will impact U.S. spending on health care in the decades ahead.

In the September 30, 2013 Weekly Economic Commentary, Health Care Check-Up: What We Spend on Health Care, we examined what type of insurance coverage Americans have today, how that may change over the next 10 years as a result of the Affordable Care Act (ACA), what we spend as an economy on health care, and who does most of the spending (individuals, businesses, government, etc.). Missing from the discussion was insurance coverage for the elderly portion of the population that qualifies for Medicare. The rise in the portion of the population over 65 years of age — from 14% today to 20% by 2028 — will be a big driver of health care spending, federal government spending, and the federal budget deficit over the next several decades, but it may not be the most important driver. Under current law, the non-partisan Congressional Budget Office (CBO) projects that the overall budget deficit as a percentage of gross domestic product (GDP) is expected to fall from around 4.5% of GDP in 2013 to around 2.0% to 2.5% of GDP by 2015 through 2017. In the following years, an increase in spending on Medicare, Medicaid, and Social Security, as well as other “mandatory” federal programs, will drive the deficit higher again. By 2023, the CBO projects that the deficit will be 3.5% of GDP, or close to $900 billion, citing “the pressures of an aging population, rising health care costs, and an expansion of federal subsidies for health insurance.” But which of these factors is the biggest driver of this increase?

2013-10-15_Figure_1

Shifting Insurance Needs and Impact on Federal Spending 

In its recent (September 2013) publication, “The 2013 Long Term Budget Outlook,” the CBO looks beyond its usual 10-year forecast horizon and projects federal spending and revenues out to 2038, and notes that “the future size and composition of the U.S. population will affect federal tax revenues, federal spending, and the performance of the economy — for example, by influencing the size of the labor force and the number of beneficiaries of programs such as Medicare and Social Security.”

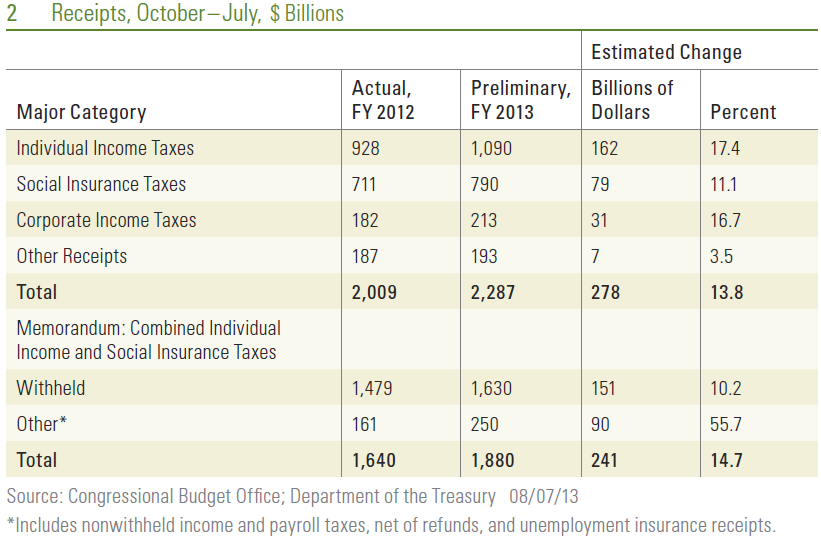
Today, 52 million people are covered by Medicare, and another 57 million are covered by Medicaid. Medicare provides coverage for the elderly and also covers several million non-elderly people. Medicaid covers a variety of low-income people, including pregnant women, children, parents, other caretaker relatives, and elderly and disabled individuals. As we noted in last week’s Weekly Economic Commentary, today around 156 million people have employment-based health care and another 9 million buy their primary health insurance on their own in the private market. Fifty-seven million people are uninsured. Figure 1 shows how the CBO expects the health care insurance market for non-elderly persons to shift over the next 10 years as a result of the ACA.

2013-10-15_Figure_2

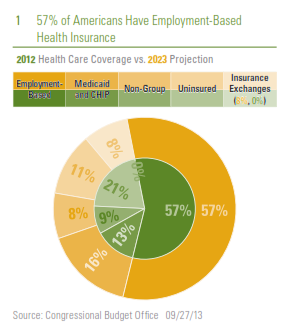
Federal spending on its major health care programs — Medicare, Medicaid, the Children’s Health Insurance Program, and subsidies offered through new health insurance exchanges — represented 4.6% of GDP in 2013, after averaging just 2.7% of GDP over the past 40 years (1973 – 2012). By 2038, spending on these major health care programs will grow to 8.0% of GDP [Figure 2]. Although outside the scope of this week’s Weekly Economic Commentary, spending on Social Security, another portion of mandatory federal spending that is largely driven by demographics, was 4.9% of federal spending in 2013 (versus 4.2% in the 1973 – 2012 period) and is expected to grow to “only” 6.2% of GDP by 2038.

Demographics Is Driving a Large Portion, but Not All the
Increase in Federal Spending on Health Care

The projected increases in federal spending, as a percentage of GDP, on major health care programs is driven by demographics (the percentage of the population that is over 65 years of age), rising health care spending per beneficiary, and the provisions of the ACA that provide a subsidy to persons purchasing health care insurance via one of the health care exchanges and expand Medicaid coverage in many states. As described above and in Figure 3, the percentage of the population that is 65 or older moves from about 14% today to 21% by 2038. Not shown on the chart, but equally as important, the percentage of the population that is over 80 will nearly double from around 4% today to around 7% by 2038. This is critical because per capita spending on health care rises with age [Figure 4]. In addition, the CBO projects that spending per enrollee in federal health care programs will rise at a faster pace than overall per capita GDP in the decades ahead.

2013-10-15_Figure_3

2013-10-15_Figure_4

Many factors help to explain the recent increase in per capita spending on health care, and the expected rise in per capita spending in the years and decades ahead [Figure 5]. Technology that has spurred the development of new medical equipment and new drugs is a key driver of this increase in spending. These new tools allow health care providers to diagnose and treat illnesses in ways that were not possible in the past. CBO notes that somewhat counter-intuitively, while technology normally drives costs down in an industry, it has the opposite impact in health care. The general rise in incomes and the increased access to insurance are also responsible for the increase in per capita spending on health care in recent years, and they are also likely to play a role in rising per capita spending in the years ahead.

2013-10-15_Figure_5

Responses to Rising Health Care Costs Will Be Critical

On balance, while demographics will be a key driver of the increase in federal expenditures on health care (and the overall federal budget deficit) in the decades to come, it is not the only driver. The CBO projects that just 35% of the increase in federal spending on health care between now and 2038 is related to the aging population. Another 40% of the increase is due to health care spending per capita rising faster than GDP per capita. CBO attributes the remainder of the increase in federal spending on major health care programs between now and 2038 (around 25%) to provisions of the ACA. After 2038, demographics and the ACA begin to fade as factors, and health care spending per capita becomes the biggest driver of federal spending on health care programs. CBO notes — and we concur — that national health care spending cannot rise more quickly than GDP forever, because as spending takes up an ever-larger share of federal spending (and household incomes), it begins to restrain spending in other critical areas. Demographics are a very important factor in determining health care costs in the decades ahead. However, more important is how (and when) the federal and state governments — and more critically — households and businesses respond to these rising costs.

___________________________________________________________________________________________________________________

IMPORTANT DISCLOSURES

The opinions voiced in this material are for general information only and are not intended to provide specific advice or recommendations for any individual. To determine which investment(s) may be appropriate for you, consult your financial advisor prior to investing.  All performance reference is historical and is no guarantee of future results. All indices are unmanaged and cannot be invested into directly.

The economic forecasts set forth in the presentation may not develop as predicted and there can be no guarantee that strategies promoted will be successful.

Stock investing involves risk including loss of principal.

Gross domestic product (GDP) is the monetary value of all the finished goods and services produced within  a country’s borders in a specific time period, though GDP is usually calculated on an annual basis. It includes all of private and public consumption, government outlays, investments and exports less imports that occur within a defined territory.

The Congressional Budget Office is a non-partisan arm of Congress, established in 1974, to provide Congress with non-partisan scoring of budget proposals.

Deficit Distraction
August 27, 2013

Deficit Distraction

In the 12 months ending July 2013, the federal government spent $3.4 trillion and took in $2.7 trillion in revenues, making the federal deficit (revenues less spending) about $725 billion, the smallest deficit recorded since late 2008. At just 3.5%, the deficit as a percent of nominal gross domestic product (GDP) over the past 12 months was also the smallest since late 2008, and stands in sharp contrast to the 10% deficit-to-GDP ratio posted in fiscal year (FY) 2009 ending September 2009 [Figure 1].

2013-08-27_Figure1

The story is much the same fiscal year to date in FY 2013, which ends on September 30, 2013. In the first 10 months of FY 2013, the budget deficit was $607 billion, or roughly 3.6% of GDP. Outlays have totaled $2.9 trillion and revenues have totaled $2.3 trillion. The first 10 months of FY 2013 saw the smallest deficit and deficit to GDP of any comparable period back to the first 10 months of FY 2008. An improved economy, a stronger labor market, spending cuts from sequestration, and recent changes to tax rates account for most of the improvement, although a few “one-time items” have also played a role. The non-partisan Congressional Budget Office (CBO), which produces an excellent update on the progress of the federal budget every month called “Monthly Budget Review” (see http://www.cbo.gov), continues to project that the budget deficit in FY 2013 will total $642 billion, or around 4.0% of GDP.

What’s Driving the Improvement in the Deficit?

Fiscal year to date in 2013, federal revenues are up 14%, while spending is down nearly 4%. Combined individual income tax receipts — which account for around 85% of federal revenues — are up 15% in the first 10 months of FY 2013 versus the same period in FY 2012. Personal income taxes account for roughly 50% of Federal revenues while taxes withheld for Social Security and Medicare account for 35% of federal revenues. A better labor market (2.3 million net new jobs were created over the past 12 months) and rising wages (wage and salary income, as measured by the monthly report on personal income and spending, is up 4% year over year), account for some of the gain. The fiscal cliff — the expiration of the Social Security payroll tax cut in January 2013 and the increase in tax rates for incomes above certain thresholds — have also boosted revenues. The rising equity market has also accounted for some of the gain in individual tax revenues: equity markets hit new all-time highs in the first half of 2013 and investors may set aside tax payments after exercising stock options or selling stocks. Corporate profits are at record levels, and corporate tax receipts are up 17% in the first 10 months of FY 2013 versus the similar period in FY 2012. Corporate tax receipts account for 10 – 15% of federal tax revenues [Figure 2].

2013-08-27_Figure2

At $2.9 trillion, federal budget outlays in the first 10 months of FY 2013 were $90 billion (or 4%) lower than in the same period in 2012. Not surprisingly, given the solid performance of the labor market noted above, federal spending on unemployment benefits was down a whopping 24% in the first 10 months of FY 2013, while defense spending (impacted in part by the sequester) fell 7%. Federal spending activities outside of defense and entitlement programs like Social Security, Medicare, and Medicaid fell 3% in the first 10 months of FY 2013 versus the first 10 months of FY 2012, but that figure is skewed lower by payments received by the federal government from the Troubled Asset Relief Program (TARP) and big payments from the large, quasi-government mortgage giants Fannie Mae and Freddie Mac that were at the center of the financial crisis. Despite the distortions, the sequester is having a modest impact in controlling non-defense discretionary spending. Interest payments on the public debt totaled $216 billion in the first 10 months of FY 2013, down 2% from the $222 billion in the similar period of FY 2012 [Figure 3].

2013-08-27_Figure3

Warning Signs

Some warning signs exist in the otherwise positive budget picture thus far in FY 2013 however, and if these warning signs continue to be ignored by policymakers, the near-term improvement in the budget picture is not likely to last. FY 2013 to date, federal spending on mandatory programs (payments set by formula written into the law) like Social Security, Medicare, and Medicaid is running above the pace of nominal GDP growth. Federal spending on Social Security benefits is up 5.4%, nearly twice the rate of nominal GDP growth over the past year (2.9%). Similarly, spending on Medicare is up 3.0% in the first 10 months of FY 2013, while Medicaid spending is up 5.7%, also about twice the rate of nominal GDP growth. The non-partisan CBO expects the improvement in the federal budget deficit to continue over the rest of this fiscal year, and for the next several fiscal years as well, through FY 2015. By then, the CBO expects the deficit as a percent of GDP to fall to 2.0%, the smallest since the 1.2% deficitto- GDP-ratio recorded in FY 2007, the last fiscal year prior to the Great Recession. From a 2.0% deficit-to-GDP ratio in FY 2015, the CBO projects that under current law, the deficit will increase to 3.2% in FY 2020 and to 3.5% by FY 2023, the last year the CBO makes a projection.

Most of the deficit deterioration in the latter half of this decade and the first half of the next occurs as a result of deterioration in the structural deficit, i.e., spending on mandatory programs like Social Security, Medicare, and Medicaid far outstripping the pace of GDP growth, mainly due to an aging population. The CBO projects that tax receipts targeted for use by those programs will only grow at the same pace as the overall economy over the next 10 years or so. Thus, the risk is that Congress and the general public will be distracted by the rapidly improving near-term budget outlook, and will not address the longer-term structural budget problem quickly enough to head off a worsening, long-term budget deficit.

____________________________________________________________________________________________________________

IMPORTANT DISCLOSURES

The opinions voiced in this material are for general information only and are not intended to provide specific advice or recommendations for any individual. To determine which investment(s) may be appropriate for you, consult your financial advisor prior to investing. All performance reference is historical and is no guarantee of future results. All indices are unmanaged and cannot be invested into directly.

Gross domestic product (GDP) is the monetary value of all the finished goods and services produced within a country’s borders in a specific time period, though GDP is usually calculated on an annual basis. It includes all of private and public consumption, government outlays, investments and exports less imports that occur within a defined territory.

The economic forecasts set forth in the presentation may not develop as predicted and there can be no guarantee that strategies promoted will be successful.

International investing involves special risks, such as currency fluctuation and political instability, and may not be suitable for all investors.

Purchasing Managers Index (PMI) is an indicator of the economic health of the manufacturing sector. The PMI index is based on five major indicators: new orders, inventory levels, production, supplier deliveries and the employment environment.

Markit is a leading, global financial information services company that provides independent data, valuations and trade processing across all asset classes in order to enhance transparency, reduce risk and improve operational efficiency. The Markit Purchasing Managers’ Index (PMIT) is a composite index based on five of the individual indexes with the following weights: New Orders – 0.3, Output – 0.25, Employment – 0.2, Suppliers’ Delivery Times – 0.15, Stocks of Items Purchased – 0.1, with the Delivery Times Index inverted so that it moves in a comparable direction.

The S&P/Case-Shiller U.S. National Home Price Index measures the change in value of the U.S. residential housing market. The S&P/Chase-Shiller U.S. National Home Price Index tracks the growth in value of real estate by following the purchase price and resale value of homes that have undergone a minimum of two arm’s-length transactions. The index is named for its creators, Karl Chase and Robert Shiller.

_____________________________________________________________________________________________________________________________________________________________________________

This research material has been prepared by LPL Financial.

To the extent you are receiving investment advice from a separately registered independent investment advisor, please note that LPL Financial is not an affiliate of and makes no representation with respect to such entity.

Not FDIC/NCUA Insured | Not Bank/Credit Union Guaranteed | May Lose Value | Not Guaranteed by any Government Agency | Not a Bank/Credit Union Deposit

Member FINRA/SIPC

Outlook 2013 | The Path of Least Resistance – Part I
November 29, 2012

This is the first of a 6 part series focused on the Outlook for 2013.

The series is broken down as follows:

Part 1 – The Path of Least Resistance

Part 2 – The Base Path:  The Compromise

Part 3 – The Bear Path:  Going Over the Cliff

Part 4 – The Bull Path:  The Long-Term Solution

Part 5 – The Paths for Europe, Central Banks, and Geopolitics

Part 6 – Over the (Capitol) Hill:  A View from the End of the First Quarter of 2013

Outlook 2013

In 2013, many different forces will combine to influence the direction of the markets to follow the path of least resistance leading to modest single-digit returns in the U.S. stock and bond markets.* The path for the year may be set at the end of 2012, or in early 2013, as critical decisions are implemented:

  • Washington will likely finally rise to the challenge of this self-imposed crisis and form the compromise between the parties that will meet the least resistance — extending some of the Bush-era tax cuts and cancelling some of the scheduled spending cuts. However, going down this path risks delaying progress toward a more permanent solution that makes the government’s finances sustainable.
  • The Federal Reserve (Fed) is likely to continue its bond-buying program of quantitative easing (QE). This open-ended QE is the path of least resistance among Fed decision makers and one which will buy the Fed more time to determine if more aggressive monetary policy easing is needed or if the economy can withstand a lessening of stimulus.
  • Major hurdles to further European integration overcome in 2012 set the stage for progress toward a tighter fiscal, economic, and banking union. A high degree of resistance to splitting apart counterbalanced with strong stances against unconditional support is likely to keep Europe on a middle path toward slow continued integration.
  • The U.S. economy faces the weakest global economic backdrop since the Great Recession of 2008 – 09 heading into the looming fiscal drag of tax increases and spending cuts. These forces are only partially offset by the benefits of Fed stimulus, the positive consumer wealth effect driven by the rebounding housing and stock markets, and the lifting of business uncertainty as the budget decisions are resolved. The combination is likely to result in a path leading to flat-to-weak growth for the U.S. economy.
The economic forecasts set forth in the presentation may not develop as predicted and there can be no guarantee that strategies promoted will be successful.
*Equity market forecast is for the S&P 500 Index and is based upon a low-single-digit earnings growth rate supported by modest share buybacks combined with 2% dividend yields and little change in valuations.  Bond market forecast is for the Barclays Aggregate Index and is based upon <1% rise in rates, with price declines offset by interest income.

Our base case path is supported by our view that key decision makers will find it is better to determine a way to overcome an avoidable and unnecessary economic recession, buy time to actually propose and vote on competing long-term fiscal visions, and do something to help restore confidence in Washington’s ability to govern. Ideally, this could help maintain investors’ appetites for U.S. equities and Treasuries. For the markets, the path of least resistance is likely to include modest single-digit returns for stocks as sluggish profit growth dampens stronger gains, but prices are supported by low valuations and improving clarity as uncertainties begin to fade. Bond yields may rise only slightly, restrained by sluggish growth and a Fed committed to keeping rates low, leaving returns to be limited to interest income at best. However, there are paths that differ from this base case outcome: a bear path where the consequences of fiscal contraction damage confidence as well as the economy, and a bull path where an historic opportunity to address the U.S.’s long-term fiscal challenges is embraced and leads to sustainable solutions. Which of these three is the path of least resistance is likely to be determined by the end of the first quarter of 2013.

Calendar of Events

The Base, Bull, and Bear Case Paths

The hard-fought election will likely be followed by more fighting in a divisive and bitter “lame duck” session in Congress running through year-end 2012. The stakes are high as those on Capitol Hill seek to mitigate the budget bombshell of tax increases and spending cuts, known as the fiscal cliff, due to hit in January 2013. The two parties have very different visions of what a deal should look like. Failure to reach a compromise in the coming months could lead to a recession and bear market for U.S. stocks in early 2013.

However, a deal is in the best interest of those on Capitol Hill. The Republicans have a lot of items that are important to them to lose in foregoing a deal with Democrats: the Bush tax cuts would expire and the looming spending cuts hit defense spending hard while not really impacting the big entitlement programs (such as Social Security, Medicare, Medicaid, and the Affordable Care Act). To avoid being blamed for a return to recession on their watch, Democrats may only need to compromise on extending the middle-class tax cuts, which President Obama already communicated his support of during his campaign, and delaying the impact of some of the spending cuts. The path to a deal may not be a straight line, but is the outcome we view as most likely and upon which we base our expectation of modest returns for stocks and bonds — with no bear or bull
market — in 2013.

While a deal may be likely, there are risks for investors. In October 2012, with the S&P 500 having risen back to within 10% of all-time highs, markets seemed confident that the Senate Democrats would quickly find a compromise with House Republicans to avoid going over the fiscal cliff. However, a compromise may be hard to reach. Recall that the gridlock in Washington was no help to markets in 2011, as the unwillingness to compromise on both sides of the aisle led to the debt ceiling debacle in August 2011, which sent the S&P 500 down over 10% in a few days despite the ultimate approval of the increase to the debt ceiling. A bear market and recession could be looming if policymakers choose this path.

Despite the risks, there is room for guarded optimism. If there ever were a time to enact long-term fiscal discipline, now is that time. The United States’ large and unsustainable budget deficits helped push total U.S. debt over 100% of Gross Domestic Product (GDP) in 2012.  Previously unmentionable as part of the “third-rail” of politics, wide-reaching bipartisan proposals have been unveiled to put the United States back on a path to fiscal sustainability. A long-term solution of permanent changes to tax rates and entitlement programs as well as ending the battles over the debt ceiling could emerge in 2013. This path would be welcomed with a bull market and lift the uncertainty plaguing business leaders and investors alike.

The battle is likely to result in a compromise that averts the worst-case outcome, but the negotiations themselves, coming on the heels of hard-fought election battles, may drive market swings. Fortunately, the lowest valuations for stocks in 20 years may help to limit downside and create potential investment opportunities. Which of these three paths will prevail is largely driven by the compromise — or lack thereof — in Washington.

IMPORTANT DISCLOSURES

The opinions voiced in this material are for general information only and are not intended to provide or be construed as providing specific investment advice or recommendations for any individual. To determine which investments may be appropriate for you, consult your financial advisor prior to investing. All performance referenced is historical and is no guarantee of future results. All indices are unmanaged and cannot be
invested into directly.

The economic forecasts set forth in the presentation may not develop as predicted and there can be no guarantee that strategies promoted will be successful.

Investing in specialty market and sectors carry additional risks such as economic, political or regulatory developments that may affect many or all issuers in that sector.

International and emerging market investing involves special risks such as currency fluctuation and political instability and may not be suitable for all investors.

Bonds are subject to market and interest rate risk if sold prior to maturity. Bond values and yields will decline as interest rates rise and bonds are subject to availability and change in price.

Municipal bonds are subject to availability, price, and to market and interest rate risk if sold prior to maturity. Bond values will decline as interest rate rise. Interest income may be subject to the alternative minimum tax. Federally tax-free, but other state and local taxes may apply.

Corporate bonds are considered higher risk than government bonds, but normally offer a higher yield and are subject to market, interest rate, and credit risk as well as additional risks based on the quality of issuer, coupon rate, price, yield, maturity, and redemption features.

Government bonds and Treasury Bills are guaranteed by the U.S. government as to the timely payment of principal and interest and, if held to maturity, offer a fixed rate of return and fixed principal value. However, the value of fund shares is not guaranteed and will fluctuate.

Treasuries: A marketable, fixed-interest U.S. government debt security. Treasury bonds make interest payments semi-annually and the income that holders receive is only taxed at the federal level.

Quantitative easing is a government monetary policy occasionally used to increase the money supply by buying government securities or other securities from the market. Quantitative easing increases the money supply by flooding financial institutions with capital in an effort to promote increased lending and liquidity.

The P/E ratio (price-to-earnings ratio) is a measure of the price paid for a share relative to the annual net income or profit earned by the firm per share. It is a financial ratio used for valuation: a higher P/E ratio means that investors are paying more for each unit of net income, so the stock is more expensive compared to one with a lower P/E ratio.

Earnings per share (EPS) is the portion of a company’s profit allocated to each outstanding share of common stock. EPS serves as an indicator of a company’s profitability. Earnings per share is generally considered to be the single most important variable in determining a share’s price. It is also a major component used to calculate the price-to-earnings valuation ratio.

Default rate is the rate in which debt holders default on the amount of money that they owe. It is often used by credit card companies when setting interest rates, but also refers to the rate at which corporations default on their loans. Default rates tend to rise during economic downturns, since investors and businesses see a decline in income and sales while still being required to pay off the same amount of debt.

Index Definitions
The IS M index is based on surveys of more than 300 manufacturing firms by the Institute of Supply Management. The IS M Manufacturing Index monitors employment, production inventories, new orders, and supplier deliveries. A composite diffusion index is created that monitors  conditions in national manufacturing based on the data from these surveys.

The Standard & Poor’s 500 Index is a capitalization-weighted index of 500 stocks designed to measure performance of the broad domestic economy through changes in the aggregate market value of 500 stocks representing all major industries.

Dow Jones Industrial Average (DJIA ): The Dow Jones Industrial Average Index is comprised of U.S.-listed stocks of companies that produce other (non-transportation and non-utility) goods and services. The Dow Jones Industrial Averages are maintained by editors of The Wall Street Journal. While the stock selection process is somewhat subjective, a stock typically is added only if the company has an excellent reputation, demonstrates sustained growth, is of interest to a large number of investors, and accurately represents the market sectors covered by the average. The Dow Jones averages are unique in that they are price weighted; therefore, their component weightings are affected only by changes in the stocks’ prices.

This information is not intended to be a substitute for specific individualized tax advice. We suggest that you discuss your specific tax issues with a qualified tax advisor.

This research material has been prepared by LPL Financial.
To the extent you are receiving investment advice from a separately registered independent investment advisor, please note that LPL Financial is not
an affiliate of and makes no representation with respect to such entity. 

Not FDIC /NC UA Insured | Not Bank/Credit Union Guaranteed | May Lose Value | Not Guaranteed by any Government Agency | Not a Bank/Credit Union Deposit

Budget Myths
November 20, 2012

As Congress and the President work together to avoid the looming fiscal cliff during the lame duck session of Congress, a more intransient problem remains in the background: the United States’ structural budget deficit. In our recent Weekly Economic Commentary: Budget Debate (10/29/12), we wrote about how often the budget was mentioned during the campaign season, and we pointed out that the economy and the labor market got more attention than the longer term budget issues facing the country. In late 2010, three different non-partisan organizations released plans that would put the U.S. budget on a path toward a balanced budget, using a combination of revenue/tax increases and spending cuts to achieve that goal. These organizations are:

  • The President’s National Commission on Fiscal Responsibility and Reform (commonly known as Bowles-Simpson);
  • Bipartisan Policy Center (commonly known as Rivlin-Domenici); and
  • Pew-Peterson Commission on Budget Reform.

While each plan differed on certain aspects of the longer term fix for our budget woes, they all generally agreed that there are no easy answers and no quick fixes. Both Democrats and Republicans populated the three commissions. Some hold (or once held) elected office, while others served in the federal government or were on the boards of the many think tanks in and around Washington. All were focused on finding bi-partisan solutions to the problem. In general, the three commissions concluded that in order to successfully tackle the longer term deficit problem, formerly politically untouchable areas must be on the table in any serious negotiation. These areas include:

  • Social Security;
  • Defense spending;
  • Farm subsidies;
  • Medicare;
  • Medicaid;
  • Personal and corporate tax rates; and

„„ So-called tax expenditures, more commonly known as personal and corporate tax deductions ( e.g., home mortgage interest, state and local real estate tax, or charitable contributions).

The plans did vary on the amount of revenue increases (via some combination of higher tax rates, fewer deductions, and more income subject to taxation) relative to spending cuts (across all categories of federal spending) needed to achieve a long-term path toward fiscal stability. The outcome of the November 6 election suggests that the ultimate mix of revenue increases and spending decreases that will set the country on that path is likely to be more reliant on revenue increases than spending cuts than if Governor Romney won and/or the Republicans took control of the Senate.

Absent from the list above are several budget items that receive a great deal of attention in the media, but are not a significant source of the nation’s long-term budget woes. For example, both the Bowles-Simpson plan and the Rivlin-Domenici plan noted that budgets cannot be balanced by eliminating waste or earmarks, by just cutting domestic discretionary spending, by growing our way out of the deficit, or by only raising taxes or cutting foreign aid — or all of these together. To illustrate why this is the case, we focus on the impact of waste, fraud, and abuse, domestic discretionary programs, and foreign aid have on our budget. In future commentaries, we intend to tackle some of the other items in the budget.

Fiscal Cliff Calendar of Events


Waste, Fraud, and Abuse: Impact
The libertarian Cato Institute, a Washington, D.C.-based think tank, estimates waste, fraud, and abuse in the federal budget at between $100 billion and $125 billion per year. On an absolute basis, this is an enormous amount of money, and taxpayers and the financial markets would welcome any and all steps to eliminate this from the budget. However, the annual outlays of the U.S. federal government in fiscal year 2012 were $3.5 trillion. So even if somehow the federal government were able to eliminate every dollar of waste, fraud, and abuse in the budget, federal outlays in fiscal year 2012 would still have been well over $3.3 trillion, and the federal deficit in fiscal year 2012 would have been $960 billion instead of $1 trillion.

Domestic Discretionary Spending: Impact
Let us now examine domestic discretionary spending. The federal budget can be sliced and diced several ways. One way to look at the budget is by function or cabinet post, i.e., Department of Labor, Department of the Interior, Department of Defense, etc. Another way is to group the spending categories together by legislative mandate. For example, all mandatory spending (regardless of function) is grouped together, and all non-mandatory spending (also known as discretionary spending) is grouped together. Mandatory spending is all spending that is not controlled through Congress’ annual appropriation process. For the most part, mandatory spending is based on eligibility criteria and benefit of payment rules set into law. Examples include Social Security, Medicare, Medicaid, and interest on the public debt. In recent fiscal years, mandatory spending has accounted for nearly two-thirds of all federal spending, and this slice of the pie is set to rise dramatically in the coming decade.

Discretionary spending is what Congress agrees to spend each year on things like national defense, education, Veterans Affairs, the national park system, etc. In recent fiscal years, discretionary spending has accounted for about one-third of federal budget outlays. Nondefense discretionary outlays ($528 billion in fiscal year 2011) alone account for only 10 – 15% of total outlays. Thus, even if we eliminated all nondefense discretionary spending — which would literally wipe out whole Cabinet level departments and hundreds of politically sensitive programs championed by both Republicans and Democrats — it would only make a small dent in the overall deficit.

Foreign Aid: Impact
Although not a single line item in the budget, foreign aid receives a great deal of attention in the media. A 2010 poll conducted by the University of Maryland’s Program on International Policy Attitudes found that Americans thought that the United States spends 25% of its budget on foreign aid. Foreign aid is mostly part of discretionary spending, but at around $40 – 50 billion per year accounts for roughly 1% of federal budget outlays, far less than the 25% of the budget the public thinks is spent. These outlays are found in the budgets of the U.S. Treasury, the Department of Agriculture, the State Department, and even the Department of Defense for items such as:

  • Embassy security;
  • The Peace Corps;
  • Disaster assistance;
  • Peacekeeping;
  • Direct economic support to foreign nations;
  • The World Bank, IMF, and United Nations; and
  • Global health initiatives.

Figure 2


Putting It All Together
All together, waste, fraud, and abuse, non-defense discretionary spending, and foreign aid amount to a sizable portion (more than $700 billion), roughly 20% of total federal outlays. But 80% of the budget lies outside of these three areas of the budget. Although there is certainly some merit in taking a hard look at each of these categories as part of a longer term budget reform, the real task lies in the 80% of federal outlays that are growing at an unsustainable pace and will contribute the most to our medium- and long-term budget woes in the coming decade.

LPL Financial 2012 Forecasts


IMPORTANT DISCLOSURES
The opinions voiced in this material are for general information only and are not intended to provide specific advice or recommendations for any individual. To determine which investment(s) may be appropriate for you, consult your financial advisor prior to investing. All performance reference is historical and is no guarantee of future results. All indices are unmanaged and cannot be invested into directly.

* Gross Domestic Product (GDP) is the monetary value of all the finished goods and services produced within a country’s borders in a specific time period, though GDP is usually calculated on an annual basis. It includes all of private and public consumption, government outlays, investments and exports less imports that occur within a defined territory.

^ Federal Funds Rate is the interest rate at which depository institutions actively trade balances held at the Federal Reserve, called federal funds, with each other, usually overnight, on an uncollateralized basis.

† Private Sector – the total nonfarm payroll accounts for approximately 80% of the workers who produce the entire gross domestic product of the United States. The nonfarm payroll statistic is reported monthly, on the first Friday of the month, and is used to assist government policy makers and economists determine the current state of the economy and predict future levels of economic activity. It doesn’t include:
– general government employees
– private household employees
– employees of nonprofit organizations that provide assistance to individuals
– farm employees

The economic forecasts set forth in the presentation may not develop as predicted and there can be no guarantee that strategies promoted will be successful.

Stock investing involves risk including loss of principal.

The index of leading economic indicators (LEI) is an economic variable, such as private-sector wages, that tends to show the direction of future economic activity.

International investing involves special risks, such as currency fluctuation and political instability, and may not be suitable for all investors.

INDEX DESCRIPTIONS
Purchasing Managers Index (PMI) is an indicator of the economic health of the manufacturing sector. The PMI index is based on five major indicators: new orders, inventory levels, production, supplier deliveries and the employment environment.

This research material has been prepared by LPL Financial.
To the extent you are receiving investment advice from a separately registered independent investment advisor, please note that LPL Financial is
not an affiliate of and makes no representation with respect to such entity.

Not FDIC/NCUA Insured | Not Bank/Credit Union Guaranteed | May Lose Value | Not Guaranteed by any Government Agency | Not a Bank/Credit Union Deposit

Cows grow wings – so do nest eggs!
August 23, 2012

While many of us dream of the golden years, lately it seems the healthcare goose has dropped its egg on seniors’ doorsteps.

For starters, if you retire early, this can leave a gap in health coverage before Medicare begins. Even after 65, Medicare covers only 60% of retirees’ average healthcare expenses.[1][1]

Next, we are living longer.  And the real risk—we can outlive our retirement savings!

Meanwhile, how do we manage our medical costs?  Public and private sector experts agree that no consensus exists as to when double-digit inflation in health care costs and health insurance premiums may end.[2][2]

If getting older is for the birds, so is paying for it.  The end is plainly not in sight.

According to Thomas Day, Director of The National Care Planning Council (NCPC), you need to start educating yourself now regarding your options.  Be sure to check out the NCPC website (http://www.longtermcarelink.net/).  Listed there are 34 articles constituting a virtual trove of information on long-term care, planning, elder care and geriatric care giving, facilities, and more.

Science can’t stop the aging process.  Nor is modern healthcare the entire answer.  By no means do we have all the answers.  But we do have alternatives.  You need information to make wise decisions to guide you through the maze.  As pertinent information crosses our desk, we will continue to inform you as you journey towards retirement.