Archive for the ‘Labor Market’ Category

Janet Yellen’s Employment Report
March 5, 2014

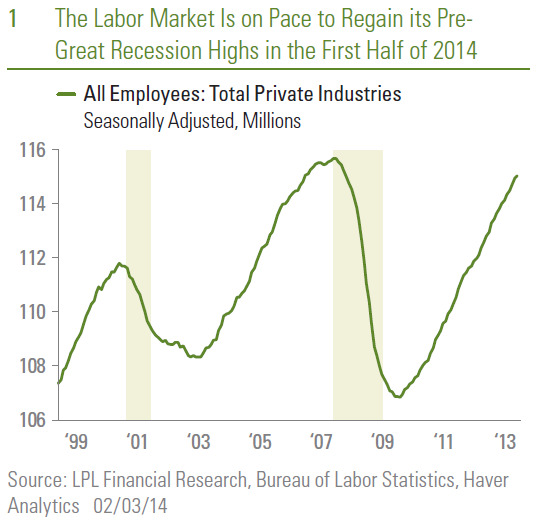
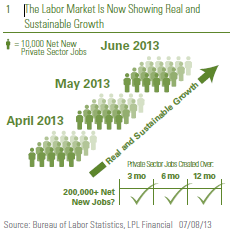
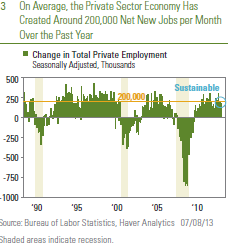
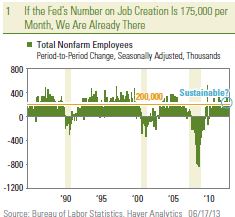
This Friday, March 7, 2014, the U.S. Department of Labor will release the Employment Situation report for February 2014. The Employment Situation report is two reports in one; the household survey generates the headline unemployment rate, while the establishment survey generates the nonfarm payroll job count. The unusually harsh winter weather across a large swath of the nation in February 2014 will likely have a major impact on the employment data in February. As of early Monday, March 3, 2014, the consensus of economists as polled by Bloomberg News is looking for a net increase of 154,000 private sector jobs in February 2014, after the 142,000 gain in January 2014. Prior to the 75,000 weather-impacted gain in jobs in December 2013, the private sector economy was consistently creating between 175,000 and 200,000 net new jobs per month. We continue to look for a return to that pace of job creation once the weather returns to normal.

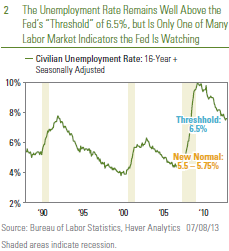
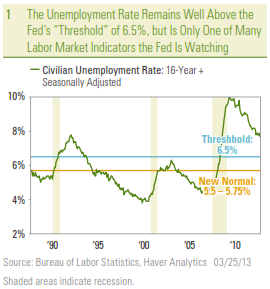
The consensus is looking for a 6.6% reading on the unemployment rate (see “A Closer Look: Labor Market Surveys,” page 5) in February 2014, the same reading as in January 2014. The market will be especially interested in the unemployment rate this month because just a 0.1% drop to 6.5% pushes the rate to the Federal Reserve’s (Fed) threshold of 6.5%.

Figure_1_-_3-5-2014

This threshold was a common theme in the second leg of Fed Chair Janet Yellen’s testimony before the Senate Banking Committee late last week (Thursday, February 27, 2014). Although the focus in the media this week ahead of the release of the Employment Situation report is likely to be on the nonfarm payroll job count and the unemployment rate, in this week’s Weekly Economic Commentary, we will focus on Janet Yellen’s employment report on various employment statistics that Yellen said the Fed will be watching closely.

Figure_2_-_3-5-2014

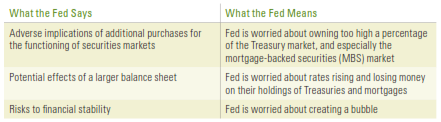
Last week, senators on the Senate Banking Committee asked Yellen several times about the state of the labor market. A sampling of her answers is below, and we’ve bolded some of the labor market metrics she mentioned:

The unemployment rate is not a sufficient statistic to measure the health of the labor market. An additional 5 percent, an unusually high fraction of our labor force is working part time for economic reasons which means they’re unable to get full-time work but want it. That’s an additional 7 million plus Americans who are involuntarily employed part time. And we have [an] unusually high fraction of Americans who are unemployed and have been for substantial amounts of time. So, you know, as we go — go to a fuller consideration of how is the labor market performing, we need to take all of those things into account.

There is no hard and fast rule about what unemployment rate constitutes full employment, and we need to consider a broad range of indicators. Many members of the committee have emphasized this point and it’s one I agree with.

Well, Senator, we are very focused on and concerned about the high level of long-term unemployment. It’s really unprecedented to see something like 37 percent of unemployed in long spells. I mean, what can we do? We can try to foster a stronger labor market generally. We don’t have tools that are targeted at long-term unemployment. But in taking account of how much slack there is in the labor market…

Look, if the unemployment rate is above that (6.5%), we see absolutely no need to consider any possibility of raising rates. Below that we begin to look more carefully.

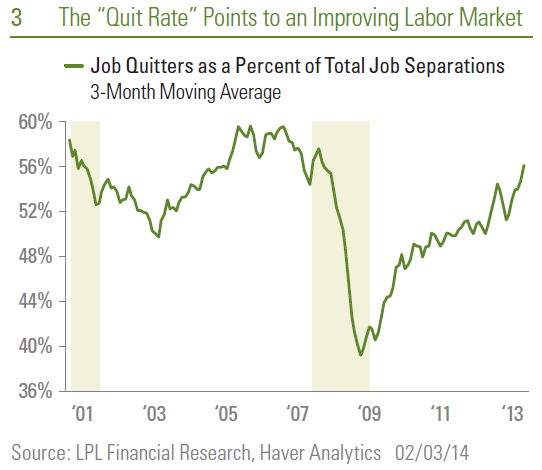
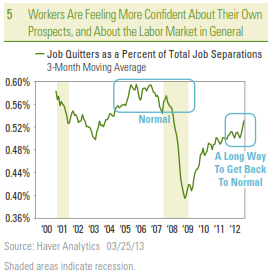
The unemployment rate, if I had to choose one metric, the unemployment rate is probably best. And members of our committee aren’t certain exactly what constitutes full employment, but generally see a range of 5 percent to 6 percent or a little bit in that area to be a state of full unemployment in the economy. But also looking at part time employment, job flows, what’s happening with wages and a broader set of metrics I think is necessary.

The fact that we’ve seen very slow growth in wages, for example, I take as one of many pieces of information suggesting the labor market has not — has not returned to normal and has quite a ways to go.

Fed Monitoring Labor Market Indicators

In general, Yellen made it clear that the Fed is in no hurry to raise rates when the unemployment rate crosses the 6.5% threshold. This metric was first cited by the Federal Open Market Committee (FOMC) in December 2012, when it noted that it “currently anticipates that this exceptionally low range for the federal funds rate will be appropriate at least as long as the unemployment rate remains above 6-1/2 percent, inflation between one and two years ahead is projected to be no more than a half percentage point above the Committee’s 2 percent longer-run goal, and longer-term inflation expectations continue to be well anchored.”

Instead, Yellen pointed out, the Fed would broaden the labor market indicators it is monitoring, and “look more carefully” at other relevant metrics. The tone of Yellen’s remarks indicated that while she didn’t speak for the FOMC, she was not ready to say that the labor market was back to normal, or anywhere close to it, even though the unemployment rate was poised to cross the 6.5% threshold.

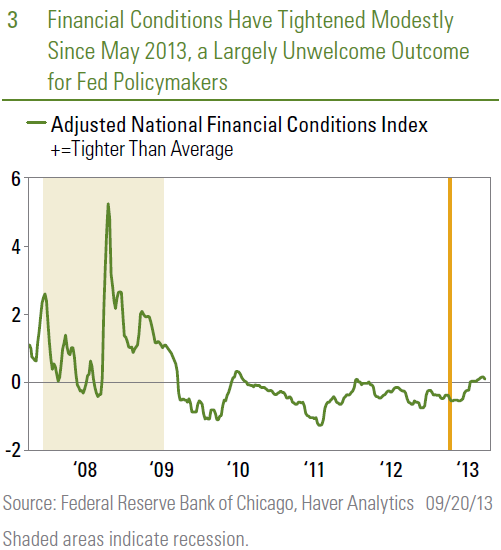
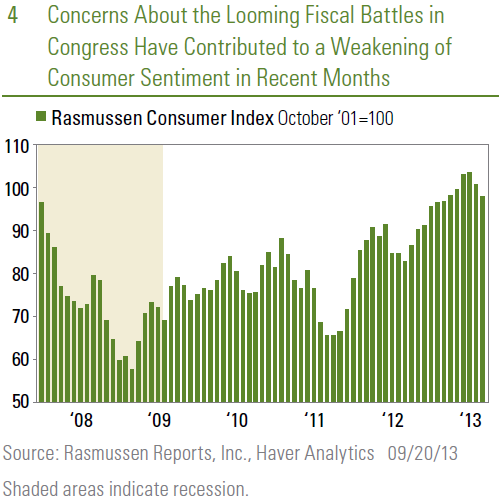
The risk in this view for financial markets — and especially the bond market — is that there is less slack in the labor market than Yellen and most other members of the FOMC think there is. While there are still many more factors pushing down on inflation than pushing inflation higher, wages account for two-thirds of businesses’ costs, and therefore, play a big role in the overall pace of inflation. We have already seen evidence that wages are rising and labor market conditions are tightening in a few scattered industries. For example, energy, construction, information technology, and logistics were cited in the most recent Beige Book as professions that were seeing above-average wage increases and higher starting pay for skilled workers. We are likely to hear more about this in the next Beige Book, which is due out this week. If market participants sense that wage pressures are gaining momentum, and that the Fed is “behind the curve” on inflation, bond yields could rise rapidly over a short period of time and counteract the monetary stimulus the Fed is supplying to the economy.

Figure_3_-_3-5-2014

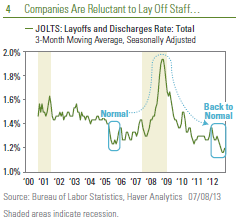
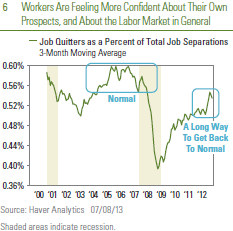
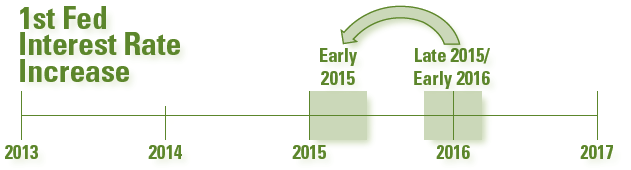
The infographic on page 4 details the performance of nine key labor market metrics mentioned by Yellen in her recent public appearances. Although most have partially recovered from their Great Recession nadirs, only a few have returned to “normal.” Until they do — or at least until they make significant progress toward normal — markets should expect that the Fed will be content with keeping its fed funds rate target near zero. In our view, late 2015 or even early 2016 is when the Fed is likely to begin raising rates.

A Closer Look:  Labor Market Surveys

  • A survey of 60,000 households nationwide — an incredibly large sample size for a national survey — generates the data set used to calculate the unemployment rate, the size of the labor force, part-time and full-time employment, the reasons for and duration of unemployment, and employment status by age, educational attainment, and race. The “household survey” has been conducted essentially the same way since 1940, and although it has been “modified” over the years, the basic framework of the data set has stayed the same. The last major modification to the data set (and to how the data is collected) came in 1994. To put a sample size of 60,000 households into perspective, nationwide polling firms typically poll around 1,000 people for their opinion on presidential races.
  • The headline unemployment rate (6.6% in January 2014) is calculated by dividing the number of unemployed (10.2 million in January 2014) by the number of people in the labor force (155.5 million). The civilian population over the age of 16 stood at 246.9 million in January 2014. A person is identified as being part of the labor force if they are over 16, have a job (employed), or do not have a job (unemployed) but are actively looking for work. A person is not in the labor force if they are neither employed nor unemployed. This category includes retired persons, students, those taking care of children or other family members, and others who are neither working nor seeking work.
  • In January 2014, the labor force was 155.5 million, which consisted of 145.2 million employed people and 10.2 million unemployed people. Another 91.4 million people over the age of 16 were classified as not in the labor force. The 155.5 million people in the labor force plus the 91.4 million people not in the labor force is equal to the over 16 civilian population, 246.9 million.
  • The payroll job count data are culled from a survey of 440,000 business establishments across the country. The sample includes about 141,000 businesses and government agencies, which covers approximately 486,000 individual worksites drawn from a sampling frame of Unemployment Insurance (UI) tax accounts covering roughly 9 million establishments. The sample includes approximately one-third of all nonfarm payroll employees. From these data, a large number of employment, hours, and earnings series in considerable industry and geographic detail are prepared and published each month.

_____________________________________________________________________________________________________________________________

IMPORTANT DISCLOSURES

The opinions voiced in this material are for general information only and are not intended to provide specific advice or recommendations for any individual. To determine which investment(s) may be appropriate for you, consult your financial advisor prior to investing. All performance reference is historical and is no guarantee of future results. All indices are unmanaged and cannot be invested into directly.

The economic forecasts set forth in the presentation may not develop as predicted and there can be no guarantee that strategies promoted will be successful.

Stock investing involves risk including loss of principal.

The Bureau of Labor Statistics is a government agency that produces economic data that reflects the state of the U.S. economy. This data includes the Consumer Price Index, the unemployment rate and the Producer Price Index.

______________________________________________________________________________________________________________________________

This research material has been prepared by LPL Financial.

To the extent you are receiving investment advice from a separately registered independent investment advisor, please note that LPL Financial is not an affiliate of and makes no representation with respect to such entity.

Not FDIC/NCUA Insured | Not Bank/Credit Union Guaranteed | May Lose Value | Not Guaranteed by any Government Agency | Not a Bank/Credit Union Deposit

Member FINRA/SIPC

The Employment Situation: Slow Climb Back
February 4, 2014

This Friday, February 7, 2014, the U.S. Department of Labor will release its monthly Employment Situation report. Though a lagging indicator of the economy, the report will likely garner plenty of attention from market participants, policymakers, politicians, pundits, the news media, and the public.

In December 2007 and January 2008, U.S. private sector jobs peaked at 115.7 million. The Great Recession and its aftermath saw the private sector economy shed 8.9 million jobs, and by February 2010, the private sector economy was down to 106.8 million jobs. Since then, the private sector economy has created 8.2 million jobs, and as 2013 ended, needed just under 700,000 net new jobs to get back to the pre-recession peak. We expect that to occur sometime in the first six months of 2014 [Figure 1].

Figure_1
Prior to the disappointing December 2013 employment report (released in early January 2014), which revealed that the private sector economy had created only 87,000 net new jobs in the weather-impacted month of December 2013, the economy had consistently been creating between 175,000 and 200,000 net new jobs per month [Figure 2]. We expect this pace of job creation to continue in 2014, with some variation around the trend due to fundamentals and weather. (See below for a discussion of weather’s impact on the January 2014 report.)

Figure_2

Weather and Revisions:  Sources of Uncertainty

The consensus of economists as surveyed by Bloomberg News is looking for a 190,000 gain in private sector payrolls in January 2014, after the 87,000 gain in December 2013. The range of estimates — the difference between the high and low estimate — is unusually wide for the January report. In recent years, the range of estimates has been around 120,000; for January’s report it is 200,000. The unusually wide range reflects the uncertainty around the impact of the weather on both the December 2013 and January 2014 reports, and also the revisions to the employment data made each year at this time.

While not all of the weakness in the December 2013 employment report was due to an unusually cold and snowy December, a sizable portion was. In January 2014, the population-adjusted average temperature was two degrees above normal. In December 2013, the same metric was two degrees colder than usual. The anomaly was even worse during the survey week (the week containing the 12th of the month) for the December 2013 employment report. It was six degrees colder than usual during the survey week in December 2013, and two degrees warmer than usual during the survey week in January 2014. In addition, the Department of Labor said that 273,000 people were “unable to work because of bad weather” in December 2013, the most for any December since 1977. This metric will be very closely watched again in January.

Another source of uncertainty surrounding the January 2014 employment report is revisions. In February of each year, the Labor Department releases revised data on the number of employees on payrolls. The revisions are based on new information gathered from businesses records and tax returns. Because of these revisions, the monthly changes in the payroll job count over the past year will be adjusted, but the pattern of employment is unlikely to change very much.

As noted in our Outlook 2014: The Investor’s Almanac, our view for this year is that U.S. economic growth will accelerate to 3.0% from the 2.0% pace seen in 2013. We expect both the federal government’s lifting of fiscal drags and increased state and local government spending to boost economic growth this year. In all of 2013, state and local government spending subtracted a small amount (0.02 percentage points) from gross domestic product (GDP) growth, but all of that drag occurred in the first quarter of 2013. By contrast, state and local governments added 54,000 jobs in 2013, marking the first year since 2008 that the sector added jobs. This sector added jobs in eight of the final 11 months of 2013, and we expect that trend to persist well into 2014 and beyond.

Fedlines and Labor Market Health Points

Of course, financial markets pay so much attention to this report because policymakers at the Federal Reserve (Fed) have tied the pace of quantitative easing (QE), and indeed the Fed’s guidance on rates, to the health of the labor market. “Maximum employment” in the context of price stability is the Fed’s goal, and the new Fed chairwoman, Janet Yellen, has cited several labor market metrics in public appearances over the past several years. Next week, Tuesday, February 11, 2014, Yellen will deliver the Fed’s semiannual Monetary Policy testimony (also known as the Humphrey-Hawkins testimony) to Congress, providing the market with her views on policy, the economy, and the labor market for the first time as Fed chairwoman.

In its most recent (January 29, 2014) statement, the Federal Open Market Committee (FOMC), the Fed’s policy making arm, reaffirmed that:

The current exceptionally low target range for the federal funds rate of 0 to 1/4 percent will be appropriate at least as long as the unemployment rate remains above 6-1/2 percent, inflation between one and two years ahead is projected to be no more than a half percentage point above the Committee’s 2 percent longer-run goal, and longer-term inflation expectations continue to be well anchored.

In addition, in his final press conference as chairman in December 2013, Ben Bernanke discussed the unemployment rate, saying:

And so we were comfortable setting a 6.5 percent unemployment rate as the point at which we would begin to look at a more broad set of labor market indicators. However, precisely because we don’t want to look just at the unemployment rate, we want to — once we get to 6½ — we want to look at hiring, quits, vacancies, participation, long-term unemployment, et cetera, wages. We couldn’t put it in terms of another unemployment rate level, specifically. So, I expect there will be some time past the 6½ percent before all of the other variables that we’ll be looking at will line up in a way that will give us confidence that the labor market is strong enough to withstand the beginning of increases in rates.

The metrics Bernanke noted, including hiring, quits, vacancies, and participation, have been cited by Yellen in the past as indicators she was watching to gauge the health of the labor market. This week’s employment report for January 2014 will provide updates of several of these metrics (the participation rate, long-term unemployment, wages, hiring), and market participants will closely watch these as they gauge the pace of tapering and the Fed’s guidance on rates.

On the other hand, the data on “quits” and “vacancies” are found in the monthly Job Openings and Labor Turnover Survey (JOLTS). The JOLTS report (for December 2013) is due out on the same day (and at the same time) that Janet Yellen delivers her first Humphrey-Hawkins testimony to Congress, next Tuesday, February 11, 2014. Figure 3 shows that the “quit rate” — the percentage of job leavers who leave their jobs voluntarily (presumably because they have better prospects elsewhere) — climbed to near-record highs in late 2013. However, some of the other labor market metrics noted recently by Bernanke and Yellen are still at depressed levels.

Figure_3

On balance, the January 2014 employment report will garner plenty of attention from market participants, the media, and the public as the labor market continues its slow climb back to its pre-recession peak.

___________________________________________________________________________________________________________________________

IMPORTANT DISCLOSURES
The opinions voiced in this material are for general information only and are not intended to provide specific advice or recommendations for any individual. To determine which investment(s) may be appropriate for you, consult your financial advisor prior to investing. All performance reference is historical and is no guarantee of future results. All indices are unmanaged and cannot be invested into directly.

The economic forecasts set forth in the presentation may not develop as predicted and there can be no guarantee that strategies promoted will be successful.

Stock investing involves risk including loss of principal.

The Federal Open Market Committee (FOMC), a committee within the Federal Reserve System, is charged under the United States law with overseeing the nation’s open market operations (i.e., the Fed’s buying and selling of U.S. Treasury securities).

Quantitative easing is a government monetary policy occasionally used to increase the money supply by buying government securities or other securities from the market.  quantitative easing increases the money supply by flooding financial institutions with capital in an effort to promote increased lending and liquidity.

Job Openings and Labor Turnover Survey (JOLTS) is a survey done by the United States Bureau of Labor Statistics to help measure job vacancies. It collects data from employers including retailers, manufacturers and different offices each month. Respondents to the survey answer quantitative and qualitative questions about their businesses’ employment, job openings, recruitment, hires and separations. The JOLTS data is published monthly and by region and industry.

Gross Domestic Product (GDP) is the monetary value of all the finished goods and services produced within a country’s borders in a specific time period, though GDP is usually  calculated on an annual basis. It includes all of private and public consumption, government outlays, investments and exports less imports that occur within a defined territory.

____________________________________________________________________________________________________________________________

This research material has been prepared by LPL Financial.
To the extent you are receiving investment advice from a separately registered independent investment advisor, please note that LPL Financial is
not an affiliate of and makes no representation with respect to such entity.

Not FDIC/NCUA Insured | Not Bank/Credit Union Guaranteed | May Lose Value | Not Guaranteed by any Government Agency | Not a Bank/Credit Union Deposit

Member FINRA/SIPC

Ben’s Top 10
December 23, 2013

The Federal Reserve’s (Fed) policymaking arm, the Federal Open Market Committee (FOMC), announced that it will begin tapering, or scaling back, its bond-buying program known as quantitative easing (QE) at its final meeting of the year last week. The Fed will now purchase $75 billion per month in QE — $10 billion less than the current monthly $85 billion, citing less fiscal drag and the “cumulative progress toward maximum employment and the improvement in the outlook for labor market conditions.”

We believe the Fed made somewhat of a “trade” with the bond market. On one side, the Fed reduced QE by $10 billion per month. Conversely, the Fed delivered a bullish and confident view on the U.S. economy — signaling that it would keep interest rates lower for longer. The stock market was more than willing to forego $10 billion in purchases now (via the taper) in exchange for a bullishly confident Fed that will likely keep rates lower for longer and saw this as a good trade. After all, it is the Fed’s zero interest rate policy, not its soonto- be tapered bond purchases, that has the biggest impact on maintaining lower rates and boosting economic growth.

Fedlines: Ben’s Top 10

Unless the Fed decides to hold a press conference at its next policy meeting in late January 2014, last week’s press conference was outgoing Fed Chairman Ben Bernanke’s last. During that final press conference, Bernanke was asked about — and weighed in on — several key topics that will likely impact financial markets and the economy throughout 2014. Below, we examine Bernanke’s top 10 answers in his own words at his final press conference as Fed Chairman.

1. Is tapering tightening?

“And so I do want to reiterate that this is not intended to be a tightening.”

2. What advice do you have for Janet Yellen? (If confirmed by the Senate, Yellen will replace Bernanke as Fed Chairman in early 2014.)

“Well, I think the first thing to agree to is that Congress is our boss. The Federal Reserve is a(n) independent agency within the government. It’s important that we maintain our policy independence in order to be able to make decisions without short-term political interference.”

3. At what pace will the Fed taper?

“Sure, on the first issue of 10 billion (dollars), again, we say we are going to take further modest steps subsequently, so that would be the general range.”

4. Would the Fed do more if the economy falters? Would you increase purchases?

“But there are things that we can do. We can strengthen the guidance in various ways. And while the view of the committee was that the best way forward today was in this more qualitative approach, which incorporates elements both of the unemployment threshold and the inflation floor, that further strengthening would be possible and it’s something that is certainly not been ruled out.

And of course, asset purchases are still there to be used. We do have tools to manage a large balance sheet. We’ve made a lot of progress on that. So while — again, while we think that we can provide a high level of accommodation with a somewhat slower place, but still very high pace of asset purchases and our interest rate policy, we do have other things we can do if we need to ramp up again. That being said, we’re hopeful that the economy will continue to make progress and that we’ll begin to see the whites of the eyes of the end of the recovery and the beginning of the more normal period of economic growth.”

“Under some circumstances, yes, … we could stop purchases if the economy disappoints, we could pick them up somewhat if the economy is stronger.”

5. Why Has Recovery Been So Slow?

“It’s — of course that’s something for econometricians and historians to grapple with, but there have been a number of factors which have contributed to slower growth. They  include, for example, the observation of financial crises tend to disrupt the economy, may affect innovation, new products, new firms.

We had a big housing bust, and so the construction sector of course has been quite depressed for a while. We’ve had continuing financial disturbances in Europe and elsewhere. We’ve had very tight — on the whole, except for in 2009, we’ve had very tight fiscal policy.

People don’t appreciate how tight fiscal policy has been. At this stage in the last recession, which was a much milder recession, state, local and federal governments had hired 400,000 additional workers from the trough of the — of the recession. At the same point in this recovery, the change in state, local and federal government workers is minus 600,000.

So there’s about a million workers’ difference in how many people are — been employed at all levels of government. So fiscal policy has been tight, contractionary. So there have been a lot of headwinds. All that being said, we have been disappointed in the pace of growth, and we don’t fully understand why. Some of it may just be a slower pace of underlying potential, at least temporarily. Productivity has been disappointing. It may be that there’s been some bad luck, for example, the effects of the European crisis and the like. But compared to other advanced industrial countries, Europe, U.K., Japan — compared to other countries — advanced industrial countries recovering from financial crises, the U.S. recovery has actually been better than most.

It’s not been good. It’s not been satisfactory. Obviously, we still have a labor market where it’s not easy for people to find work. A lot of young people can’t get the experience and entree into the labor market. But I think given all of the things that we’ve faced, it’s perhaps, at least in retrospect, not shocking that the recovery has been somewhat tepid.”

6. What impact has QE had on the economy? Has QE worked?

”Well, it’s very hard to know — in terms of the study it’s very hard to know — it’s an imprecise science to try to measure these effects. You have to obviously ask yourself, you know, what would have happened in the absence of the policy. I think that study — I think it was a very interesting study, but it was on the upper end of the estimates that people have
gotten in a variety of studies looking at the effects of asset purchases.

That being said, I’m pretty comfortable with the idea that this program did, in fact, create jobs. I cited some figures. To repeat one of them, the Blue Chip forecast for unemployment in this current quarter made before we began our program was on the order of 7.8 percent, and that was before the fiscal cliff deal, which even — created even more fiscal head
winds for the economy. And of course, we’re now at 7 percent. I’m not saying that asset purchases made all that difference, but it made some of the difference. And I think it has helped to create jobs.

And you can see how it works. I mean, the asset purchases brought down long-term interest rates, brought down mortgage rates, brought down corporate bond yields, brought down car loan interest rates. And we’ve seen response in those areas as the economy has done better. Moreover, again, this has been done in the face of very tight, unusually tight fiscal policy for a recovery period. So I do think it’s been effective, but the precise size of the impact is something I think that we can very reasonably disagree about and the work will continue on. As I said before, the uncertainty about the impact and the uncertainty about the effects of ending programs and so on is one of the reasons why we have treated
this as a supplementary tool rather than as our primary tool.”

7. Are you concerned about deflation?

“Now, it is true that while we have passed the — or made significant progress on the labor market and growth hurdles, there is still this question about inflation, which is a bit of a concern, more than a bit of concern, as we indicated in our statement. Our outlook is still for inflation to go back to 2 percent. I gave you some reasons why I think that will happen. But we take that very seriously. And if inflation does not show signs of returning to target, we will take appropriate action.”

8. What impact has fiscal policy had on the recovery?

“We’ve had very tight — on the whole, except for in 2009, we’ve had very tight fiscal policy. People don’t appreciate how tight fiscal policy has been. At this stage in the last recession, which was a much milder recession, state, local and federal governments had hired 400,000 additional workers from the trough of the — of the recession. At the same point in this recovery, the change in state, local and federal government workers is minus 600,000. So there’s about a million workers’ difference in how many people are being employed at all levels of government. So fiscal policy has been tight, contractionary.”

9. What is your view on the recent budget deal?
“I will say a couple of things about this deal. One is that, relative to where we were in September and October, it certainly is nice that there has been a bipartisan deal and that it looks like it’s going to pass both houses of Congress. It’s also, at least directionally, what I have recommended in testimony, which is that it eases a bit the fiscal restraint in the next couple
of years, a period where the economy needs help to finish the recovery. And in place of that it achieves savings further out in the — in the 10-year window. So those things are positive things. Of course there’s a lot more work to be done. I have no doubt about that. But it’s certainly a better situation than we had in September and October, or in January during the fiscal cliff, for that matter. And I think it will be good for confidence if fiscal policy and congressional leaders work together to — even if — even if the outcomes are small, as this one was, it’s a good thing that they are working cooperatively and making some progress.

10. Has the large budget deficit weighed on the recovery?

“I mean, investment is driven by sales, by the need for capacity. And, you know, with a slow-growing GDP, slow-growing economy, most firms yet — do not yet feel that much pressure on their capacity to do major new projects. There’s also a variety of uncertainties out there — fiscal, regulatory tax and so on — that no doubt affects some of these calculations…I think there are a lot of factors. Usually you think that the way that a deficit or a long-term debt would affect investment would be through what’s called
crowding out, that it’s raising interest rates. But high interest rates — we may have many problems, but high interest rates is not our problem right now. There’s plenty of — particularly for larger firms, there’s plenty of credit available at low interest rates.”

Fed Watch: Employment Metrics
Outside of “Ben’s Top 10,” we learned that the Fed is indeed watching the employment metrics that we have written about several times this year:

  • The quit rate;
  • The hiring rate;
  • Job openings;
  • Wages;
  • Long-term unemployment; and
  • The participation rate.

Fed Watch: Inflation Factors
On the inflation front, Bernanke opined that some special factors are holding inflation back now and that inflation may pick up in the coming months. He said the FOMC is watching:

  • Health care costs;
  • Inflation expectations (as measured by markets and surveys of individuals and professionals);
  • Wage inflation;
  • U.S. and international GDP growth.

Figure_1_001

The Fed delivered a holiday surprise for the market — a bullish forecast via a signal that it will remain “highly accommodative” with low interest rates for longer . As we have discussed, we view the Fed’s decision as reaffirming our outlook for accelerating economic and profit growth in 2014. We continue to believe 2014 marks a return to a focus on the fundamentals of investing.

___________________________________________________________________________________________________________________________

IMPORTANT DISCLOSURES
The opinions voiced in this material are for general information only and are not intended to provide specific advice or recommendations for any individual. To determine which investment(s) may be appropriate for you, consult your financial advisor prior to investing. All performance reference is historical and is no guarantee of future results. All indices are unmanaged and cannot be invested into directly.

The economic forecasts set forth in the presentation may not develop as predicted and there can be no guarantee that strategies promoted will be successful.

Stock investing involves risk including loss of principal.

This research material has been prepared by LPL Financial.
To the extent you are receiving investment advice from a separately registered independent investment advisor, please note that LPL Financial is
not an affiliate of and makes no representation with respect to such entity.

Not FDIC/NCUA Insured | Not Bank/Credit Union Guaranteed | May Lose Value | Not Guaranteed by any Government Agency | Not a Bank/Credit Union Deposit

Member FINRA/SIPC

Communication Breakdown?
September 24, 2013

Communication Breakdown?

In our recent Weekly Economic Commentary: Trust (September 9, 2013), we argued that there was not a clear-cut case for tapering based only on the economic or inflation backdrop. Instead, our view was that concerns expressed by Federal Reserve (Fed) officials over the past six months or so — that additional quantitative easing (QE) could potentially disrupt the smooth functioning of securities markets, cause investors to take on excessive risk and “reach for yield,” and add to financial instability in the global economy — would tip the scales in favor of a taper. Perhaps more important, in our view, were shifting market expectations since Fed Chairman Ben Bernanke’s testimony before the Joint Economic Committee of Congress in May of this year, when he said:

If we see continued improvement, and we have confidence that that is going to be sustained, in the next few meetings we could take a step down in our pace of purchases.

Financial market participants had since come to expect that the Fed would begin to taper this month, absent a major downshift in the economy. Our view was that if the Fed did not follow through on tapering, it risked losing the market’s hard-earned trust, and any trust the markets have in the Fed today will likely come in handy when the Fed has to begin removing stimulus and raising rates in the years ahead.

“The Song Remains the Same”

Ultimately, however, the trust argument did not win the day. The Fed surprised almost everyone last week (September 16 – 20) as the Fed’s policymaking arm, the Federal Open Market Committee (FOMC), voted to maintain its current pace of combined purchases at $85 billion of Treasuries and agency mortgage-backed securities (MBS) as part of its QE program. In making the decision, the FOMC cited tightening financial conditions (likely largely in the form of higher mortgage rates and the flow of credit to small- and medium-sized businesses), the looming fiscal debates, the still-sluggish economy (real gross domestic product [GDP] growth is tracking below 2.0% in the third quarter of 2013), and the sluggish labor market as the reasons for continuing purchases at the same level. In addition to maintaining the current pace of QE, the FOMC strengthened its commitment to keeping its fed funds rate target — currently near zero — at that level until well after it finally winds down its QE program.

2013-09-24_Figure_1

The FOMC’s actions surprised market participants, who expected the FOMC to begin tapering its purchases to around $70 or $75 billion per month, from the current $85 billion per month, and also to confirm that QE would end by mid-2014. Instead, the FOMC backed away from its earlier guidance about ending QE in mid-2014, suggesting a later start date for tapering and a later end date for QE, likely late 2014. In his prepared remarks prior to his post-FOMC meeting press conference on Wednesday, September 18, 2013, and during the Q&A period of the press conference itself, Bernanke worked hard to convince markets that tapering was not tightening, noting:

…even after asset purchases are wound down — which we will do in a manner that is both deliberate and dependent on the incoming economic data — the Federal Reserve’s rate guidance and its ongoing holdings of securities will ensure that monetary policy remains highly accommodative.

“Good Times, Bad Times”

A quick review of the public appearances made by Bernanke and his colleagues on the FOMC since early May 2013, as well as the FOMC statements and minutes from the June and July FOMC meetings, do show that Fed officials essentially repeated that same mantra — predicating a tapering this fall on better data. Markets, especially fixed income and many emerging markets, reacted swiftly to (some of) Bernanke’s words during the spring and summer and drove bond yields sharply higher, largely ignoring the data dependent part of the Fed’s case.
Looking ahead, market participants may need to recalibrate how they listen to the Fed, and the Fed may need to rethink how it communicates with the markets and the public. In an effort to aid the market, and be more transparent, Bernanke laid out the Fed’s action plan for the next several FOMC meetings in several key passages from last week’s post-FOMC press conference [“Ramble On”]. In addition, Bernanke specifically mentioned several metrics the FOMC will be watching in the coming months as it decides whether or not to taper. The indicators he mentioned were:

Inflation

  • The personal consumption deflator excluding food and energy (also known as the core PCE deflator)

The Labor Market

  • Private sector job count
  • Unemployment rate
  • Initial claims for unemployment insurance
  • Aggregate hours worked
  • Consumers’ assessment of whether jobs were easy or hard to get
  • The labor market participation rate
  • The median duration of unemployment
  • Real wages
  • Discouraged workers

Financial Conditions

  • The Federal Reserve Bank of Chicago’s Financial Conditions Index

Fiscal Policy

  • Rasmussen Consumer Sentiment Index, as a proxy for the public’s concern over the looming debates in Congress over the government shutdown(September 30, 2013) and the debt ceiling (mid- to late-October)

2013-09-24_Figure_22013-09-24_Figure_2a

In Figures 1 – 4, we show the recent performance of these important metrics. Inflation remains well below the Fed’s 2% target. Our view is that there are still plenty more factors pushing down on inflation than pushing it up. The next core personal consumption expenditure (PCE) reading (for August 2013) is due out this Friday, September 27, 2013. In Figure 2, we’ve grouped the labor market metrics mentioned by Bernanke into two categories. On the left side of the page are the indicators that Bernanke mentioned as showing some improvement in recent months. The indicators on the right side of the page detail the labor market metrics that have underperformed the Fed’s expectations. While the claims data are released weekly, and the jobs easy-to-get/hard-to-get metric is released along with the consumer confidence data (due out Tuesday, September 24), the market will have to wait until October 4 for the September employment report. With just one more report on the labor market prior to the October 30, 2013 FOMC meeting, it is unlikely that the FOMC would have enough additional evidence that the labor market was improving to take any action on tapering.

Figure 3 does show that financial conditions have tightened since May, and Bernanke’s comments last week suggest that most of this tightening was unwelcome by Fed policymakers. We chose this particular metric (from the Chicago Fed National Financial Conditions Index) to highlight because Bernanke has mentioned it recently, but there are many other measures of financial conditions (St. Louis Fed Financial Stress Index, Senior Loan Officers Survey, and Bloomberg Financial Conditions Index, to name a few) that we and the market will be tracking closely in the weeks ahead. If financial conditions are tighter in late October than they are today, it is unlikely that the Fed would opt to taper at the October 30 FOMC meeting.

2013-09-24_Figure_3

“When the Levee Breaks”

Also arguing against an October taper is the fiscal situation. We chose to use the Rasmussen Consumer Sentiment chart to illustrate consumers’ concerns with the fiscal debate in Congress [Figure 4]. Although this data point is available daily, we chose to present the monthly chart. The chart clearly shows that consumer sentiment has turned lower in recent months, posting back-to-back monthly declines for the first time since mid-2011, the last time the debt ceiling debate dominated the headlines.

2013-09-24_Figue_4

On balance, the FOMC decided at its September 2013 meeting that the weaker-than-expected readings on the economy and inflation, tightening financial conditions (partially as a result of its own communication breakdown with markets since May), and the looming fiscal debate in Congress trumped the trust argument, and chose to maintain the current pace of QE. In our view, Bernanke made a clear case to markets last week that tapering remains data dependent, and he even provided markets with specific metrics the FOMC was watching to gauge progress. One of the key takeaways from last week for markets was Bernanke’s assertion during the Q&A portion of his press conference:

…we can’t let market expectations dictate our policy actions. Our policy actions have to be determined by our best assessment of what’s needed for the economy.

Our view remains that while the Fed may not need the markets’ trust right now, it will down the road as it eventually begins to unwind all the monetary stimulus it has put into the system since 2007.

__________________________________________________________________________________________________________________________________________________________________________________

IMPORTANT DISCLOSURES

The opinions voiced in this material are for general information only and are not intended to provide specific advice or recommendations for any individual. To determine which investment(s) may be appropriate for you, consult your financial advisor prior to investing. All performance reference is historical and is no guarantee of future results. All indices are unmanaged and cannot be invested into directly.

The economic forecasts set forth in the presentation may not develop as predicted and there can be no guarantee that strategies promoted will be successful.

Government bonds and Treasury bills are guaranteed by the U.S. government as to the timely payment of principal and interest and, if held to maturity, offer a fixed rate of return and fixed principal value. However, the value of fund shares is not guaranteed and will fluctuate Mortgage-backed securities are subject to credit, default risk, prepayment risk that acts much like call risk when you get your principal back sooner than the stated maturity, extension risk, the opposite of prepayment risk, and interest rate risk.

Stock investing involves risk including loss of principal.

Quantitative easing (QE) is a government monetary policy occasionally used to increase the money supply by buying government securities or other securities from the market. Quantitative easing increases the money supply by flooding financial institutions with capital in an effort to promote increased lending and liquidity.

The Federal Open Market Committee (FOMC), a committee within the Federal Reserve System, is charged under the United States law with overseeing the nation’s open market operations (i.e., the Fed’s buying and selling of United States Treasure securities).

Gross domestic product (GDP) is the monetary value of all the finished goods and services produced within a country’s borders in a specific time period, though GDP is usually calculated on an annual basis. It includes all of private and public consumption, government outlays, investments and exports less imports that occur within a defined territory.

This research material has been prepared by LPL Financial.

To the extent you are receiving investment advice from a separately registered independent investment advisor, please note that LPL Financial is not an affiliate of and makes no representation with respect to such entity.

Not FDIC/NCUA Insured | Not Bank/Credit Union Guaranteed | May Lose Value | Not Guaranteed by any Government Agency | Not a Bank/Credit Union Deposit

Member FINRA/SIPC

Deficit Distraction
August 27, 2013

Deficit Distraction

In the 12 months ending July 2013, the federal government spent $3.4 trillion and took in $2.7 trillion in revenues, making the federal deficit (revenues less spending) about $725 billion, the smallest deficit recorded since late 2008. At just 3.5%, the deficit as a percent of nominal gross domestic product (GDP) over the past 12 months was also the smallest since late 2008, and stands in sharp contrast to the 10% deficit-to-GDP ratio posted in fiscal year (FY) 2009 ending September 2009 [Figure 1].

2013-08-27_Figure1

The story is much the same fiscal year to date in FY 2013, which ends on September 30, 2013. In the first 10 months of FY 2013, the budget deficit was $607 billion, or roughly 3.6% of GDP. Outlays have totaled $2.9 trillion and revenues have totaled $2.3 trillion. The first 10 months of FY 2013 saw the smallest deficit and deficit to GDP of any comparable period back to the first 10 months of FY 2008. An improved economy, a stronger labor market, spending cuts from sequestration, and recent changes to tax rates account for most of the improvement, although a few “one-time items” have also played a role. The non-partisan Congressional Budget Office (CBO), which produces an excellent update on the progress of the federal budget every month called “Monthly Budget Review” (see http://www.cbo.gov), continues to project that the budget deficit in FY 2013 will total $642 billion, or around 4.0% of GDP.

What’s Driving the Improvement in the Deficit?

Fiscal year to date in 2013, federal revenues are up 14%, while spending is down nearly 4%. Combined individual income tax receipts — which account for around 85% of federal revenues — are up 15% in the first 10 months of FY 2013 versus the same period in FY 2012. Personal income taxes account for roughly 50% of Federal revenues while taxes withheld for Social Security and Medicare account for 35% of federal revenues. A better labor market (2.3 million net new jobs were created over the past 12 months) and rising wages (wage and salary income, as measured by the monthly report on personal income and spending, is up 4% year over year), account for some of the gain. The fiscal cliff — the expiration of the Social Security payroll tax cut in January 2013 and the increase in tax rates for incomes above certain thresholds — have also boosted revenues. The rising equity market has also accounted for some of the gain in individual tax revenues: equity markets hit new all-time highs in the first half of 2013 and investors may set aside tax payments after exercising stock options or selling stocks. Corporate profits are at record levels, and corporate tax receipts are up 17% in the first 10 months of FY 2013 versus the similar period in FY 2012. Corporate tax receipts account for 10 – 15% of federal tax revenues [Figure 2].

2013-08-27_Figure2

At $2.9 trillion, federal budget outlays in the first 10 months of FY 2013 were $90 billion (or 4%) lower than in the same period in 2012. Not surprisingly, given the solid performance of the labor market noted above, federal spending on unemployment benefits was down a whopping 24% in the first 10 months of FY 2013, while defense spending (impacted in part by the sequester) fell 7%. Federal spending activities outside of defense and entitlement programs like Social Security, Medicare, and Medicaid fell 3% in the first 10 months of FY 2013 versus the first 10 months of FY 2012, but that figure is skewed lower by payments received by the federal government from the Troubled Asset Relief Program (TARP) and big payments from the large, quasi-government mortgage giants Fannie Mae and Freddie Mac that were at the center of the financial crisis. Despite the distortions, the sequester is having a modest impact in controlling non-defense discretionary spending. Interest payments on the public debt totaled $216 billion in the first 10 months of FY 2013, down 2% from the $222 billion in the similar period of FY 2012 [Figure 3].

2013-08-27_Figure3

Warning Signs

Some warning signs exist in the otherwise positive budget picture thus far in FY 2013 however, and if these warning signs continue to be ignored by policymakers, the near-term improvement in the budget picture is not likely to last. FY 2013 to date, federal spending on mandatory programs (payments set by formula written into the law) like Social Security, Medicare, and Medicaid is running above the pace of nominal GDP growth. Federal spending on Social Security benefits is up 5.4%, nearly twice the rate of nominal GDP growth over the past year (2.9%). Similarly, spending on Medicare is up 3.0% in the first 10 months of FY 2013, while Medicaid spending is up 5.7%, also about twice the rate of nominal GDP growth. The non-partisan CBO expects the improvement in the federal budget deficit to continue over the rest of this fiscal year, and for the next several fiscal years as well, through FY 2015. By then, the CBO expects the deficit as a percent of GDP to fall to 2.0%, the smallest since the 1.2% deficitto- GDP-ratio recorded in FY 2007, the last fiscal year prior to the Great Recession. From a 2.0% deficit-to-GDP ratio in FY 2015, the CBO projects that under current law, the deficit will increase to 3.2% in FY 2020 and to 3.5% by FY 2023, the last year the CBO makes a projection.

Most of the deficit deterioration in the latter half of this decade and the first half of the next occurs as a result of deterioration in the structural deficit, i.e., spending on mandatory programs like Social Security, Medicare, and Medicaid far outstripping the pace of GDP growth, mainly due to an aging population. The CBO projects that tax receipts targeted for use by those programs will only grow at the same pace as the overall economy over the next 10 years or so. Thus, the risk is that Congress and the general public will be distracted by the rapidly improving near-term budget outlook, and will not address the longer-term structural budget problem quickly enough to head off a worsening, long-term budget deficit.

____________________________________________________________________________________________________________

IMPORTANT DISCLOSURES

The opinions voiced in this material are for general information only and are not intended to provide specific advice or recommendations for any individual. To determine which investment(s) may be appropriate for you, consult your financial advisor prior to investing. All performance reference is historical and is no guarantee of future results. All indices are unmanaged and cannot be invested into directly.

Gross domestic product (GDP) is the monetary value of all the finished goods and services produced within a country’s borders in a specific time period, though GDP is usually calculated on an annual basis. It includes all of private and public consumption, government outlays, investments and exports less imports that occur within a defined territory.

The economic forecasts set forth in the presentation may not develop as predicted and there can be no guarantee that strategies promoted will be successful.

International investing involves special risks, such as currency fluctuation and political instability, and may not be suitable for all investors.

Purchasing Managers Index (PMI) is an indicator of the economic health of the manufacturing sector. The PMI index is based on five major indicators: new orders, inventory levels, production, supplier deliveries and the employment environment.

Markit is a leading, global financial information services company that provides independent data, valuations and trade processing across all asset classes in order to enhance transparency, reduce risk and improve operational efficiency. The Markit Purchasing Managers’ Index (PMIT) is a composite index based on five of the individual indexes with the following weights: New Orders – 0.3, Output – 0.25, Employment – 0.2, Suppliers’ Delivery Times – 0.15, Stocks of Items Purchased – 0.1, with the Delivery Times Index inverted so that it moves in a comparable direction.

The S&P/Case-Shiller U.S. National Home Price Index measures the change in value of the U.S. residential housing market. The S&P/Chase-Shiller U.S. National Home Price Index tracks the growth in value of real estate by following the purchase price and resale value of homes that have undergone a minimum of two arm’s-length transactions. The index is named for its creators, Karl Chase and Robert Shiller.

_____________________________________________________________________________________________________________________________________________________________________________

This research material has been prepared by LPL Financial.

To the extent you are receiving investment advice from a separately registered independent investment advisor, please note that LPL Financial is not an affiliate of and makes no representation with respect to such entity.

Not FDIC/NCUA Insured | Not Bank/Credit Union Guaranteed | May Lose Value | Not Guaranteed by any Government Agency | Not a Bank/Credit Union Deposit

Member FINRA/SIPC

Real and Sustainable: An Update
July 10, 2013

Real and Sustainable: An Update

Just prior to the release of the May 2013 employment, report, we wrote in our June 3, 2013, Weekly Economic Commentary: Real and Sustainable, that in the coming months:

“Federal Reserve (Fed) policymakers must decide if the recent pace of job creation-on average, the economy added 175,000 per month over the past year-and/or the drop in the unemployment rate (from 10.0% at the peak in 2010 and from 8.2% in May 2012) was ‘real and sustainable’ to warrant a tapering of QE.”

“Real and sustainable” was also a phrase used by Fed Chairman Ben Bernanke at his now (in)famous testimony before the Joint Economic Committee (JEC) of Congress on May 22, 2013. Answering a question about when the Fed would begin unwinding QE, Bernanke said:

“As the economic outlook and particularly the outlook for the labor market improves in a real and sustainable way, the committee will gradually reduce the flow of purchases.”

Bernanke used similar words answering questions at the press conference following the June 18 – 19 Federal Open Market Committee (FOMC) meeting.

Now, with both the May and June 2013 jobs reports, as well as the June FOMC Meeting and Fed Chairman Bernanke’s press conference in the rearview mirror, financial markets have largely embraced the notion that the Fed will begin tapering QE sometime this fall. Payroll employment in the private sector in both May and June 2013 exceeded expectations, and the job gains reported for April 2013 and May 2013 were revised markedly higher with the release of the June 2013 data. As a result, the private sector economy has added about 200,000 net new jobs per month over the past three, six, and 12 months [Figure 1]. It is pretty clear that the market, especially the bond market, thinks that adding 200,000 jobs per month is “real and sustainable.”

2013-07-10_Fig_1

Of course, Fed policymakers are not only looking at the number of private sector jobs being created each month. In early March 2013, FOMC Vice Chair Janet Yellen — who is a leading candidate to replace Bernanke as Fed Chairman in 2014 — said that she was looking at a number of indicators on the labor market and economy. These included:

  • The unemployment rate;
  • Payroll employment;
  • The hiring rate;
  • Layoffs/discharges as a share of total job separations;
  • ƒƒ The “quit” rate as a share of total job separations; and
  • Spending and growth in the economy.

Tracking the Labor Market: Not Quite There Yet

Figures 2 – 5 show the labor market indicators mentioned by Bernanke last week and Yellen in early March 2013. A quick review of the figures suggests that while job growth has been “real and sustainable,” several of the other key measures the Fed is monitoring are not yet sending the same signal. Yellen and Bernanke — two of the three FOMC members of the “center of gravity” at the Fed — are probably not yet ready to begin scaling back QE.

2013-07-10_Fig_2

  • While down from the peaks seen during the Great Recession of 2008 – 2009, the unemployment rate, at 7.6% in June 2013, remains well above the 6.5% threshold for raising rates, and also well above the 5.50 – 5.75% rate the FOMC forecasts as the new “normal” unemployment rate. In his prepared comments to the press just prior to his FOMC press conference on June 19, 2013, Bernanke said that QE would likely end in mid-2014, when the unemployment rate hits 7.0%.
  • The economy is now consistently creating 200,000 jobs per month, and has been over the past 12 months.

2013-07-10_Fig_3

  • At 3.6% in April 2013, the latest data available, the hiring rate — the level of new hiring as a percent of total employment measured from the Job Openings and Labor Turnover Survey (JOLTS) data remains depressed, and well below the 4.5 – 5.0% hire rate seen prior to the onset of the Great Recession in 2007. In her March 4, 2013 speech, Yellen noted, “the hiring rate remains depressed. Therefore, going forward, I would look for an increase in the rate of hiring.” The May JOLTS report is due out this Tuesday, July 9, 2013.
  • In that same speech, Yellen noted “layoffs and discharges as a share of total employment have already returned to their pre-recession level”. Indeed, Figure 4 shows that the discharge rate, at 1.2% in April 2013, is very close to an all-time low. A good proxy for this metric is the weekly readings on initial claims for unemployment insurance and the monthly Challenger layoff data, both of which continue to show that companies are reluctant to shed more workers at this point in the business cycle.

2013-07-10_Fig_4

2013-07-10_Fig_5

  • The quit rate measures the percentage of people who leave their jobs voluntarily, presumably because they are confident enough in their own skills — or in the health of the economy — to find another job. In the three months ending in April 2013 (the latest data available), 53% of the people who were separated from their jobs (laid off, fired, retired, or left voluntarily) were job quitters. This reading was just below the 54% readings in February and March 2013, which were the highest readings on this metric since mid- 2008. Even at 54%, this metric remains well below its pre-Great Recession norm of 56 – 60%. Commenting on this metric in her March 4, 2013 speech,  Yellen noted “a pickup in the quit rate, which also remains at a low level, would signal that workers perceive that their chances to be rehired are good — in other words, that labor demand has strengthened.”

2013-07-10_Fig_6

  • The final metrics mentioned by Yellen — consumer spending and overall economic growth — both remain well below average, and indeed still point to an economy that is still running at around two-thirds speed.

GDP and Jobs: Why the Disconnect?

Since the end of the 1981-82 recession, the economy has seen four periods when it has consistently created 200,000 or more private sector jobs per month:

  • Mid-1980s
  • Late 1980s
  • ƒƒ Mid-1990s through the end of the decade
  • ƒƒ Early 2006

On average, when the economy has consistently produced 200,000 jobs over a 12-month period, economic growth — as measured by growth in real gross domestic product (GDP) — has averaged between 4.5% and 5.0%. Today, the economy is struggling to grow at 2.0%, and our forecast is that growth is likely to be near 2.0% over the rest of 2013. What has caused the disconnect between job and GDP growth, and does better job growth mean better economic growth in the period ahead?

In general, the economy leads job growth, not the other way around. The timing of the economic recoveries and labor market recoveries over the past 20 years is helpful in illustrating this point. Coming out of the 2007 – 2009 Great Recession, the economy bottomed out in June 2009, while the labor market did not begin creating jobs regularly until spring 2010. The same pattern played out coming out of the mild recession in 2001. The recession ended in November 2001, but the economy did not begin to consistently create jobs until the summer of 2003. The 1990 – 91 recession ended in March 1991. The private sector economy did not begin creating jobs regularly until a year later, in the spring of 1992.

The recent disconnect between private sector job growth and the performance of the economy can be partially traced to several factors. First, the severity and composition of the Great Recession was unique in its scope, and recent financial-led recessions in other countries suggest that economies recover more slowly from recessions caused by severe financial crisis. Restrictive fiscal policy at both the federal and state and local levels is also a culprit of the disconnect between 200,000 per month job growth and an economy growing at only around 2.0%. In the first half of 2013, the economic drag from fiscal policy (less spending and higher taxes) likely shaved around 2.0% from GDP. In addition, the recession in Europe and the sharp slowdown in emerging markets have sharply curtailed our export growth, which in turn, puts downward pressure on GDP growth.

The bottom line is that job creation tends to lag the overall economy, and that the recent job gains likely do not portend stronger economic growth in the coming months. Any uptick in economic growth over the next few quarters would likely be the result of an easing of fiscal pressures or improvement in the economies in Europe and emerging market countries.

2013-07-10_Fig_7

Closer Look: Labor Market Surveys

  • A survey of 60,000 households nationwide — an incredibly large sample size for a national survey — generates the data set used to calculate the unemployment rate, the size of the labor force, part-time and full-time employment, the reasons for and duration of unemployment, employment status by age, educational attainment, and race. The “household survey” has been conducted essentially same way since 1940, and although it has been “modified” over the years, the basic framework of the data set has stayed the same. The last major modification to the data set (and to how the data is collected) came in 1994. To put a sample size of 60,000 households into perspective, nationwide polling firms typically poll around 1,000 people for their opinion on presidential races.
  • ƒƒThe headline unemployment rate (7.6% in June 2013) is calculated by dividing the number of unemployed (11.8 million in June 2013) by the number of people in the labor force (155.8 million). The civilian population over the age of 16 stood at 245.5 million in June 2013. A person is identified as being part of the labor force if they are over 16, have a job (employed), or do not have a job (unemployed) but are actively looking for work. A person is not in the labor force if they are neither employed nor unemployed. This category includes retired persons, students, those taking care of children or other family members, and others who are neither working nor seeking work.
  • ƒƒ In June 2013, the labor force was 155.8 million, which consists of 144 million  employed people and 11.8 million unemployed people. Another 89.7 million people over the age of 16 were classified as not in the labor force. The 155.8 million people in the labor force plus the 89.7 million people not in the labor force is equal to the civilian population over 16, 245.5 million.
  • The payroll job count data is culled from a survey of 440,000 business establishments across the country. The sample includes about 141,000 businesses and government agencies, which cover approximately 486,000 individual worksites drawn from a sampling frame of Unemployment Insurance (UI) tax accounts covering roughly 9 million establishments. The sample includes approximately one-third of all nonfarm payroll employees. From these data, a large number of employment, hours, and earnings series in considerable industry and geographic detail are prepared and published each month.

___________________________________________________________________________________

IMPORTANT DISCLOSURES
The opinions voiced in this material are for general information only and are not intended to provide specific advice or recommendations for any individual. To determine which investment(s) may be appropriate for you, consult your financial advisor prior to investing. All performance reference is historical and is no guarantee of future results. All indices are unmanaged and cannot be invested into directly.

Gross domestic product (GDP) is the monetary value of all the finished goods and services produced within a country’s borders in a specific time period, though GDP is usually calculated on an annual basis. It includes all of private and public consumption, government outlays, investments and exports less imports that occur within a defined territory.

The economic forecasts set forth in the presentation may not develop as predicted and there can be no guarantee that strategies promoted will be successful.

Stock investing involves risk including loss of principal.
The Federal Open Market Committee (FOMC), a committee within the Federal Reserve System, is charged under the United States law with overseeing the nation’s open market operations (i.e., the Fed’s buying and selling of United States Treasure securities).

Quantitative easing is a government monetary policy occasionally used to increase the money supply by buying government securities or other securities from the market. Quantitative easing increases the money supply by flooding financial institutions with capital in an effort to promote increased lending and liquidity.

___________________________________________________________________________________

This research material has been prepared by LPL Financial.

To the extent you are receiving investment advice from a separately registered independent investment advisor, please note that LPL Financial is not an affiliate of and makes no representation with respect to such entity.

Not FDIC/NCUA Insured | Not Bank/Credit Union Guaranteed | May Lose Value | Not Guaranteed by any Government Agency | Not a Bank/Credit Union Deposit

Member FINRA/SIPC

Sizzling Summer Fed FAQ
June 18, 2013

What Is the Schedule of Events for the Fed This Week?

The Federal Reserve (Fed) holds its fourth (of eight this year) Federal Open Market Committee (FOMC) meeting this Tuesday and Wednesday, June 18 – 19. The meeting will be followed by an FOMC statement, and the FOMC’s latest economic and Fed funds projections at 2 PM ET. Fed Chairman Ben Bernanke’s second (of four) press conference of 2013 begins at 2:30 PM ET.

Will the Fed Raise Rates at This Meeting?

Since mid-May 2013, the market has moved up the date of the first Fed rate hike from late 2015/early 2016 to early 2015. In our view, the Fed is likely to keep rates lower for longer than the market now anticipates. This should help keep a lid on longer-term interest rates, such as the 10-year Treasury, and on instruments like mortgage rates, which are closely tied to the yield on Treasuries.

1st_Fed_Interest_Rate_Increase

If the Fed Is Tapering Quantitative Easing (QE), Is It Tightening Monetary Policy?

No. As long as the Fed’s balance sheet is expanding, the Fed is easing monetary policy. In late 2010, President of the New York Fed William Dudley suggested in a speech that: “…$500 billion of purchases would provide about as much stimulus as a reduction in the federal funds rate of between half a point and three quarters of a point (50 to 75 basis points). “So, at $85 billion a month, the Fed is doing the equivalent of cutting the Fed funds rate (which has been near zero since late 2008) by 10 basis points per month. Even if the FOMC were to decide to taper purchases to $40 – $45 billion per month, it would still be “cutting” the Fed funds rate by around 5 basis points per month.

Fed_QE_Purchases

Will the Fed Act to Calm Financial Markets, Especially the Bond Market?

Since Ben Bernanke’s testimony to the Joint Economic Committee(JEC) of Congress on May 22, 2013, volatility has moved higher in financial markets. Bernanke’s appearance at the JEC, and especially the question and answer portion of the testimony suggested to the market that the FOMC was preparing to begin scaling back its purchases of Treasuries and mortgage backed securities (MBS). Prior to the testimony, markets generally thought that the FOMC would purchase $85 billion per month of Treasuries and MBS through at least the end of 2013. Since the JEC testimony, markets have begun to question that timing and are now expecting the Fed to begin tapering its purchases in September 2013. In our view, the decision for the Fed to continue with the current pace of QE is data dependent. Based on our forecast for the labor market, inflation, and the economy, the Fed is likely to continue its bond purchases through at least September 2013. At that time, the Fed may “test” run a temporary tapering with markets….

When Will the Fed Stop QE?

Even if the Fed does signal that it is prepared to begin tapering its purchases of Treasuries and MBS, it will, in our view, likely continue to pursue QE for some time, and perhaps until the end of 2014. While the Fed has provided “thresholds” for when it would consider raising its Fed funds rate: “… (low rates) will be appropriate at least as long as the unemployment rate remains above 6-1/2 percent, inflation between one and two years ahead is projected to be no more than a half percentage point above the Committee’s 2 percent longer-run goal, and longer-term inflation expectations continue to be well anchored.” it has stopped short of providing specific thresholds for ending QE. Instead, the Fed has said: “The Committee will continue its purchases of Treasury and agency mortgage-backed securities, and employ its other policy tools as appropriate, until the outlook for the labor market has improved substantially in a context of price stability.”

Fig_1_6-18-2013

Can Congress Make the Fed Stop Quantitative Easing?

Yes. Congress, can, at any time, vote to take away or restrict the Fed’s dual mandate to: “…maintain long run growth of the monetary and credit aggregates commensurate with the economy’s long run potential to increase production, so as to promote effectively the goals of maximum employment, stable prices and moderate long-term interest rates.” There are many voices in Congress — especially in the House — that are unhappy with the Fed’s pursuit of QE, and legislation has been introduced in both houses of Congress over the past several years that would limit the Fed’s mandate. It is highly unlikely that such legislation would pass the Senate in the current session of Congress.

What Is the Fed’s Number on the Labor Market?

The QE debate among market participants — and likely among Fed policymakers as well — centers around the labor market and whether or not it has seen “real and sustainable” improvement. Over the past year, the U.S. economy has consistently created around 175,000 net new jobs per month. Some Fed policymakers have hinted that 150,000 jobs per month is the best the economy can do, and any job growth stronger than that could trigger inflation. Other Fed policymakers have suggested that 200,000 jobs per month is the right number to target, and that the Fed still has some work to do to get there. For some, 175,000 net new jobs per month could be the right number. Markets have their own view of what the “right number” is too. However, market participants looking for the FOMC to provide a specific target on job creation may be disappointed this week.

Labor

How Has the Labor Market Performed Since the Last FOMC Meeting in May 2013?

The FOMC has seen two jobs reports since the last FOMC meeting on May 1, 2013. The May 1, 2013 FOMC meeting was held a few days before the release of the April 2013 employment report. The May 2013 employment report was released on June 7, 2013. The April 2013 employment report showed that the economy created 165,000 jobs in April — far more than the 140,000 expected. The May 2013 employment report revealed that the economy added 175,000 jobs in May, in line with expectations and that the job counts over the prior two months were revised downward by a total of 12,000. The unemployment rate was 7.5% in April 2013 and 7.6% in May 2013. Several other labor market metrics the Fed is known to be watching (see our Weekly Economic Commentary: Watch What the Fed Watches, March 25, 2013, for more details)have been mixed at best since the last FOMC meeting. In our view, the labor market is improving, but the recent pace of job creation (around 175,000 per month) seems likely to persist until the economy can grow more robustly than 2.0% to 2.5%.

Fig_2_6-18-2013

Isn’t the FOMC Worried About Inflation Anymore?

As has been the case since Congress amended the Federal Reserve Act to grant the Fed’s dual mandate (see above), the FOMC’s job has been to promote full employment and stable prices. In recent years, the FOMC has been much more concerned with deflation — a prolonged period of falling wages and prices — than it has been about inflation. Recent readings on the Fed’s preferred measure of inflation, the personal consumption deflator excluding food and energy (core PCE deflator), have been decelerating. In March 2012, the year-over-year reading on the Fed’s preferred measure of inflation was 2.0%. The latest reading (April 2013) shows that core inflation is now at 1.0%, which matches the lowest reading ever in the 53+ year history of the data series. In our view, there are still more factors pushing down on inflation than pushing up on inflation (see the Weekly Economic Commentary from March 18, 2013 for more details) and the Fed’s primary focus right now is on the other side of its dual mandate.

____________________________________________________________________________________________________________________________________

IMPORTANT DISCLOSURES
The opinions voiced in this material are for general information only and are not intended to provide specific advice or recommendations for any individual. To determine which investment(s) may be appropriate for you, consult your financial advisor prior t0 investing. All performance reference is historical and is no guarantee of future results. All indices are unmanaged and cannot be invested into directly.

The economic forecasts set forth in the presentation may not develop as predicted and there can be no guarantee that strategies promoted will be successful.

Gross domestic product (GDP) is the monetary value of all the finished goods and services produced within a country’s borders in a specific time period, though GDP is usually calculated on an annual basis. It includes all of private and public consumption, government outlays, investments and exports less imports that occur within a defined territory.

Government bonds and Treasury Bills are guaranteed by the U.S. government as to the timely payment of principal and interest and, if held to maturity, offer a fixed rate of return and fixed principal value. However, the value of fund shares is not guaranteed and will fluctuate.

Mortgage-Backed Securities are subject to credit, default risk, prepayment risk that acts much like call risk when you get your principal back sooner than the stated maturity, extension risk, the opposite of prepayment risk, and interest rate risk.

Stock investing involves risk including loss of principal.

Federal Funds Rate is the interest rate at which depository institutions actively trade balances held at the Federal Reserve, called federal funds, with each other, usually overnight, on an uncollateralized basis.

The Federal Open Market Committee (FOMC), a committee within the Federal Reserve System, is charged under the United States law with overseeing the nation’s open market operations (i.e., the Fed’s buying and selling of United States Treasure securities).

Quantitative easing (QE) is a government monetary policy occasionally used to increase the money supply by buying government securities or other securities from the market. Quantitative easing increases the money supply by flooding financial institutions with capital in an effort to promote increased lending and liquidity.

___________________________________________________________________________________________________________________________________

INDEX DESCRIPTIONS

The “core” PCE price index is defined as personal consumption expenditures (PCE) prices excluding food and energy prices. The core PCE price index measures the prices paid by consumers for goods and services without the volatility caused by movements in food and energy prices to reveal underlying inflation trends.

Purchasing Managers’ Index (PMI) is an indicator of the economic health of the manufacturing sector. The PMI index is based on five major indicators: new orders, inventory levels, production, supplier deliveries and the employment environment.

________________________________________________________________________________________________________________________________

This research material has been prepared by LPL Financial. To the extent you are receiving investment advice from a separately registered independent investment advisor, please note that LPL Financial is not an affiliate of and makes no representation with respect to such entity.

Not FDIC/NCUA Insured | Not Bank/Credit Union Guaranteed | May Lose Value | Not Guaranteed by any Government Agency | Not a Bank/Credit Union Deposit

Member FINRA/SIPC

Tapering Tantrum Take Two
May 28, 2013

The bond market suffered through another week of tapering tantrums with yields closing higher for a fourth consecutive week and near the highs of 2013. Federal Reserve (Fed) Chairman Ben Bernanke did little to clear the uncertainty over the timing of reducing, or tapering, bond purchases in Congressional testimony last week. Although his prepared testimony was very dovish and suggested a continuation of current bond purchases, investors focused on responses in the question and answer portion of his testimony, which fueled additional uncertainty. Bernanke suggested that tapering could begin “in the next few meetings” if labor market data continued to improve, and when asked whether the Fed may taper purchases before Labor Day, Bernanke said he did not know and that it depended on the economic data. Bernanke’s comments echoed those of the normally dovish Bill Dudley, the influential New York Fed President, who also seemed to acknowledge there is ongoing debate among Fed members about when to taper bond purchases.

The response from financial markets, as is typically the case when investors are presented with uncertainty, was lower prices and bonds, across the board, were not spared. Treasury yields continued their ascent, with the 10-year Treasury breaching the 2% yield barrier before closing the week at 2.01%, just below the 2.06% peak of 2013.

The response from financial markets, as is typically the case when investors are presented with uncertainty, was lower prices and bonds, across the board, were not spared. Treasury yields continued their ascent, with the 10-year Treasury breaching the 2% yield barrier before closing the week at 2.01%, just below the 2.06% peak of 2013.

Unlike prior rounds of bond purchases, such as QE1 and QE2, which were marked by specific end dates, QE3 is open-ended and allows for a reduction in the pace of purchases. This presents a new twist for the bond market, and pushing yields higher appeared to be a precautionary move by investors. However, the bond market is adapting quickly. Primary dealers, financial firms that are required to make markets in all Treasury securities, began to move their forecasts for timing QE tapering to the September 2013 Fed meeting, up from a prior consensus of the December 2013 Fed meeting.

A press conference follows the September 2013 Fed meeting and would allow the Fed Chairman to explain the rationale for tapering purchases. A press conference also follows the June 2013 Fed meeting, but it appears unlikely the Fed will move that soon, given the benign remarks in Bernanke’s testimony and the relatively dovish tone of meeting minutes from the May 1, 2013 Fed meeting. Should the Fed announce that tapering will begin at the end of June or in July, bond prices may decline further, and yields may rise more since the bond market has not fully priced in that outcome.

Uncertainty is likely to linger for at least another week and may exert additional upward pressure on bond yields. The current week is very light on economic data, and there are few Fed speakers of note. Investors will likely have to wait until the May 2013 employment report, which will be released on Friday, June 7, 2013, to receive additional clarity. The Fed is clearly focused on labor market gains regarding when to begin tapering bond purchases.

The past week’s events suggest the Fed appears to be focusing more on labor market improvements rather than the lower inflation witnessed so far in 2013, as measured by both the core Consumer Price Index (CPI) and core Consumer Personal Expenditures Index, which may decelerate to a record 1.0% when personal income data for April are released Friday, May 31, 2013, according to the Bloomberg consensus forecast.

We do not expect the Fed to announce a tapering of bond purchases at the June 2013 Fed meeting and therefore expect any additional rise in rates to be limited. Still-high long-term valuations suggest that Treasury weakness could continue. The sooner the Fed begins to reduce bond purchases and the more quickly bond purchases come to an ultimate end, the more rapid the potential rise in bond yields. Nonetheless, we expect the Fed to take a gradualist approach. The following factors also suggest that any rise in rates may also be limited.

  • A change in the relationship between economic data and bond yields. Recent economic data have frequently failed to meet consensus forecasts, as reflected by the Citigroup Economic Surprise Index [Figure 1]. The strength of the economy can be an important driver of bond yields. Note the close relationship between Treasury yields and whether economic data is surprising higher or lower over the years. A gap developed between the two series starting in 2011, due to the Fed’s extraordinary measures (e.g., its commitment to refrain from raising interest rates for a specified period of time), but directionally the pace of economic data is still evident as a driver of Treasury yields. Recently, the relationship between Treasury yields and economic data changed as bond investors have focused on tapering. We do not believe this change will last long and the bond market will refocus on economic data, which in our view is still too sluggish to reflect sharply lower bond prices and higher yields.

Figure_1

  • The Fed remains on hold. Fed interest rate hikes, or cuts, have been one of the key drivers of bond yields. Without an actual rate hike, the increase to short and intermediate yields in particular may be limited.
  • A tapering does not mean an end to easing. Even in the event of a tapering, the Fed will still be providing stimulus, and downward pressure on interest rates, by continuing bond purchases even if at a reduced rate.
  • Prior QE conclusions resulted in lower Treasury yields. Bond yields actually declined following the end of prior QE bond purchases [Figure 2]. Investors feared an economic slowdown absent the Fed’s stimulus, and stocks and high-yield bond prices declined while Treasury prices gained.

Figure_2

Should the rise in bond yields continue without corroboration by weaker economic data or additional clues that the Fed may reduce bond purchases as early as June 2013, a buying opportunity may emerge among high-quality bonds. In the meantime, the cautionary bond market tone may persist over the short term.

___________________________________________________________________________________________________________________________________________

IMPORTANT DISCLOSURES
The opinions voiced in this material are for general information only and are not intended to provide specific advice or recommendations for any individual. To determine which investment(s) may be appropriate for you, consult your financial advisor prior to investing. All performance referenced is historical and is no guarantee of future results. All indexes are unmanaged and cannot be invested into directly.

The economic forecasts set forth in the presentation may not develop as predicted and there can be no guarantee that strategies promoted will be successful.

Yield is the income return on an investment. This refers to the interest or dividends received from a security and is usually expressed annually as a percentage based on the investment’s cost, its current market value or its face value.

Bonds are subject to market and interest rate risk if sold prior to maturity. Bond values and yields will decline as interest rates rise, and bonds are subject to availability and change in price.

Bonds given an investment grade rating indicate a relatively low risk of default.

High-yield/junk bonds are not investment-grade securities, involve substantial risks, and generally should be part of the diversified portfolio of sophisticated investors.

Government bonds and Treasury bills are guaranteed by the U.S. government as to the timely payment of principal and interest and, if held to maturity, offer a fixed rate of return and fixed principal value. However, the value of fund shares is not guaranteed and will fluctuate.

Intermediate bonds are characterized by a maturity that is set to occur in the next three to 10 years.

Treasuries are marketable, fixed-interest U.S. government debt securities. Treasury bonds make interest payments semi-annually, and the income that holders receive is only taxed at the federal level.

Quantitative easing is a government monetary policy occasionally used to increase the money supply by buying government securities or other securities from the market. Quantitative easing increases the money supply by flooding financial institutions with capital in an effort to promote increased lending and liquidity.

This information is not intended to be a substitute for specific individualized tax, legal or investment planning advice. We suggest that you discuss your specific tax issues with a qualified tax advisor.

_____________________________________________________________________________________________________________________________________________

INDEX DESCRIPTIONS
Personal Consumption Expenditures is the measure of price changes in consumer goods and services. Personal consumption expenditures consist of the actual and imputed expenditures of households; the measure includes data pertaining to durables, non-durables and services. It is essentially a measure of goods and services targeted toward individuals and consumed by individuals.

Citigroup Economic Surprise Index (CESI) measures the variation in the gap between the expectations and the real economic data. This research material has been prepared by LPL Financial.

The Consumer Price Index (CPI) is a measure of the average change over time in the prices paid by urban consumers for a market basket of consumer goods and services.

______________________________________________________________________________________________________________________________________________

This research material has been prepared by LPL Financial.

To the extent you are receiving investment advice from a separately registered independent investment advisor, please note that LPL Financial is
not an affiliate of and makes no representation with respect to such entity.

Not FDIC/NCUA Insured | Not Bank/Credit Union Guaranteed | May Lose Value | Not Guaranteed by any Government Agency | Not a Bank/Credit Union Deposit

What’s Broken in Europe?
May 21, 2013

Last week (May 13 – 17), markets digested reports on gross domestic product (GDP) growth in the Eurozone during the first quarter of 2013 (please see “The Big Picture” for details about the Eurozone’s structure). Overall real GDP in the Eurozone contracted by 0.2% in the first quarter of 2013, following the 0.6% drop in the fourth quarter of 2012. The Eurozone’s economic contraction in the first quarter of 2013 was its sixth consecutive quarter of decline, dating back to the fourth quarter of 2011. Among the larger economies in Europe, only Germany (+0.1%) and Belgium (+0.1%) saw first quarter 2013 gains in their economies, while Austria’s GDP was unchanged between the fourth quarter of 2012 and the first quarter of 2013. France (-0.2%), Italy (-0.5%), Spain (-0.5%), and the Netherlands (-0.1%) all saw their economies contract in the first quarter of 2013.

Among the smaller economies on the Eurozone’s periphery, the news was just as bad, but the string of weak GDP readings extends back much further. Real GDP in Greece declined 0.6% in the first quarter of 2013, marking the 13th consecutive quarter of contraction. Greece’s economy has now contracted in 20 of the past 23 quarters since mid-2007. Over that time, the Greek economy has shrunk by 23%. Real GDP in Portugal contracted by 0.3% in the first quarter of 2013, marking the 10th consecutive quarterly decline. Ireland’s GDP fell just 0.1% in the first quarter of 2013, and it has managed just three quarters of growth since late 2010.

Looking ahead, financial markets seem to suggest that the double-dip recession in Europe — recession in 2008 and 2009, a modest, halting recovery in 2010 and early 2011, followed by another recession since mid-2011 — may be ending, and that the Eurozone economy may eke out small gains in the second half of 2013. The consensus of economists (as compiled by Bloomberg News) sees real GDP in the Eurozone contracting in both the second and third quarters of 2013, before a modest upswing begins in late 2013. Our view remains that the Eurozone is likely to be in a recession throughout 2013, despite the best efforts of the ECB and other policymakers.

Figure_1

The Fix? Some Keys to Help Strengthen Eurozone Economic Growth

As we have noted in prior publications, there are several keys to help strengthen economic growth in the Eurozone, including, but not limited to:

  • ƒ Fixing Europe’s broken financial transmission mechanism;
  • ƒ Broad-based labor market reforms;
  • ƒ European-wide banking reform (including a pan-European deposit insurance scheme); and
  • ƒ Financial sector reforms.

In our view, fixing Europe’s broken financial transmission mechanism should be at the top of European policymakers’ long list of “to dos.” The ECB, like almost every other major central bank around the globe, has lowered the rate at which banks can borrow from the ECB, expanded the ECB’s balance sheet to purchase securities in the open market (QE), and tried to encourage banks and other financial institutions to lend, and businesses and consumers in Europe to borrow. The results, however, have not (as yet) had the intended effect: to get badly needed credit (in the form of loans) into the European economy, and especially to the consumer and small businesses. In short, the mechanism that allows credit to flow from the ECB, to banks and financial institutions, and finally to businesses and consumers was badly damaged in the Great Recession and its aftermath.

Major European-based global corporations are benefitting from the ECB’s actions, and are taking advantage of low borrowing costs and relatively healthy — although not quite back to normal — European capital markets to issue debt and fund operations. While credit via traditional credit markets is flowing to large, global corporations in Europe, credit to SMEs, is severely restricted dampening economic activity.

How European Banks Can Help

As in the United States, most SMEs in Europe cannot borrow in the capital markets, so they rely on bank loans, and other types of bank-based funding for working capital and cash to expand existing business. This is especially true in countries at the periphery of Europe, like Greece, Portugal, Cyprus, and increasingly in core European nations like Spain and Italy. The problem is that the main conduits of the ECB’s low rates and QE policies are European banks, which:

  • ƒ Are undercapitalized;
  • ƒ Are reluctant to lend;
  • ƒ Are losing deposits;
  • ƒ Lack regulatory clarity; and
  • ƒ Have impaired balance sheets.

Therefore, European banks are not lending, or more precisely, not lending enough.

Figure 1 shows the breakdown in the financial transmission mechanism in Europe. Money supply growth (a decent proxy for the ECB’s actions to pump liquidity into the system) is running at around 2 – 3% year over year. Not robust growth, but enough to foster some lending by financial institutions. The other line on Figure 1 shows that despite the 2 – 3% growth in money supply in Europe, loans by financial institutions in Europe to private sector borrowers (SMEs and consumers) have turned negative. Therefore, credit to two key components of the Eurozone economy is contracting. The gap between these two lines is a good proxy for the broken financial transmission mechanism in Europe.

A quick look at Figure 2, which shows similar U.S. metrics (M2: money supply and bank lending), reveals that the financial transmission mechanism — while not quite back to normal — is functioning a lot better than Europe’s. M2 growth is running at around 7% year over year, while bank lending to businesses is running close to 10% year over year.

Figure_2

How the ECB and Policymakers Can Help

What would help to repair Europe’s broken transmission mechanism, and in turn, help to boost economic growth in the Eurozone? One way would be if the ECB was willing to take some credit risk on their balance sheet, and take an approach similar to the Bank of England’s (BOE) “credit easing” program. The BOE announced in late 2011 and mid-2012 that it would provide cheap loans and loan guarantees to the banking system to encourage the banks to lend more. Or, the ECB could decide to make loans directly to SMEs, essentially bypassing the broken European financial mechanism. Such a move by the ECB, of course, remains difficult — although not impossible — to achieve, given the fractured state of banking regulation in Europe and reluctance by key constituencies within the Eurozone to expand the ECB’s mandate. The bottom line is that until the ECB (or other policymakers) can agree on a plan to get more credit to capital-starved SMEs and consumers in Europe, we don’t think a meaningful recovery in Europe’s economy is in the cards.

The_Big_Picture

________________________________________________________________________________________________________________________

IMPORTANT DISCLOSURES
The opinions voiced in this material are for general information only and are not intended to provide specific advice or recommendations for any individual. To determine which investment(s) may be appropriate for you, consult your financial advisor prior to investing. All performance reference is historical and is no guarantee of future results. All indices are unmanaged and cannot be invested into directly.

Gross domestic product (GDP) is the monetary value of all the finished goods and services produced within a country’s borders in a specific time period, though GDP is usually calculated on an annual basis. It includes all of private and public consumption, government outlays, investments and exports less imports that occur within a defined territory.

The economic forecasts set forth in the presentation may not develop as predicted and there can be no guarantee that strategies promoted will be successful.

Stock investing involves risk including loss of principal.

Quantitative easing is a government monetary policy occasionally used to increase the money supply by buying government securities or other securities from the market. Quantitative easing increases the money supply by flooding financial institutions with capital in an effort to promote increased lending and liquidity.

________________________________________________________________________________________________________________________

INDEX DESCRIPTIONS
Purchasing Managers’ Index (PMI) is an indicator of the economic health of the manufacturing sector. The PMI index is based on five major indicators: new orders, inventory levels, production, supplier deliveries and the employment environment.

________________________________________________________________________________________________________________________

This research material has been prepared by LPL Financial.

To the extent you are receiving investment advice from a separately registered independent investment advisor, please note that LPL Financial is
not an affiliate of and makes no representation with respect to such entity.

Not FDIC/NCUA Insured | Not Bank/Credit Union Guaranteed | May Lose Value | Not Guaranteed by any Government Agency | Not a Bank/Credit Union Deposit

Watch What the Fed Watches
March 26, 2013

What constitutes a substantial improvement in the labor market?

On Wednesday, March 20, 2013,  Federal  Reserve (Fed) Chairman  Ben Bernanke held the first of four press conferences scheduled for this year at the conclusion of the Federal  Open  Market  Committee’s (FOMC) meetings on March 20, June 19, September 18, and December 18, 2013.  While Bernanke’s Q&A session generated plenty of headlines (and tweets), he really did not say anything the market did not already know about  the Fed’s

view on the economy, the fiscal situation, and more  importantly, on monetary policy, and in particular,  the latest round of bond purchases, quantitative easing (QE3).

Unemployment_Rate_Remains_-_Figure_1

Bernanke did, however, remind market participants of both the benefits:

  • “…putting downward pressure on longer-term interest rates, including mortgage rates” which continues “to provide meaningful support to economic growth and job creation…”

and the costs:

  • “adverse implications of additional purchases for the functioning of securities markets…”
  • “…the potential effects — under  various scenarios — of a larger balance sheet on the Federal  Reserve’s earnings from its asset holdings and, hence, on its remittances to the Treasury.”
  • ”…risks to financial stability, such as might arise if persistently low rates lead some market participants to take on excessive risk in a reach  for yield.”

of continuing QE3. In his prepared remarks just prior to answering reporters’ questions, Bernanke also made a point of reminding markets that the thresholds the Fed has set up for eventually raising rates — unemployment rate below 6.5% and inflation not higher than 2.5% — were not triggers, suggesting that the Fed may wait a while after these thresholds are crossed before raising rates.

What_the_Fed_Says

The first question asked of Bernanke was whether or not the FOMC had spent any time discussing thresholds for ending or changing the pace  of QE3. Bernanke noted that the problem was “complex” but that the FOMC was:

...looking for sustained improvement in a range of key labor market indicators, including obviously payrolls, unemployment rate, but also others like the hiring rate, the claims for unemployment insurance, quit rates,  wage rates,  and so on. We’re looking for sustained improvement across a range of indicators and in a way that’s taking place throughout the economy. And since we’re looking at the outlook, we’re looking at the prospects rather than the current state of the labor market, we’ ll also be looking at things like growth to try to understand whether there’s sufficient momentum in the economy to provide demand for labor going forward.”

The_Private_Sector_-_Figure_2

The list of labor market indicators mentioned by Bernanke was basically the same list cited by Fed Vice Chairwoman Janet Yellen — who is a leading candidate to replace Bernanke when his term  as Chairman  ends on January 31, 2014 — in a speech she gave in early March 2013 to the National Association of Business Economists in Washington, D.C. Yellen’s list included:

  • The unemployment rate;
  • Payroll employment;
  • The hiring rate;
  • Layoffs/discharges as a share of total job separations;
  • The “quit” rate as a share of total job separations; and
  • Spending and growth in the economy. Yellen noted specifically that:

I also intend to consider my forecast of the overall pace of when it is not accompanied by sufficiently strong growth, may not indicate a substantial improvement in the labor market outlook. Similarly, a convincing pickup in growth that is expected to be sustained could prompt a determination that the outlook for the labor market had substantially improved even absent any substantial decline at that point in the unemployment rate.”

Companies_Are_Reluctant_-_Figure_3

Essentially, Yellen (who along with being one of the leading candidates to replace Bernanke as Fed chairman, is also at the Fed’s “center of gravity,”

with Bernanke and New York Fed President Bill Dudley) is saying that the

FOMC will need to see strong performance of the labor market AND solid gross domestic product (GDP) growth before it begins to scale back or eliminate QE.

Figures 1 – 5 show the labor market indicators mentioned by Bernanke last week and Yellen in early March.  A quick review of the figures suggests that Yellen and Bernanke — two of the three FOMC members of the “center of gravity” at the Fed — are not yet ready to begin scaling back QE.

LPL_Weekly_Calendar

  • While down  from the peaks seen during the Great Recession of 2008 – 2009,  at 7.8%, the unemployment rate remains well above  the 6.5% threshold for raising rates, and also well above  the 5.5 – 5.75% rate the FOMC forecasts as the new  normal unemployment rate.
  • It is well documented that the private sector economy has created more than 200,000 jobs in four of the past five months. However, the labor market turned in a similar performance in late 2011 and early 2012,  only to see a marked slowdown in job creation over the spring and summer of 2012.  Bernanke mentioned this during his Q&A, noting,  “So I think an important criterion would be not just the improvement (in the labor market) that we’ve seen, but is it going to be sustained for a number of months?”

But_Also_Remain_Somewhat_-_Figure_4

  • At 3.6%, the hiring rate — the level of new  hiring as a percent of total employment measured from the JOLTS data (see box on page5) — remains depressed, and well below the 4.5 – 5.0% hire rate seen prior to the onset of the Great Recession in 2007.  In her March 4, 2013 speech, Yellen noted, “the hiring rate remains depressed. Therefore, going forward,  I would look for an increase in the rate of hiring.”
  • In that same speech, Yellen noted “layoffs and discharges as a share of total employment have already returned to their pre-recession level”. Indeed, Figure 3 shows that the discharge rate,  at 1.2%, is very close to an all-time low. A good proxy for this metric is the level of initial claims and the monthly Challenger layoff data,  both of which continue to show that companies are reluctant to shed more  workers at this point in the business cycle.

Workers_Are_Feeling_More_Confident_-_Figure_5

  • The quit rate measures the percentage of people who leave their jobs voluntarily, presumably because they are confident enough in their own skills — or in the health  of the economy — to find another job. In the three months ending in January 2013 (the latest data available), 53%  of the people who were “separated” from their jobs (laid off, fired, retired, or left voluntarily) were job quitters. This was the highest reading on this metric since mid-2008, but remains well below its pre-Great Recession “normal” of 56 – 60%. Commenting on this metric in her March 4, 2013 speech, Yellen noted “a pickup in the quit rate,  which also remains at a low level, would signal that workers perceive that their chances to be rehired are good — in other  words, that labor demand has strengthened.” The final metrics mentioned by Yellen — consumer spending and overall economic growth — both remain  well below average, and indeed still point to an economy that is running at around  two-thirds speed.

As this document was being prepared for publication on Monday,  March 25, 2013,  Bill Dudley, the third member of the “center of gravity” at the Fed also hinted at his reluctance to remove the stimulus too soon. On balance, Dudley’s comments, along with last week’s appearance from Ben Bernanke echoed comments made in early March 2013 by Fed Vice Chair Yellen, suggest that the “center of gravity” at the Fed is not yet convinced that there has been “substantial improvement” in the labor market or economy. This should give market participants comfort that the Fed is not likely to begin removing QE anytime soon, but also raises the risk that the Fed may wait too long to remove the stimulus, which could lead to higher inflation and higher interest rates in the future.

About the  JOLTS Report

Each month, market participants and the  financial media obsess over the  monthly employment report  from the  Bureau of Labor Statistics ( BLS ) that  details how  many  jobs were added in the  economy, in what  industries the  jobs were added, how  much  workers were paid, and why workers were unemployed. That report  is typically released on the  first Friday of every  month. On the  other  hand,  the  monthly report  on job openings and labor turnover (the JOLTS data), released by the  same government agency — the  BLS — that  releases the  monthly jobs report, is met  with little, if any, fanfare  from the  financial markets or the  financial media. The JOLTS report  does not get  a lot of attention, mainly because it is dated. For example, the  market got detailed information on the  labor market for February  2013  on March  8, 2013  when the  monthly employment report  was released. The JOLTS report  for February  2013  isn’t due  out until April 9, 2013.  The JOLTS data  provide more  insight into the  inner workings of the  labor market than  the  monthly employment report  does. JOLTS provides data  on:

  • The number of job openings by economy-wide, by firm size, and by region;
  • The number of new  hires in a given month; and
  • Job separations, and the various drivers of those separations (fired, laid off, retired, quit).

Please see our Weekly Economic Commentary from February  19, 2013  for more  insights from the  JOLTS report.

____________________________________________________________________

IMPORTANT DISCLOSURES

The opinions voiced in this material are for general information only and are not intended to provide specific advice or recommendations  for any individual. To determine  which investment (s) may be appropriate for you, consult your financial advisor prior to investing.  All performance reference is historical and is no guarantee of future results.  All indices are unmanaged and cannot be invested into directly.

The economic forecasts  set forth in the presentation may not develop as predicted and there can be no guarantee that strategies  promoted will be successful.

Gross domestic product (GDP) is the monetary value of all the finished goods and services produced within

a country’s borders in a specific time period,  though  GDP is usually calculated on an annual basis. It includes all of private and public consumption, government outlays, investments and exports less imports that occur within a defined territory.

Government bonds and Treasury Bills are guaranteed by the U.S. government as to the timely payment of principal and interest and, if held to maturity, offer a fixed rate of return and fixed principal value. However, the value of fund shares is not guaranteed and will fluctuate.

International investing involves special risks, such as currency fluctuation and political instability, and may not be suitable for all investors.

Mortgage Backed Securities are subject to credit, default, prepayment risk that acts much like call risk when you get your principal back sooner than the stated maturity, extension risk, the opposite of prepayment risk, market and interest rate risk.

Quantitative easing is a government monetary policy occasionally used to increase the money supply by buying government securities or other securities from the market. Quantitative easing increases the money supply by flooding financial institutions with capital in an effort to promote increased lending and liquidity.

The Federal Open Market Committee action known as Operation Twist began in 1961. The intent was to flatten the yield curve in order to promote capital inflows and strengthen the dollar. The Fed utilized open market operations to shorten the maturity of public debt in the open market. The action has subsequently been reexamined in isolation and found to have been more effective than originally thought. As a result of this reappraisal, similar action has been suggested as an alternative to quantitative easing by central banks.

The Federal Open Market Committee (FOMC), a committee within the Federal Reserve System, is charged under the United States law with overseeing the nation’s open market operations (i.e., the Fed’s buying and selling of United States Treasure securities).

Stock investing involves risk including loss of principal.

__________________________________________________________________

INDEX DESCRIPTIONS

The Chicago Area Purchasing Managers’ Index that is read on a monthly basis to gauge how manufacturing activity is performing. This index is a true snapshot of how manufacturing and corresponding businesses are performing for a given month. A reading of 50 or above is considered a positive reading. Anything below 50 is considered to indicate a decline in activity. Readings of the index have the ability to shift the day’s trading session one way or another based on the results.

Job Openings and Labor Turnover Survey (JOLTS) is a survey done by the United States Bureau of Labor Statistics to help measure job vacancies. It collects data from employers including retailers, manufacturers and different offices each month. Respondents to the survey answer quantitative and qualitative questions about their businesses’  employment, job openings, recruitment, hires and separations. The JOLTS data is published monthly and by region and industry.

__________________________________________________________________

This research  material has been prepared by LPL Financial.

 To the extent you are receiving investment advice from a separately registered independent investment advisor, please note that LPL Financial is not an affiliate of and makes no representation with respect to such entity.

Not FDIC/NCUA Insured | Not Bank/Credit Union Guaranteed  | May Lose Value | Not Guaranteed  by any Government Agency | Not a Bank/Credit Union Deposit