Archive for the ‘Treasuries’ Category

Clearing up confusion on common queries
May 7, 2013

In this week’s commentary we attempt to clear up some of the confusion around some of the most common questions we encounter regularly, including:

  • The Federal Reserve (Fed), its balance sheet, its role in the economy,and its impact on inflation;
  • The federal budget deficit;
  • The federal debt outstanding, and the debt-to-GDP ratio; and
  • The trade deficit and a related topic, the US dollar.

In many ways, the items above are related. But oftentimes, pundits, politicians, newsletter writers, bloggers, Tweeters, and even the “traditional media” will confuse or conflate one or more of these issues, and that’s usually when we get a call about it in the LPL Financial Research Department.

The Federal Reserve

The Federal Reserve (Fed) was created in 1913 by an act of Congress, The Federal Reserve Act, to provide “the nation with a safer, more flexible, and more stable monetary and financial system.” The Fed was created after a series of financial panics, bank runs, credit crunches, and booms and busts in the late 1800s and early 1900s. Over time, the Fed’s role in the economy has expanded, and currently, the Fed has a “dual mandate” from Congress (via the Full Employment and Balanced Growth Act of 1978) to conduct monetary policy that aims to promote “full employment and reasonable price stability.” In plain English, Congress created the Fed to run monetary policy, and could, at any time, vote to take away or modify the Fed’s dual mandate. In fact, Congress could run monetary policy themselves if they voted to do so, although it would be an understatement to say that markets would not embrace that outcome were it occur.

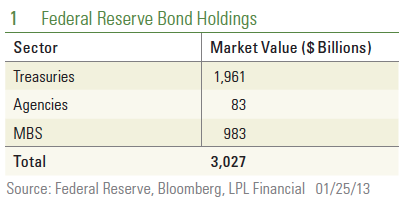
As part of its mandate from Congress, the Fed’s policymaking arm, the Federal Open Market Committee (FOMC) can raise or lower the interest rate banks charge each other for overnight loans, and expand and contract its balance sheet (quantitative easing, or QE) to achieve its goals. Since 2008, the Fed has pursued several rounds of QE — the purchase of Treasury and mortgage-backed securities (MBS) in the marketplace — by creating “reserve credits.” The Fed’s balance sheet currently stands at just over $3 trillion, and it is likely to continue to grow over the remainder of 2013 and perhaps beyond.

1_The_Fed's_balance_Sheet

The Fed’s balance sheet does not add to the federal deficit (see below), nor does the Fed set interest rates in the marketplace — beyond interest rates on overnight lending. Interest rates on everything from 3-month T-bills to 30-year Treasury bonds are set by the market, not the Fed. While the Fed is not responsible for fiscal policy or the budget deficit (see below), an argument has been made that the Fed is encouraging fiscal policymakers to overspend by buying the debt issued by the Treasury to fund the spending. In all likelihood however, Congress would be spending more than it takes in, and the Treasury would be issuing the debt to fund this overspending anyway. The difference is that instead of the Fed buying the Treasuries, other entities (the U.S. public, bond funds, pension funds, insurance companies, foreign entities, etc.) would be buying the debt, albeit at a slightly higher yield, and a slightly higher cost to the Treasury.

Our view remains that the Fed will continue its program of QE over the remainder of 2013, and keep rates at or near zero until at least 2015.

The risk of inflation from the Fed’s policies would arise if all the money the Fed is pumping into the system (mainly onto commercial banks’ balance sheets) would be lent out all at once by those banks to businesses and consumers across the country and around the world. While there has been some lending, lending activity has not been robust, and indeed the velocity of money — the rate at which money sloshes around in the economy — has fallen by a third since the onset of the financial crisis in 2007 – 08, and shows no signs of reversing. (Please see the Weekly Economic Commentary:  (Inflation Situation Revisited from March 18, 2013 for more on our view on inflation).

In short, the Fed runs monetary policy and is given that mandate by Congress. Our view remains that the Fed will continue its program of QE over the remainder of 2013, and will keep rates at or near zero until at least 2015.

Federal Budget Deficit

The federal budget deficit is the difference between what the Treasury collects in taxes (personal income taxes, payroll taxes, excise taxes, corporate taxes) and fees, less what the federal government spends (on defense, social programs, roads, education, etc.). Deficits increase when the federal government, authorized by Congress, spends more than it takes in, and deficits decrease when the federal government takes in more revenue than it spends in a year. A large percentage of federal spending is set on autopilot via mandatory spending on programs like Social Security, Medicare, and Medicaid (see the Weekly Economic Commentary from October 29, 2012), although smaller portions of the budget (interest payments on the federal debt and spending on non-mandatory items) are determined by Congress annually.

2_The_Federal_Budget_Deficit

Fiscal Policy

Fiscal policy (decisions on how the government should raise revenue and/or manage spending) is made by Congress, with the President having veto power over what Congress decides. The federal budget deficit (in dollar terms and as a percent of gross domestic product [GDP]), is headed lower, at least over the medium term, helped by tax increases, the sequester spending cuts, the fading impact of the $787 billion American Recovery and Reinvestment Act (ARRA) of 2009, and the improving economy, leading to higher revenues and lower spending for items such as unemployment insurance. While this improvement in the overall budget picture is welcome, and somewhat of a surprise to many, it may lead to complacency, and prevent the policymakers responsible for fiscal policy from taking the needed actions to begin to address our longer-term budget problems. While the Fed has no role in setting fiscal policy, the Fed’s own policies do impact the deficit. The Fed’s operations historically earn a profit, as the revenue it takes in via open market operations as well as by check and electronic payments processing for the financial system, far exceed its operating costs. The Fed promptly returns all profits back to the Treasury. In 2012, the Fed paid $88 billion into the Treasury, and it has consistently returned profits to the Treasury since the mid-1930s. The Fed’s monetary policy can also impact what the federal government pays in interest on the public debt. By keeping short-term rates low, the Fed is helping to keep interest payments owed by the federal government low. By keeping a lid on inflation, the Fed has a hand in keeping intermediate- and long-term interest rates low, which in turn helps to keep the interest paid by the federal government on intermediate- and longer-dated Treasuries low.

LPL_Financial_Research_Weekly_Calendar

Federal Debt

The federal debt is simply the federal deficit accumulated over the years. When the deficit increases in a given year because the federal government spends more than it takes in, the debt increases. There are several measures of federal debt, the broadest being total public debt outstanding, which was $16.8 trillion at the end of March 2013. Of that, $11.9 trillion was marketable and held by the public (and half of that is held by foreigners), while $4.9 trillion is owned by entities within the federal government. The debt-to-GDP ratio is calculated by dividing the debt (total, held by public, etc.) by nominal GDP (See the Weekly Economic Commentary: The ABCs of GDP from May 6, 2013), which stands at $16 trillion. So the United States’ debt-to-GDP ratio measured by total debt outstanding ($16.8 trillion) divided by nominal GDP ($16 trillion) is 105%. However, most market participants exclude the federal debt owed to other federal government entities and calculate the debt-to-GDP ratio as debt owned by the public ($11.9 trillion) divided by nominal GDP ($16.0) trillion for a debt-to-GDP ratio of just over 74%. The nonpartisan Congressional Budget Office projects that public debt outstanding as a percent of GDP (currently at 74% of GDP) will rise gradually to 77% of GDP by 2023, assuming current law and trend-like 2.8% real GDP growth over the next 10 years.

The structural and demographic problems that will drive the deficit over the next several decades remain in place, and the longer policymakers wait to address the problems, the more difficult (and painful) it becomes to address the problems later on.

3_The_Nonpartisan_CBO

The real problem posed by the federal debt, however, is the structural deficits in the Social Security, Medicare, and Medicaid programs, which won’t be helped much by an improving economy. The biggest risk on the federal debt is that the recent improvement in the deficit (and relative stability in the debt-to-GDP ratio) allows complacency to set in among policymakers in Washington. The structural and demographic problems that will drive the deficit over the next several decades remain in place, and the longer policymakers wait to address the problems, the more difficult (and painful) it becomes to address the problems later on.

Trade Deficit

The difference between what we export in goods and services to other countries, and what we import in goods and services from other countries is our trade deficit. Many factors influence the trade deficit, including, but not limited to:

  • The value of the dollar;
  • The relative strength of our economy to economies outside the United States;
  • The quality of goods and services made here relative to the quality of the goods and services created overseas; and
  • Trade barriers and tariffs.

The United States is still likely to run a substantial trade deficit in the years ahead, and the trade sector will continue to weigh on overall GDP growth and the value of the dollar.

We currently run a very large deficit on goods (importing $2.3 trillion and exporting just $1.6 trillion over the past 12 months), but we run a small net trade surplus (importing $435 billion and exporting $636 billion) on the service side. Congress and the President can impact trade directly (via trade agreements, tariffs) and indirectly (via enacting industry and product-specific tax and regulatory measures). A nation’s fiscal policy can have an influence on the trade deficit as well, if the fiscal policy impacts economic growth, the value of the dollar, etc. The Fed’s main impact on the trade deficit is via interest rates and the dollar. Typically, if the Fed is cutting interest rates or maintaining “easy” monetary policy, the dollar may decline in response, making our exports less expensive to the rest of the world. The nascent revival of the U.S. manufacturing sector along with the now ample supply of natural gas and related products will help to hold the trade deficit in check by reducing our dependence on foreign manufactured goods and imported energy and energy products. Despite these positives however, the United States is still likely to run a substantial trade deficit in the years ahead, and the trade sector will continue to weigh on overall GDP growth and the value of the dollar.

The Dollar

Aside from two periods in the early 1980s and late 1990s, the US dollar has been declining since it went off the gold standard in the early 1970s. The value of the dollar is set in the open market, although the Fed, Congress, and the President can have an impact on the dollar. Of the three, the Fed probably has the most direct impact on the value of the dollar, as it sets short-term interest rates, which often have a big influence on the value of a nation’s currency. The Fed’s current program of QE is increasing the number of dollars in the world, and helping to put downward pressure on the dollar. Trade policy, broad economic policy, and even foreign policy — set by Congress and/or the President — can also impact the value of the dollar. Our “twin deficits” (trade and budget) have put downward pressure on the dollar over the past several decades, and will continue to do so for the foreseeable future.

4_Aside_from_the_early_1980's

Since the United States is the world’s largest economy, most global trade is denominated in dollars, making the dollar the world’s “reserve currency.” Central banks and governments of most nations outside the United States hold reserves in dollars, although the rise of China’s economy and the sheer size of the Eurozone’s economy has eroded the dollar’s “reserve currency” status in recent years. Still, the dollar is still viewed as a “safe haven,” and in times of economic and political uncertainty around the globe, the dollar normally rises in value.

5_-_Our__Twin_Deficit_

While our “twin deficits” and the Fed’s actions to stimulate the economy are putting downward pressure on the dollar, the dollar’s status as the world’s reserve currency, and the United States’ position as the world’s largest economy and the world’s largest exporter with a diversified and dynamic economy and labor force, suggests that a sudden, sharp decline in the value of the dollar is unlikely. We continue to believe the dollar will slowly depreciate over time — continuing the trend that has been in place since the early 1970s.

_____________________________________________________________________________________________________________________________________________

IMPORTANT DISCLOSURES
The opinions voiced in this material are for general information only and are not intended to provide specific advice or recommendations for any individual. To determine which investment(s) may be appropriate for you, consult your financial advisor prior to investing. All performance reference is historical and is no guarantee of future results. All indices are unmanaged and cannot be invested into directly. Gross domestic product (GDP) is the monetary value of all the finished goods and services produced within
a country’s borders in a specific time period, though GDP is usually calculated on an annual basis. It includes all of private and public consumption, government outlays, investments and exports less imports that occur within a defined territory.

The economic forecasts set forth in the presentation may not develop as predicted and there can be no guarantee that strategies promoted will be successful.

Stock investing involves risk including loss of principal.

Quantitative easing is a government monetary policy occasionally used to increase the money supply by buying government securities or other securities from the market. Quantitative easing increases the money supply by flooding financial institutions with capital in an effort to promote increased lending and liquidity.

The Federal Open Market Committee (FOMC) , a committee within the Federal Reserve System, is charged under the United States law with overseeing the nation’s open market operations (i.e., the Fed’s buying and selling of U.S. Treasury securities).

The Congressional Budget Office is a non-partisan arm of Congress, established in 1974, to provide Congress with non-partisan scoring of budget proposals.

Government bonds and Treasury Bills are guaranteed by the U.S. government as to the timely payment of principal and interest and, if held to maturity, offer a fixed rate of return and fixed principal value. However, the value of fund shares is not guaranteed and will fluctuate.

Mortgage-Backed Securities are subject to credit, default risk, prepayment risk that acts much like call risk when you get your principal back sooner than the stated maturity, extension risk, the opposite of prepayment risk, and interest rate risk.

____________________________________________________________________________________________________________________________________________

INDEX DESCRIPTIONS
The Consumer Price Index (CPI) is a measure of the average change over time in the prices paid by urban consumers for a market basket of consumer goods and services.

Purchasing Managers’ Index (PMI) is an indicator of the economic health of the manufacturing sector. The PMI index is based on five major indicators: new orders, inventory levels, production, supplier deliveries and the employment environment.

____________________________________________________________________________________________________________________________________________

This research material has been prepared by LPL Financial.
To the extent you are receiving investment advice from a separately registered independent investment advisor, please note that LPL Financial is
not an affiliate of and makes no representation with respect to such entity.

Not FDIC/NCUA Insured | Not Bank/Credit Union Guaranteed | May Lose Value | Not Guaranteed by any Government Agency | Not a Bank/Credit Union Deposit

Bond Market Perspectives
February 5, 2013

The Fed’s Bond Diet 

Bond investors may revisit an early catalyst to bond market weakness in 2013, when Federal Reserve (Fed) policymakers reconvene this week. The official statement following the conclusion of this Wednesday’s Fed meeting will be scrutinized for clues about whether the Fed’s bond appetite may be satiated. Minutes of the December 2012 Fed meeting, released during the first week of January, sparked selling among high-quality bonds, as investors feared the Fed would end or curtail bond purchases earlier than expected. Minutes also revealed that…”Several others thought that it would probably be appropriate to slow or to stop purchases well before the end of 2013, citing concerns about financial stability or the size of the balance sheet.” As we commented in early January, we believe bond market reaction to the Fed meeting minutes was overdone (please see the January 8, 2013, Bond Market Perspectives: Sour Start to New Year for more details), but scrutiny over the Fed’s bond holdings will continue.

With the Fed’s balance sheet surpassing $3 trillion [Figure 1], investors’ attention may once again be drawn to the Fed’s bond buying. The Fed is widely expected to maintain its current bond-buying diet of $45 billion in long-term Treasuries and $40 billion of government-agency mortgage-backed securities (MBS) as Fed policymakers reconvene this week.

Screen Shot 2013-02-05 at 4.12.32 PM

However, in 2013, the Fed is no longer offsetting Treasury purchases with Treasury sales. The Fed will be buying a total of approximately $115 billion of government bonds per month after including reinvestment flows, which have averaged slightly more than $30 billion per month over the last six months. At that rate, the Fed’s balance sheet will be steadily  progressing toward $4 trillion, and bond investors are assessing the potential impact.

Fed Buying and Bond Valuations

Screen Shot 2013-02-05 at 4.23.32 PMFed bond purchases, and subsequent expansion of the balance sheet, are one of the main drivers of expensive bond valuations. As the Fed’s balance sheet has grown with bond holdings, the yield on Treasury Inflation Protected Securities (TIPS) fell and, until recently, declined further into negative territory [Figure 2]. Fed bond purchases, in addition to their commitment to refrain from raising interest rates for an extended period have both contributed to making Treasury bonds expensive.

Aside from the impact on valuations, the interest rate sensitivity of the Fed’s bond portfolio will continue to increase. Bond investors will monitor interest rate sensitivity, since it may influence the Fed’s decision on whether to continue buying bonds and at what pace. And so will Fed officials, as this week’s Weekly Economic Commentary notes: “…both the efficacy and the costs would need to be carefully monitored and taken into account in determining the size pace and composition of asset purchases” according to the Fed.

Our analysis of Fed bond holdings reveals an average coupon rate of 3.9% and average duration (a measure of interest rate sensitivity) of 6.5 years. As a rough rule of thumb, duration reveals the percentage change in a portfolio for a given change in interest rates. For example, if interest rates rise by 1%, the Fed’s portfolio would suffer a 6.5% loss in price. However, duration does not factor in time horizon. Should the 1% rise in interest rates occur over one year, the 6.5% loss would be offset by 3.9% of interest income for a net loss of 2.6%. Nonetheless, a 2.6% loss on the Fed’s $2.8 trillion market value of bond holdings produces a $74 billion loss.

According to Fed data, the Fed has an unrealized gain of $249 billion from its bond holdings. The unrealized gain suggests the Fed’s bond portfolio could, simplistically, sustain a 2% rise in interest rates (~$150 billion loss) before the Fed may come under political pressure to stop bond purchases. Over time, the Fed’s portfolio will change and market sensitivity will increase, making it hard to pinpoint how large an interest increase the Fed would be willing to suffer through. Adding more bonds in the coming months will add interest rate risk and increase the potential for loss in a rising rate environment.

All of this is not lost on the Fed officials, of course, and a working paper reveals that the Fed has already begun more thorough analysis of potential market impacts to its bond holdings over a longer term horizon. The Fed analyzed potential impacts under two policy paths: continuing the current pace of bond purchase through June 2013, and continuing purchases through the end of 2013. The Fed then subjected each path to: 1) a base case gradual rise in interest rates; 2) interest rates rise by 1% more than expected in the base case; and 3) a 1% decline in interest rates from the base case. The Fed also modeled assumptions for the pace of bond sells, pace of economic growth, and shape of the yield curve — all of which would impact bond prices. Many variables could affect the ultimate outcome, but the analysis is instructive of potential costs and risks faced by the Fed.

In summary, the Fed analysis found:

  •  ŸUnder the base case, the analysis revealed Fed losses would reach approximately $10 billion if purchases ended mid-year 2013, and $40 billion if purchases continued at the current pace through year-end 2013.
  • Under the bear case where the interest rate increase is greater, the analysis revealed that losses peak at $60 billion if purchases ended mid-year 2013, and $125 billion if purchases continued at the current pace through year-end 2013.

The key takeaway is that there is a notable reduction in risk, according to the Fed’s analysis, if the Fed ends bond purchases before the end of 2013. Therefore, investors will continue to look for clues for an earlier-than-expected end to purchases.

Our view is that the end of bond purchases may not necessarily lead to a bond bear market. As stated in our January 8, 2013 Bond Market Perspectives, prior halts of Fed bond purchases have led to lower Treasury yields. Our concern relates to more economically sensitive, higher yielding segments of the bond market such as high-yield bonds that have benefited in part from increased demand from Fed bond purchases and policy that helped push high-quality bond yields extremely low. Given the strong start to the year by corporate bonds and other credit-sensitive sectors, a change in underlying market dynamics, such as Fed purchases, is that much more important. We are unlikely to get additional clarity from the Fed this week, which means investors may have to wait a few weeks before minutes are released and details on the latest Fed thoughts on bond purchases may become clearer. In the meantime, we continue to favor corporate bond sectors in fixed income portfolios and their greater yields as defense against rising interest rates. However, we remain watchful of a signal from the Fed that buying habits may change and warrant a reduction given now-higher valuations.

__________________________________________________________________________________________________________________________________________

IMPORTANT DISCLOSURES

The opinions voiced in this material are for general information only and are not intended to provide specific advice or recommendations for any individual. To determine which investment(s) may be appropriate for you, consult your financial advisor prior to investing. All performance referenced is historical and is no guarantee of future results. All indexes are unmanaged and cannot be invested into directly.

The economic forecasts set forth in the presentation may not develop as predicted and there can be no guarantee that strategies promoted will be successful.

Bonds are subject to market and interest rate risk if sold prior to maturity. Bond values and yields will decline as interest rates rise, and bonds are subject to availability and change in price.

Corporate bonds are considered higher risk than government bonds but normally offer a higher yield and are subject to market, interest rate and credit risk as well as additional risks based on the quality of issuer coupon rate, price, yield, maturity and redemption features.

Government bonds and Treasury Bills are guaranteed by the U.S. government as to the timely payment of principal and interest and, if held to maturity, offer a fixed rate of return and fixed principal value. However, the value of fund shares is not guaranteed and will fluctuate.

High-yield/junk bonds (grade BB or below) are not investment grade securities, and are subject to higher interest rate, credit, and liquidity risks than those graded BBB and above. They generally should be part of a diversified portfolio for sophisticated investors.

Treasuries are marketable, fixed-interest U.S. government debt securities. Treasury bonds make interest payments semi-annually, and the income that holders receive is only taxed at the federal level.

Treasury inflation-protected securities (TIPS) help eliminate inflation risk to your portfolio, as the principal is adjusted semiannually for inflation based on the Consumer Price Index—while providing a real rate of return guaranteed by the U.S. government.

Mortgage Backed Securities are subject to credit, default, prepayment risk that acts much like call risk when you get your principal back sooner than the stated maturity, extension risk, the opposite of prepayment risk, market and interest rate risk.

__________________________________________________________________________________________________________________________________________

This research material has been prepared by LPL Financial.

To the extent you are receiving investment advice from a separately registered independent investment advisor, please note that LPL Financial is not an affiliate of and makes no representation with respect to such entity.

Not FDIC/NCUA Insured | Not Bank/Credit Union Guaranteed | May Lose Value | Not Guaranteed by any Government Agency | Not a Bank/Credit Union Deposit

Member FINRA/SIPC

RES 4054 0113

Tracking #1-137281 (Exp. 01/14)

__________________________________________________________________________________________________________________________________________

Stay Connected with Us!


www.garrettandrobinson.com

Outlook 2013 | The Path of Least Resistance – Part I
November 29, 2012

This is the first of a 6 part series focused on the Outlook for 2013.

The series is broken down as follows:

Part 1 – The Path of Least Resistance

Part 2 – The Base Path:  The Compromise

Part 3 – The Bear Path:  Going Over the Cliff

Part 4 – The Bull Path:  The Long-Term Solution

Part 5 – The Paths for Europe, Central Banks, and Geopolitics

Part 6 – Over the (Capitol) Hill:  A View from the End of the First Quarter of 2013

Outlook 2013

In 2013, many different forces will combine to influence the direction of the markets to follow the path of least resistance leading to modest single-digit returns in the U.S. stock and bond markets.* The path for the year may be set at the end of 2012, or in early 2013, as critical decisions are implemented:

  • Washington will likely finally rise to the challenge of this self-imposed crisis and form the compromise between the parties that will meet the least resistance — extending some of the Bush-era tax cuts and cancelling some of the scheduled spending cuts. However, going down this path risks delaying progress toward a more permanent solution that makes the government’s finances sustainable.
  • The Federal Reserve (Fed) is likely to continue its bond-buying program of quantitative easing (QE). This open-ended QE is the path of least resistance among Fed decision makers and one which will buy the Fed more time to determine if more aggressive monetary policy easing is needed or if the economy can withstand a lessening of stimulus.
  • Major hurdles to further European integration overcome in 2012 set the stage for progress toward a tighter fiscal, economic, and banking union. A high degree of resistance to splitting apart counterbalanced with strong stances against unconditional support is likely to keep Europe on a middle path toward slow continued integration.
  • The U.S. economy faces the weakest global economic backdrop since the Great Recession of 2008 – 09 heading into the looming fiscal drag of tax increases and spending cuts. These forces are only partially offset by the benefits of Fed stimulus, the positive consumer wealth effect driven by the rebounding housing and stock markets, and the lifting of business uncertainty as the budget decisions are resolved. The combination is likely to result in a path leading to flat-to-weak growth for the U.S. economy.
The economic forecasts set forth in the presentation may not develop as predicted and there can be no guarantee that strategies promoted will be successful.
*Equity market forecast is for the S&P 500 Index and is based upon a low-single-digit earnings growth rate supported by modest share buybacks combined with 2% dividend yields and little change in valuations.  Bond market forecast is for the Barclays Aggregate Index and is based upon <1% rise in rates, with price declines offset by interest income.

Our base case path is supported by our view that key decision makers will find it is better to determine a way to overcome an avoidable and unnecessary economic recession, buy time to actually propose and vote on competing long-term fiscal visions, and do something to help restore confidence in Washington’s ability to govern. Ideally, this could help maintain investors’ appetites for U.S. equities and Treasuries. For the markets, the path of least resistance is likely to include modest single-digit returns for stocks as sluggish profit growth dampens stronger gains, but prices are supported by low valuations and improving clarity as uncertainties begin to fade. Bond yields may rise only slightly, restrained by sluggish growth and a Fed committed to keeping rates low, leaving returns to be limited to interest income at best. However, there are paths that differ from this base case outcome: a bear path where the consequences of fiscal contraction damage confidence as well as the economy, and a bull path where an historic opportunity to address the U.S.’s long-term fiscal challenges is embraced and leads to sustainable solutions. Which of these three is the path of least resistance is likely to be determined by the end of the first quarter of 2013.

Calendar of Events

The Base, Bull, and Bear Case Paths

The hard-fought election will likely be followed by more fighting in a divisive and bitter “lame duck” session in Congress running through year-end 2012. The stakes are high as those on Capitol Hill seek to mitigate the budget bombshell of tax increases and spending cuts, known as the fiscal cliff, due to hit in January 2013. The two parties have very different visions of what a deal should look like. Failure to reach a compromise in the coming months could lead to a recession and bear market for U.S. stocks in early 2013.

However, a deal is in the best interest of those on Capitol Hill. The Republicans have a lot of items that are important to them to lose in foregoing a deal with Democrats: the Bush tax cuts would expire and the looming spending cuts hit defense spending hard while not really impacting the big entitlement programs (such as Social Security, Medicare, Medicaid, and the Affordable Care Act). To avoid being blamed for a return to recession on their watch, Democrats may only need to compromise on extending the middle-class tax cuts, which President Obama already communicated his support of during his campaign, and delaying the impact of some of the spending cuts. The path to a deal may not be a straight line, but is the outcome we view as most likely and upon which we base our expectation of modest returns for stocks and bonds — with no bear or bull
market — in 2013.

While a deal may be likely, there are risks for investors. In October 2012, with the S&P 500 having risen back to within 10% of all-time highs, markets seemed confident that the Senate Democrats would quickly find a compromise with House Republicans to avoid going over the fiscal cliff. However, a compromise may be hard to reach. Recall that the gridlock in Washington was no help to markets in 2011, as the unwillingness to compromise on both sides of the aisle led to the debt ceiling debacle in August 2011, which sent the S&P 500 down over 10% in a few days despite the ultimate approval of the increase to the debt ceiling. A bear market and recession could be looming if policymakers choose this path.

Despite the risks, there is room for guarded optimism. If there ever were a time to enact long-term fiscal discipline, now is that time. The United States’ large and unsustainable budget deficits helped push total U.S. debt over 100% of Gross Domestic Product (GDP) in 2012.  Previously unmentionable as part of the “third-rail” of politics, wide-reaching bipartisan proposals have been unveiled to put the United States back on a path to fiscal sustainability. A long-term solution of permanent changes to tax rates and entitlement programs as well as ending the battles over the debt ceiling could emerge in 2013. This path would be welcomed with a bull market and lift the uncertainty plaguing business leaders and investors alike.

The battle is likely to result in a compromise that averts the worst-case outcome, but the negotiations themselves, coming on the heels of hard-fought election battles, may drive market swings. Fortunately, the lowest valuations for stocks in 20 years may help to limit downside and create potential investment opportunities. Which of these three paths will prevail is largely driven by the compromise — or lack thereof — in Washington.

IMPORTANT DISCLOSURES

The opinions voiced in this material are for general information only and are not intended to provide or be construed as providing specific investment advice or recommendations for any individual. To determine which investments may be appropriate for you, consult your financial advisor prior to investing. All performance referenced is historical and is no guarantee of future results. All indices are unmanaged and cannot be
invested into directly.

The economic forecasts set forth in the presentation may not develop as predicted and there can be no guarantee that strategies promoted will be successful.

Investing in specialty market and sectors carry additional risks such as economic, political or regulatory developments that may affect many or all issuers in that sector.

International and emerging market investing involves special risks such as currency fluctuation and political instability and may not be suitable for all investors.

Bonds are subject to market and interest rate risk if sold prior to maturity. Bond values and yields will decline as interest rates rise and bonds are subject to availability and change in price.

Municipal bonds are subject to availability, price, and to market and interest rate risk if sold prior to maturity. Bond values will decline as interest rate rise. Interest income may be subject to the alternative minimum tax. Federally tax-free, but other state and local taxes may apply.

Corporate bonds are considered higher risk than government bonds, but normally offer a higher yield and are subject to market, interest rate, and credit risk as well as additional risks based on the quality of issuer, coupon rate, price, yield, maturity, and redemption features.

Government bonds and Treasury Bills are guaranteed by the U.S. government as to the timely payment of principal and interest and, if held to maturity, offer a fixed rate of return and fixed principal value. However, the value of fund shares is not guaranteed and will fluctuate.

Treasuries: A marketable, fixed-interest U.S. government debt security. Treasury bonds make interest payments semi-annually and the income that holders receive is only taxed at the federal level.

Quantitative easing is a government monetary policy occasionally used to increase the money supply by buying government securities or other securities from the market. Quantitative easing increases the money supply by flooding financial institutions with capital in an effort to promote increased lending and liquidity.

The P/E ratio (price-to-earnings ratio) is a measure of the price paid for a share relative to the annual net income or profit earned by the firm per share. It is a financial ratio used for valuation: a higher P/E ratio means that investors are paying more for each unit of net income, so the stock is more expensive compared to one with a lower P/E ratio.

Earnings per share (EPS) is the portion of a company’s profit allocated to each outstanding share of common stock. EPS serves as an indicator of a company’s profitability. Earnings per share is generally considered to be the single most important variable in determining a share’s price. It is also a major component used to calculate the price-to-earnings valuation ratio.

Default rate is the rate in which debt holders default on the amount of money that they owe. It is often used by credit card companies when setting interest rates, but also refers to the rate at which corporations default on their loans. Default rates tend to rise during economic downturns, since investors and businesses see a decline in income and sales while still being required to pay off the same amount of debt.

Index Definitions
The IS M index is based on surveys of more than 300 manufacturing firms by the Institute of Supply Management. The IS M Manufacturing Index monitors employment, production inventories, new orders, and supplier deliveries. A composite diffusion index is created that monitors  conditions in national manufacturing based on the data from these surveys.

The Standard & Poor’s 500 Index is a capitalization-weighted index of 500 stocks designed to measure performance of the broad domestic economy through changes in the aggregate market value of 500 stocks representing all major industries.

Dow Jones Industrial Average (DJIA ): The Dow Jones Industrial Average Index is comprised of U.S.-listed stocks of companies that produce other (non-transportation and non-utility) goods and services. The Dow Jones Industrial Averages are maintained by editors of The Wall Street Journal. While the stock selection process is somewhat subjective, a stock typically is added only if the company has an excellent reputation, demonstrates sustained growth, is of interest to a large number of investors, and accurately represents the market sectors covered by the average. The Dow Jones averages are unique in that they are price weighted; therefore, their component weightings are affected only by changes in the stocks’ prices.

This information is not intended to be a substitute for specific individualized tax advice. We suggest that you discuss your specific tax issues with a qualified tax advisor.

This research material has been prepared by LPL Financial.
To the extent you are receiving investment advice from a separately registered independent investment advisor, please note that LPL Financial is not
an affiliate of and makes no representation with respect to such entity. 

Not FDIC /NC UA Insured | Not Bank/Credit Union Guaranteed | May Lose Value | Not Guaranteed by any Government Agency | Not a Bank/Credit Union Deposit

A Fiscal New Year
October 4, 2012

Weekly Market Commentary

October 4, 2012 

This week marks Golden Week, a national holiday in China. However, the United States has its own holiday to observe. This week begins a new fiscal year for the U.S. government. Unfortunately, a new year likely brings another trillion in federal debt to add to the mounting total. The proportion of U.S. federal government debt held by the public reached 70% percent of the U.S. economy in fiscal year 2012, while total federal debt crossed 100%.  Federal debt held by the public has doubled to $11 trillion today from roughly $5 trillion five years ago, before the financial crisis and Great Recession.  The turning of the calendar to a new fiscal year presents little to celebrate.

Rather than dwell on how we got here, what is most important for investors is whether demand will remain sufficient to absorb the rising supply and what the market effects may be of continued borrowing. The trillion-dollar pace of growth in federal debt requires strong and growing demand. The lack of strong demand for borrowing from the private sector has helped to support demand for the soaring supply of government debt.

The big buyers have been foreigners, led by China, as well as the Federal Reserve (Fed) through its bond buying programs. Together, they have purchased about two-thirds of the Treasuries issued during the past five years. U.S.-based investors, retirement plans, banks, and mutual funds have also been big net buyers of Treasuries and account for almost all the rest, while state and local governments have been sellers.

Over the past five years, the demand for safety by investors and lack of new debt supply from households and businesses helped interest rates move down, despite the tremendous pace of borrowing by the federal government. However, as of mid-2012, household borrowing began to grow again along with business borrowing for the first time since the financial crisis. Looking forward, if the economic recovery is sustained in 2013, demand for borrowing from all sectors—household, business, and government—may result in even more dependence on foreigners to finance the United States’ growing debt.

IMPORTANT DISCLOSURES

The opinions voiced in this material are for general information only and are not intended to provide specific advice or recommendations for any individual. To determine which investment(s) may be appropriate for you, consult your financial advisor prior to investing. All performance reference is historical and is no guarantee of future results. All indices are unmanaged and cannot be invested into directly.

The economic forecasts set forth in the presentation may not develop as predicted and there can be no guarantee that strategies promoted will be successful.

Gross Domestic Product (GDP) is the monetary value of all the finished goods and services produced within a country’s borders in a specific time period, though GDP is usually calculated on an annual basis. It includes all of private and public consumption, government outlays, investments and exports less imports that occur within a defined territory.

Quantitative Easing is a government monetary policy occasionally used to increase the money supply by buying government securities or other securities from the market. Quantitative easing increases the money supply by flooding financial institutions with capital in an effort to promote increased lending and liquidity.

This research material has been prepared by LPL Financial.

To the extent you are receiving investment advice from a separately registered independent investment advisor, please note that LPL Financial is not an affiliate of and makes no representation with respect to such entity.

Not FDIC/NCUA Insured | Not Bank/Credit Union Guaranteed |   May Lose Value | Not Guaranteed by any Government Agency | Not a Bank/Credit   Union Deposit

LPL Financial, Member FINRA/SIPC

Dog Days for the Dow
August 16, 2012

Garrett & Robinson Weekly Market Commentary

The “dogs of the Dow” have best handled the heat of the dog days of summer.

The so-called “dogs of the Dow” strategy entails owning the highest dividend-yielding stocks in the Dow Jones Industrial Average (DJIA). Yield has been a rewarding theme in the markets this summer. In general, it has been the highest-yielding stocks and bonds that have outperformed their peers. For example, since the beginning of June in the bond market High-Yield Bonds have trounced the returns on High-Grade Corporate or Government Bonds, according to Barclays Index data. And in the stock market, the highest-yielding sectors have outperformed. Over the past three months, the high dividend-yielding Telecommunications Services, Consumer Staples, and Utilities sectors of the S&P 500 have been outperformers. Specifically, the 10 dogs of the Dow stocks this year, led by strong performance among the Telecom carriers that are the highest-yielding stocks, have outperformed the DJIA during the summer months by over three percentage points.

But as the dog days of summer draw to a close during the coming weeks, yield may no longer be the overriding market theme. The Fed’s conference in Jackson Hole, Wyo., is coming up on August 30-September 1. The Fed may use this opportunity to communicate its intention to pursue a third round of quantitative easing (so-called QE3), likely involving the purchase of Treasuries, Agencies, and Mortgage-Backed Bonds.

Counter-intuitively, a look back at prior rounds of Fed bond purchases shows that Treasury yields actually increased following the start of bond purchases. In each of the three prior bond purchase programs—QE1, QE2, and Operation Twist—the yield on the 10-year Treasury increased almost immediately, as you can see in Figure 1. This is because markets are forward-looking, and investors quickly anticipated the beneficial impacts of the Fed’s bond buying on the economy. As yields rise, investors shed more defensive, yield-oriented investments in favor of those with more potential for price appreciation.

Quantitative Easing is a government monetary policy occasionally used to increase the money supply by buying government securities or other securities from the market. Quantitative easing increases the money supply by flooding financial institutions with capital in an effort to promote increased lending and liquidity.

During the summer months so far, the most likely beneficiaries of another round of quantitative easing by the Fed have not reflected an increasing likelihood of Fed action. This can be seen in yield-oriented stocks leading rather than lagging the market, bond yields not rising, the dollar not falling, and gold not posting gains typically seen when the market expects a new bond buying program from the Fed.

IMPORTANT DISCLOSURES

The opinions voiced in this material are for general information only and are not intended to provide specific advice or recommendations for any individual. To determine which investment(s) may be appropriate for you, consult your financial advisor prior to investing. All performance reference is historical and is no guarantee of future results. All indices are unmanaged and cannot be invested into directly.

The economic forecasts set forth in the presentation may not develop as predicted and there can be no guarantee that strategies promoted will be successful.

Names of securities mentioned herein are for informational purposes only and should not be considered investment advice or guidance, offer or solicitation, offer to buy or sell securities, nor a recommendation or endorsement by LPL Financial of the security or investment strategy. LPL Financial does not endorse or evaluate individual equities.

Dividend paying stock payments are not guaranteed. The amount of a dividend payment, if any, can vary over time and issuers may reduce dividends paid on securities in the event of a recession or adverse event affecting a specific industry or issuer.

Bonds are subject to market and interest rate risk if sold prior to maturity. Bond values and yields will decline as interest rates rise and bonds are subject to availability and change in price.

Quantitative Easing is a government monetary policy occasionally used to increase the money supply by buying government securities or other securities from the market. Quantitative easing increases the money supply by flooding financial institutions with capital in an effort to promote increased lending and liquidity.

Operation Twist is the name given to a Federal Reserve monetary policy operation that involves the purchase and sale of bonds. “Operation Twist” describes a monetary process where the Fed buys and sells short-term and long-term bonds depending on their objective.

Dow Jones Industrial Average (DJIA): The Dow Jones Industrial Average Index is comprised of U.S.-listed stocks of companies that produce other (non-transportation and non-utility) goods and services. The Dow Jones Industrial Averages are maintained by editors of The Wall Street Journal. While the stock selection process is somewhat subjective, a stock typically is added only if the company has an excellent reputation, demonstrates sustained growth, is of interest to a large number of investors and accurately represents the market sectors covered by the average. The Dow Jones averages are unique in that they are price weighted; therefore their component weightings are affected only by changes in the stocks’ prices.

Consumer Staples Sector: Companies whose businesses are less sensitive to economic cycles. It includes manufacturers and distributors of food, beverages and tobacco, and producers of non-durable household goods and personal products. It also includes food and drug retailing companies.

Telecommunications Services Sector: Companies that provide communications services primarily through a fixed line, cellular, wireless, high bandwidth and/or fiber-optic cable network.

Utilities Sector: Companies considered electric, gas or water utilities, or companies that operate as independent producers and/or distributors of power.

Information Technology: Companies include those that primarily develop software in various fields such as the Internet, applications, systems and/or database management and companies that provide information technology consulting and services; technology hardware & Equipment, including manufacturers and distributors of communications equipment, computers and peripherals, electronic equipment and related instruments, and semiconductor equipment and products.

Industrials Sector: Companies whose businesses manufacture and distribute capital goods, including aerospace and defense, construction, engineering and building products, electrical equipment and industrial machinery. Provide commercial services and supplies, including printing, employment, environmental and office services. Provide transportation services, including airlines, couriers, marine, road and rail, and transportation infrastructure.

This research material has been prepared by LPL Financial.

To the extent you are receiving investment advice from a separately registered independent investment advisor, please note that LPL Financial is not an affiliate of and makes no representation with respect to such entity.

Not FDIC/NCUA Insured | Not Bank/Credit Union Guaranteed | May Lose Value | Not Guaranteed by any Government Agency | Not a Bank/Credit Union Deposit

LPL Financial, Member FINRA/SIPC