Compass Changes
- No Changes
Investment Takeaways
-
We expect the S&P 500 Index to grind higher through year-end, supported by durable U.S. economic growth, accommodative Federal Reserve (Fed) policy, and earnings gains.
-
Our positive small cap view reflects our U.S. focus and potential to capture further stock market gains.
-
We continue to favor the more U.S.-focused, consumer-oriented sectors over the global, export-focused sectors.
-
We find bond valuations roughly fair and expect yields to remain largely range-bound through year-end.
-
Higher-yielding, fundamentally sound segments of the bond market such as high-yield bonds, bank loans, and preferred securities remain among the more attractive fixed income options.
-
Among high-quality bonds, we favor investment-grade corporate bonds due to the potential for higher yields and good fundamentals.
-
We find high-yield municipal bonds attractive, but high-quality municipal bonds possess more attractive valuations and compelling taxable-equivalent yields.
-
From a technical perspective, the S&P 500 Index price continues to make new all-time highs, establishing a new bullish price objective at 1845.
Broad Asset Class Views
LPL Financial Research’s views on stocks, bonds, cash, and alternatives are illustrated below. The positions of negative, neutral, or positive are indicated by the solid black compass needle, while an outlined needle shows a previous view.
Equity & Alternative Asset Classes
Favor Small Caps for U.S. Focus Potential for Further Stock Market Gains
-
We expect the S&P 500 Index to continue to grind higher over the balance of the year, supported by durable U.S. economic growth, accommodative Fed policy, and earnings gains.
-
We favor small caps for their potential to capture further stock market gains.
-
We favor U.S. stocks relative to emerging markets (EM) and developed foreign, as Europe struggles to grow, and the growth trajectory in several key EM countries has been uneven. The recent pickup in China’s growth is encouraging.
-
We maintain a preference for growth over value due to growth’s tendency to outperform in slow-growth environments and our positive consumer discretionary view.
-
We believe further downside to crude oil (WTI) may be limited in the near term from a technical perspective, though the latest inventory data and relative calm in the Middle East are bearish.
-
The potential for the Fed not to taper its bond purchases until after the New Year may provide near-term support for gold.
Equity Sectors
Maintain Preference for U.S. and Consumer-Focused Cyclical Sectors
-
We continue to favor the more U.S.- focused, consumer-oriented sectors over the global, export-focused sectors.
-
Our consumer discretionary view remains positive as spending continues to increase, albeit modestly, and the housing recovery continues despite higher mortgage rates.
-
Our financials view is neutral. We see the U.S. focus, earnings gains, and valuations as positives, although mortgage activity, fixed income trading, and regulation remain concerns.
-
Our modestly positive health care view reflects our U.S. focus, robust pace of product innovation, and demand uptick from the Affordable Care Act (ACA).
-
The materials sector is one to watch for a potentially more positive view due to positive technicals and evidence of a pickup in growth in China.
-
We expect a potential pickup in business spending and improving growth in China to help industrials sector performance.
-
We remain cautious on telecom and utilities due to their interest rate sensitivity, though telecom valuations have become more reasonable in recent months.
-
Our recent downgrade in our consumer staples view was driven by above-average valuations and weakening technicals, but lower oil prices help the outlook.
Fixed Income
A New Yield Range
-
We find bond valuations roughly fair and expect bond prices and yields to continue to be largely range-bound between now and year-end 2013.
-
We believe intermediate maturity bonds provide a better risk/return trade-off compared to short-term bonds.
-
We find high-yield municipal bonds attractive, but high-quality municipal bonds possess more attractive valuations and compelling taxable-equivalent yields.
-
A modest rise in yields to start November shows the bond market remains sensitive to tapering fears, but clarity from economic data, Washington, and the Fed may take months to become evident.
-
Higher-yielding, fundamentally sound segments of the bond market such as high-yield bonds, bank loans, and preferred securities remain among the more attractive fixed income options.
-
Among high-quality bonds, we favor investment-grade corporate bonds due to the potential for higher yields and good fundamentals.
All performance referenced herein is as of November 19, 2013, unless otherwise noted.
Global macro strategies risk include but are not limited to imperfect knowledge of macro events, divergent movement from macro events, loss of principal, and related geopolitical risks.
Real estate/REITs may result in potential illiquidity and there is no assurance the objectives of the program will be attained. The fast price swings of commodities will result in significant volatility in an investor’s holdings. International and emerging markets involve special risks such as currency fluctuation and political instability. The price of small and mid-cap stocks are generally more volatile than large cap stocks. Value investments can perform differently from the market as a whole. They can remain undervalued by the market for long periods of time. Precious metal investing is subject to substantial fluctuation and potential for loss. These securities may not be suitable for all investors. Alternative strategies may not be suitable for all investors and should be considered as an investment for the risk capital portion of the investor’s portfolio. The strategies employed in the management of alternative investments may accelerate the velocity of potential losses. Stock investing may involve risk including loss of principal.
Because of their narrow focus, sector investing will be subject to greater volatility than investing more broadly across many sectors and companies.
For the purposes of this publication, intermediate-term bonds have maturities between three and 10 years, and short-term bonds are those with maturities of less than three years.
All bonds are subject to market and interest rate risk if sold prior to maturity. Bond values will decline as interest rates rise and are subject to availably and change in price. High-yield/junk bonds are not investment-grade securities, involve substantial risks, and generally should be part of the diversified portfolio of sophisticated investors. Municipal interest income may be subject to the alternative minimum tax. Federally tax-free but other state and local taxes may apply. Corporate bonds are considered higher risk than government bonds but normally offer a higher yield and are subject to market, interest rate and credit risk as well as additional risks based on the quality of issuer coupon rate, price, yield, maturity, and redemption features.
______________________________________________________________________________________________________________________________
DEFINITIONS:
EQUITY AND ALTERNATIVES ASSET CLASSES
Large Growth: Stocks in the top 70% of the capitalization of the U.S. equity market are defined as Large Cap. Growth is defined based on fast growth (high growth rates for earnings,
sales, book value, and cash flow) and high valuations (high price ratios and low dividend yields).
Large Value: Stocks in the top 70% of the capitalization of the U.S. equity market are defined as Large Cap. Value is defined based on low valuations (low price ratios and high dividend yields) and slow growth (low growth rates for earnings, sales, book value, and cash flow).
Mid Growth: The U.S. mid-cap range for market capitalization typically falls between $1 billion and $8 billion and represents 20% of the total capitalization of the U.S. equity market. Growth is defined based on fast growth (high growth rates for earnings, sales, book value, and cash flow) and high valuations (high price ratios and low dividend yields).
Mid Value: The U.S. Mid Cap range for market capitalization typically falls between $1 billion and $8 billion and represents 20% of the total capitalization of the U.S. equity market. Value is defined based on low valuations (low price ratios and high dividend yields) and slow growth (low growth rates for earnings, sales, book value, and cash flow).
Small Growth: Stocks in the bottom 10% of the capitalization of the U.S. equity market are defined as Small Cap. Growth is defined based on fast growth (high growth rates for earnings, sales, book value, and cash flow) and high valuations (high price ratios and low dividend yields).
Small Value: Stocks in the bottom 10% of the capitalization of the U.S. equity market are defined as Small Cap. Value is defined based on low valuations (low price ratios and high dividend yields) and slow growth (low growth rates for earnings, sales, book value, and cash flow).
U.S. Stocks: Stock of companies domiciled in the U.S.
Large Foreign: Large-cap foreign stocks have market capitalizations greater than $5 billion. The majority of the holdings in the large foreign category are in the MSCI EAFE Index.
Small Foreign: Small-cap foreign stocks typically have market capitalizations of $250M to $1B. The majority of the holdings in the small foreign category are in the MSCI Small Cap EAFE Index.
Emerging Markets: Stocks of a single developing country or a grouping of developing countries. For the most part, these countries are in Eastern Europe, Africa, the Middle East, Latin America, the Far East and Asia.
REITs: REITs are companies that develop and manage real-estate properties. There are several different types of REITs, including apartment, factory-outlet, health-care, hotel, industrial, mortgage, office, and shopping center REITs. This would also include real-estate operating companies.
Commodities – Industrial Metals: Stocks in companies that mine base metals such as copper, aluminum and iron ore. Also included are the actual metals themselves. Industrial metals companies are typically based in North America, Australia, or South Africa.
Commodities – Precious Metals: Stocks of companies that do gold- silver-, platinum-, and base-metal-mining. Precious-metals companies are typically based in North America, Australia, or South Africa.
Commodities – Energy: Stocks of companies that focus on integrated energy, oil & gas services, oil & gas exploration and equipment. Public energy companies are typically based in North
America, Europe, the UK, and Latin America.
Merger Arbitrage is a hedge fund strategy in which the stocks of two merging companies are simultaneously bought and sold to create a riskless profit. A merger arbitrageur looks at the risk that the merger deal will not close on time, or at all. Because of this slight uncertainty, the target company’s stock will typically sell at a discount to the price that the combined company will have when the merger is closed. This discrepancy is the arbitrageur’s profit.
Long/Short is an investment strategy generally associated with hedge funds. It involves buying long equities that are expected to increase in value and selling short equities that are expected to decrease in value.
EQUITY SECTORS
Materials: Companies that engage in a wide range of commodity-related manufacturing. Included in this sector are companies that manufacture chemicals, construction materials, glass, paper, forest products and related packaging products, metals, minerals and mining companies, including producers of steel.
Energy: Companies whose businesses are dominated by either of the following activities: The construction or provision of oil rigs, drilling equipment and other energy-related service and equipment, including seismic data collection or the exploration, production, marketing, refining and/or transportation of oil and gas products, coal and consumable fuels.
Industrials: Companies whose businesses: Manufacture and distribute capital goods, including aerospace and defense, construction, engineering and building products, electrical equipment and industrial machinery; provide commercial services and supplies, including printing, employment, environmental and office services; provide transportation services, including airlines, couriers, marine, road and rail, and transportation infrastructure.
Consumer Discretionary: Companies that tend to be the most sensitive to economic cycles. Its manufacturing segment includes automotive, household durable goods, textiles and apparel, and leisure equipment. The service segment includes hotels, restaurants and other leisure facilities, media production and services, consumer retailing and services and education services.
Technology: Companies that primarily develop software in various fields such as the Internet, applications, systems and/or database management and companies that provide information technology consulting and services. Technology hardware & equipment include manufacturers and distributors of communications equipment, computers and peripherals, electronic equipment and related instruments, and semiconductor equipment and products.
Financials: Companies involved in activities such as banking, consumer finance, investment banking and brokerage, asset management, insurance and investment, and real estate, including REITs.
Utilities: Companies considered electric, gas or water utilities, or companies that operate as independent producers and/or distributors of power.
Health Care: Companies in two main industry groups: Healthcare equipment and supplies or companies that provide healthcare-related services, including distributors of healthcare products, providers of basic healthcare services, and owners and operators of healthcare facilities and organizations or companies primarily involved in the research, development, production and marketing of pharmaceuticals and biotechnology products.
Consumer Staples: Companies whose businesses are less sensitive to economic cycles. It includes manufacturers and distributors of food, beverages and tobacco, and producers of nondurable household goods and personal products. It also includes food and drug retailing companies.
Telecommunications: Companies that provide communications services primarily through a fixed line, cellular, wireless, high bandwidth and/or fiber-optic cable network.
FIXED INCOME
Credit Quality: An individual bond’s credit rating is determined by private independent rating agencies such as Standard & Poor’s, Moody’s and Fitch. Their credit quality designations range from high (‘AAA’ to ‘AA’) to medium (‘A’ to ‘BBB’) to low (‘BB’, ‘B’, ‘CCC’, ‘CC’ to ‘C’).
Duration: A measure of the sensitivity of the price (the value of principal) of a fixed-income investment to a change in interest rates. Duration is expressed as a number of years. Rising interest rates mean falling bond prices, while declining interest rates mean rising bond prices. The bigger the duration number, the greater the interest-rate risk or reward for bond prices.
Munis – Short-term: Bonds issued by various state and local governments to fund public projects. The income from these bonds is generally free from federal taxes. These bonds generally have maturities of less than three years.
Munis – Intermediate: Bonds issued by various state and local governments to fund public projects. The income from these bonds is generally free from federal taxes. These bonds generally have maturities of between 3 and 10 years.
Munis – Long-term: Bonds issued by various state and local governments to fund public projects. The income from these bonds is generally free from federal taxes. These bonds generally have maturities of more than 10 years.
Munis – High-yield: Bonds issued by various state and local governments to fund public projects. The income from these bonds is generally free from federal taxes. These bonds generally offer higher yields than other types of bonds, but they are also more vulnerable to economic and credit risk. These bonds are rated BB+ and below.
Treasuries: A marketable, fixed-interest U.S. government debt security. Treasury bonds make interest payments semi-annually and the income that holders receive is only taxed at the federal level.
TIPS (Treasury Inflation Protected Securities): A special type of Treasury note or bond that offers protection from inflation. Like other Treasuries, an inflation-indexed security pays interest every six months and pays the principal when the security matures. The difference is that the underlying principal is automatically adjusted for inflation as measured by the consumer price index (CPI).
Mortgage-Backed Securities: A type of asset-backed security that is secured by a mortgage or collection of mortgages. These securities must also be grouped in one of the top two ratings as determined by a accredited credit rating agency, and usually pay periodic payments that are similar to coupon payments. Furthermore, the mortgage must have originated from a regulated and authorized financial institution.
Investment-Grade Corporates: Securities issued by corporations with a credit ratning of BBB- or higher. Bond rating firms, such as Standard & Poor’s, use different designations consisting of upper- and lower-case letters ‘A’ and ‘B’ to identify a bond’s investment-grade credit quality rating. ‘AAA’ and ‘AA’ (high credit quality) and ‘A’ and ‘BBB’ (medium credit quality) are considered investment-grade.
Preferred Stocks: A class of ownership in a corporation that has a higher claim on the assets and earnings than common stock. Preferred stock generally has a dividend that must be paid out before dividends to common stockholders and the shares usually do not have voting rights.
High-Yield Corporates: Securities issued by corporations with a credit rating of BB+ and below. These bonds generally offer higher yields than investment-grade bonds, but they are also more vulnerable to economic and credit risk.
Bank Loans: In exchange for their credit risk, these floating-rate bank loans offer interest payments that typically float above a common short-term benchmark such as the London interbank offered rate, or LIBOR.
Foreign Bonds – Hedged: Non-U.S. fixed income securities generally from investment-grade issuers in developed countries, with hedged currency exposure.
Foreign Bonds – Unhedged: Non-U.S. fixed income securities normally denominated in major foreign currencies.
Emerging Market Debt: The debt of sovereigns, agencies, local issues, and corporations of emerging markets countries and subject to currency risk.
______________________________________________________________________________________________________________________________
IMPORTANT DISCLOSURES
The opinions voiced in this material are for general information only and are not intended to provide or be construed as providing specific investment advice or recommendations for any individual. To determine which investments may be appropriate for you, consult your financial advisor prior to investing. All performance referenced is historical and is no guarantee of future results. All indexes are unmanaged and cannot be invested into directly.
Past performance is no guarantee of future results.
Stock investing involves risk including loss of principal.
Preferred stock investing involves risk, which may include loss of principal.
Distressed investing involves significant risks, including a total loss of capital. The risks associated with distressed investing arise from several factors including: limited diversification, the use of leverage, limited liquidity, and the possibility that investors may be required to accept cash or securities with a value less than their original investment and/or may be required to accept payment over an extended period of time.
The Standard & Poor’s 500 Index is a capitalization-weighted index of 500 stocks designed to measure performance of the broad domestic economy through changes in the aggregate market value of 500 stocks representing all major industries.
Quantitative easing is a government monetary policy occasionally used to increase the money supply by buying government securities or other securities from the market. Quantitative easing increases the money supply by flooding financial institutions with capital in an effort to promote increased lending and liquidity.
______________________________________________________________________________________________________________________________
This research material has been prepared by LPL Financial.
To the extent you are receiving investment advice from a separately registered independent investment advisor, please note that LPL Financial is not an affiliate of and makes no representation with respect to such entity.
Not FDIC or NCUA/NCUSIF Insured | No Bank or Credit Union Guarantee | May Lose Value | Not Guaranteed by any Government Agency | Not a Bank/Credit Union Deposit
Member FINRA/SIPC




Health Care Checkup
October 1, 2013
What We Spend on Health Care
This week, health care is likely to be in the news as a key component of the 2010 Affordable Care Act (ACA). Enrollment for individuals seeking insurance coverage takes effect on October 1, as members of Congress continue to debate the merits (and funding) of the law as part of the discussion around providing funding for the federal government. We’ll leave the pros and cons of the ACA to the politicians and pundits and focus instead on the size and scope of the health care sector in the U.S. economy. In future Weekly Economic Commentaries, we’ll explore the impact of health care on the labor market, various segments of the economy, the federal budget, inflation, and the impact of demographics on health care spending. On balance, how we (as individuals and as an economy) consume, pay for, and manage the cost of health care will play a crucial role not only in the economy, but in the federal budget in the years and decades to come.
How We’re Covered
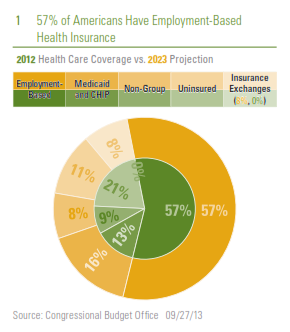
Most, though not all, of the spending patterns discussed below are driven by what type of health insurance, if any, individuals have. Using data compiled by the non-partisan Congressional Budget Office (CBO), which assigns people to their primary source of insurance (many people have multiple sources of insurance, especially those eligible for Medicare who also purchase additional insurance), we find that 156 million people (or 57% of the non-elderly population) have employment-based health insurance. By 2023, the CBO projects that this figure will increase to 162 million but will remain at 57% of the non-elderly population. At 57 million, or 21% of the non-elderly population, the uninsured made up the second-largest portion of the population in 2012. The CBO projects that under current law, the number of uninsured will drop to 31 million or 11% of the non-elderly population by 2023. More people are likely to move onto Medicaid and to the government-run health insurance exchanges as prescribed by the ACA while those purchasing non-group insurance will remain roughly steady at 8% of the non-elderly population. This potential shift in how Americans purchase health insurance has major implications for the overall economy and the outlook for the budget, which we’ll discuss in depth in future editions of the Weekly Economic Commentary.
How We Spend Our Health Care Dollars
Economy-wide (federal, state, and local governments, corporations, and individuals), Americans spent $2.7 trillion (or roughly 18% of gross domestic product [GDP]) on health care products, services, and investment in 2011, the latest data available.
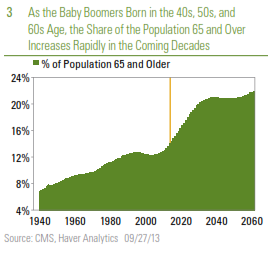
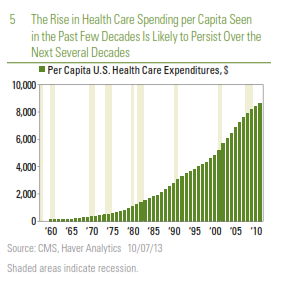
To put that in perspective, only three countries, China, Japan, and Germany, have economies larger than $2.7 trillion. Ten years ago, the figure was closer to 15% of GDP, and 30 years ago (1982) health care represented less than 10% of GDP. The rise in the percentage of the economy accounted for by health care is because spending on health care has risen much faster than GDP. Over the last 10 years, for example, health care spending has increased at a 5.5% annualized rate while overall GDP has increased at only a 4.0% pace. Although the aging population has played a role in this increase, and will continue to for many decades to come, health care spending per capita has increased 5% per year over the past 10 years to nearly $9,000, suggesting that even without the demographic shift, we are spending more on health care than ever before.
Of the $2.7 trillion spent economy-wide on health care in 2011, about one-third is on hospital services, another 25% is on professional services (doctors, dentists, clinics), and 15% is on medical products, including pharmaceuticals, medical equipment, and medical supplies. $308 billion is spent by individuals out of pocket on health care, more than is spent by individuals on new passenger cars and light trucks (approximately $240 billion in 2012), furniture and appliances (~$275 billion), or clothing (~$290 billion). Health insurance pays for another $2 trillion in health care expenses. Private insurance covers $900 billion of that $2 trillion, Medicare insurance for the elderly covers $550 billion, and Medicaid insurance for the poor covers $400 billion. The surprise here is that out-of-pocket expenses (~$300 billion) as a percent of total health care expenditures ($2.7 trillion) are just 11%, and have been moving lower for more than five decades.
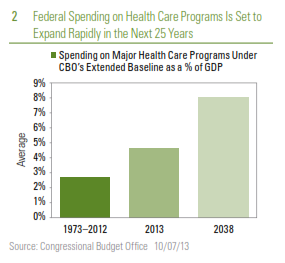
As noted above, we’ll discuss the impact of health care spending on the federal budget in a future edition of the Weekly Economic Commentary, but it’s important to note that the portion of health care spending economywide “sponsored” by governments has risen steadily over the past 25 years and is projected to continue to increase over the next 10 years and beyond, as the population ages and more people move into Medicare.
Allocation of Health Care Dollars Shifting Toward Government
In 1987, 68% of health care spending was initiated by the private sector (private businesses, households, and health-related philanthropic organizations), with one-third coming from businesses and roughly twothirds from households. Within the private sector, the ratio between businesses (one-third) and household spending (two-thirds) has remained relatively steady over the past 25 years. In 2012, just 55% of health care spending was initiated by the private sector, down from 68% in 1987, while government (federal, state, and local) accounted for 45%, up from 32% in 1987. This trend is expected to rise over the next 10 years.
Business spending in this context includes:
Household spending on health care includes:
Shifts in the mix of spending by businesses and consumers on various aspects of health care will continue to impact the economy for many years to come, and hopefully inform policy choices about who pays and how much is paid for health care in the coming decades.
Because the U.S. government is paying an ever-increasing share of health care costs, and more businesses and individuals are paying less out of pocket for health care, the actual cost and quality of health care is not as transparent as it should be. For example, we are likely to know far more about the cost and quality of the house we’re going to buy, the car we’re going to lease, and the vacation we’re going to take than we often do about our health care purchases. The overall cost of health care, combined with the lack of transparency throughout the system, will likely remain ongoing concerns for health care policymakers in the coming years and decades.
_________________________________________________________________________________________________________________________________________________________________________________
IMPORTANT DISCLOSURES
The opinions voiced in this material are for general information only and are not intended to provide specific advice or recommendations for any individual. To determine which investment(s) may be appropriate for you, consult your financial advisor prior to investing. All performance reference is historical and is no guarantee of future results. All indices are unmanaged and cannot be invested into directly.
The economic forecasts set forth in the presentation may not develop as predicted and there can be no guarantee that strategies promoted will be successful.
Stock investing involves risk including loss of principal.
Gross domestic product (GDP) is the monetary value of all the finished goods and services produced within a country’s borders in a specific time period, though GDP is usually calculated on an annual basis. It includes all of private and public consumption, government outlays, investments and exports less imports that occur within a defined territory.
The Congressional Budget Office is a non-partisan arm of Congress, established in 1974, to provide Congress with non-partisan scoring of budget proposals.
This research material has been prepared by LPL Financial.
To the extent you are receiving investment advice from a separately registered independent investment advisor, please note that LPL Financial is not an affiliate of and makes no representation with respect to such entity.
Not FDIC/NCUA Insured | Not Bank/Credit Union Guaranteed | May Lose Value | Not Guaranteed by any Government Agency | Not a Bank/Credit Union Deposit
Member FINRA/SIPC
Posted in Affordable Care Act, China, Congressional Budget Office (CBO), GDP - Gross Domestic Product, Germany, Health Care, Healthcare cost, Hospital Cost, Insurance, Japan, Medicaid, Medicare, Weekly Economic Commentary | Tagged: Affordable Care Act, CBO, China, Congress, GDP, Germany, healthcare, Healthcare costs, Hospital costs, insurance, Medical, Weekly Economic Commentary | Leave a Comment »