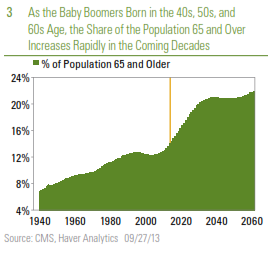
According to the U.S. Census Bureau, in 2013, 14% of the U.S. population is over 65, and by 2028, 20% of the population will be 65 or older. By 2060, 22% of the 420 million Americans will be 65 or older. Put a different way, between now and 2060, as the last of the baby boomers turn 100, the 65-and-under population will grow at just 0.4% per year, while the 65-and over population will grow nearly four times as fast, or 1.6% per year. These trends are well known to financial market participants and policymakers, since most of the changes in the future population can be explained by what birthrates were 10, 20, 30, 40, etc. years ago. Net immigration, projections of future birth rates, and, of course, life expectancy also play a role in these demographic forecasts. In this week’s Commentary, we discuss how these demographic changes (and other factors) will impact U.S. spending on health care in the decades ahead.
In the September 30, 2013 Weekly Economic Commentary, Health Care Check-Up: What We Spend on Health Care, we examined what type of insurance coverage Americans have today, how that may change over the next 10 years as a result of the Affordable Care Act (ACA), what we spend as an economy on health care, and who does most of the spending (individuals, businesses, government, etc.). Missing from the discussion was insurance coverage for the elderly portion of the population that qualifies for Medicare. The rise in the portion of the population over 65 years of age — from 14% today to 20% by 2028 — will be a big driver of health care spending, federal government spending, and the federal budget deficit over the next several decades, but it may not be the most important driver. Under current law, the non-partisan Congressional Budget Office (CBO) projects that the overall budget deficit as a percentage of gross domestic product (GDP) is expected to fall from around 4.5% of GDP in 2013 to around 2.0% to 2.5% of GDP by 2015 through 2017. In the following years, an increase in spending on Medicare, Medicaid, and Social Security, as well as other “mandatory” federal programs, will drive the deficit higher again. By 2023, the CBO projects that the deficit will be 3.5% of GDP, or close to $900 billion, citing “the pressures of an aging population, rising health care costs, and an expansion of federal subsidies for health insurance.” But which of these factors is the biggest driver of this increase?
Shifting Insurance Needs and Impact on Federal Spending
In its recent (September 2013) publication, “The 2013 Long Term Budget Outlook,” the CBO looks beyond its usual 10-year forecast horizon and projects federal spending and revenues out to 2038, and notes that “the future size and composition of the U.S. population will affect federal tax revenues, federal spending, and the performance of the economy — for example, by influencing the size of the labor force and the number of beneficiaries of programs such as Medicare and Social Security.”
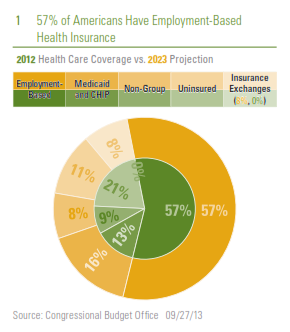
Today, 52 million people are covered by Medicare, and another 57 million are covered by Medicaid. Medicare provides coverage for the elderly and also covers several million non-elderly people. Medicaid covers a variety of low-income people, including pregnant women, children, parents, other caretaker relatives, and elderly and disabled individuals. As we noted in last week’s Weekly Economic Commentary, today around 156 million people have employment-based health care and another 9 million buy their primary health insurance on their own in the private market. Fifty-seven million people are uninsured. Figure 1 shows how the CBO expects the health care insurance market for non-elderly persons to shift over the next 10 years as a result of the ACA.
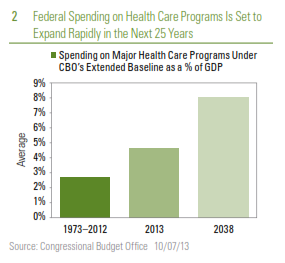
Federal spending on its major health care programs — Medicare, Medicaid, the Children’s Health Insurance Program, and subsidies offered through new health insurance exchanges — represented 4.6% of GDP in 2013, after averaging just 2.7% of GDP over the past 40 years (1973 – 2012). By 2038, spending on these major health care programs will grow to 8.0% of GDP [Figure 2]. Although outside the scope of this week’s Weekly Economic Commentary, spending on Social Security, another portion of mandatory federal spending that is largely driven by demographics, was 4.9% of federal spending in 2013 (versus 4.2% in the 1973 – 2012 period) and is expected to grow to “only” 6.2% of GDP by 2038.
Demographics Is Driving a Large Portion, but Not All the
Increase in Federal Spending on Health Care
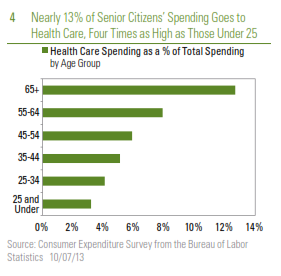
The projected increases in federal spending, as a percentage of GDP, on major health care programs is driven by demographics (the percentage of the population that is over 65 years of age), rising health care spending per beneficiary, and the provisions of the ACA that provide a subsidy to persons purchasing health care insurance via one of the health care exchanges and expand Medicaid coverage in many states. As described above and in Figure 3, the percentage of the population that is 65 or older moves from about 14% today to 21% by 2038. Not shown on the chart, but equally as important, the percentage of the population that is over 80 will nearly double from around 4% today to around 7% by 2038. This is critical because per capita spending on health care rises with age [Figure 4]. In addition, the CBO projects that spending per enrollee in federal health care programs will rise at a faster pace than overall per capita GDP in the decades ahead.
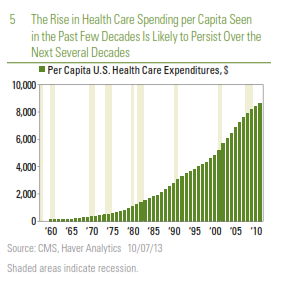
Many factors help to explain the recent increase in per capita spending on health care, and the expected rise in per capita spending in the years and decades ahead [Figure 5]. Technology that has spurred the development of new medical equipment and new drugs is a key driver of this increase in spending. These new tools allow health care providers to diagnose and treat illnesses in ways that were not possible in the past. CBO notes that somewhat counter-intuitively, while technology normally drives costs down in an industry, it has the opposite impact in health care. The general rise in incomes and the increased access to insurance are also responsible for the increase in per capita spending on health care in recent years, and they are also likely to play a role in rising per capita spending in the years ahead.
Responses to Rising Health Care Costs Will Be Critical
On balance, while demographics will be a key driver of the increase in federal expenditures on health care (and the overall federal budget deficit) in the decades to come, it is not the only driver. The CBO projects that just 35% of the increase in federal spending on health care between now and 2038 is related to the aging population. Another 40% of the increase is due to health care spending per capita rising faster than GDP per capita. CBO attributes the remainder of the increase in federal spending on major health care programs between now and 2038 (around 25%) to provisions of the ACA. After 2038, demographics and the ACA begin to fade as factors, and health care spending per capita becomes the biggest driver of federal spending on health care programs. CBO notes — and we concur — that national health care spending cannot rise more quickly than GDP forever, because as spending takes up an ever-larger share of federal spending (and household incomes), it begins to restrain spending in other critical areas. Demographics are a very important factor in determining health care costs in the decades ahead. However, more important is how (and when) the federal and state governments — and more critically — households and businesses respond to these rising costs.
___________________________________________________________________________________________________________________
IMPORTANT DISCLOSURES
The opinions voiced in this material are for general information only and are not intended to provide specific advice or recommendations for any individual. To determine which investment(s) may be appropriate for you, consult your financial advisor prior to investing. All performance reference is historical and is no guarantee of future results. All indices are unmanaged and cannot be invested into directly.
The economic forecasts set forth in the presentation may not develop as predicted and there can be no guarantee that strategies promoted will be successful.
Stock investing involves risk including loss of principal.
Gross domestic product (GDP) is the monetary value of all the finished goods and services produced within a country’s borders in a specific time period, though GDP is usually calculated on an annual basis. It includes all of private and public consumption, government outlays, investments and exports less imports that occur within a defined territory.
The Congressional Budget Office is a non-partisan arm of Congress, established in 1974, to provide Congress with non-partisan scoring of budget proposals.
