The Infation Conversation: Part 2
February 18, 2014

Exploring the Disconnect

What are the reasons for the apparent disconnect between reported inflation and what consumers and businesses see at gas stations, the mall, the grocery store, and elsewhere? The Consumer Price Index (CPI), the Personal Consumption Expenditures deflator (PCE), and other inflation indices tell one story, whereas consumers and businesses tell another. We will explore this question in today’s commentary.

We began this discussion last week, when we wrote about how the conversations most consumers and small businesses are having about higher prices for food, energy, and other items like education and medical services, are at odds with policymakers’ and the markets’ views on inflation.

Although there are likely many reasons for the disconnect in the inflation conversation, we believe most of it can be explained by the following factors:

  • Definitions;
  • Quality;
  • Frequency;
  • Weighting;
  • Age;
  • Geography; and
  • Substitutability.

Of course, not all of the differences in what consumers and businesses see and hear about higher prices can be attributed to the above factors. We examine the quality and definitional issues in depth in this week’s report, and will return to the other factors at a later date.

Definitions Disconnect

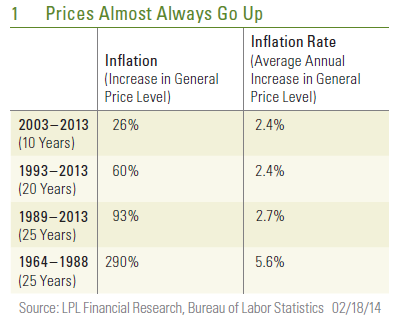
By definition, inflation is a sustained, broad-based increase in the general level of prices, but we often hear from policymakers that “there is no inflation.” According to the CPI, the general price level has increased by 26% over the past 10 years, 60% over the past 20 years, and 93% over the past 25 years. To put it another way, the general price level has nearly doubled in the past 25 years (since 1989). When policymakers say there is “no inflation” or that inflation is “well contained,” they are generally talking about the rate of increase of inflation.

Figure_1_-_2-18-2014

Over the past 10 years, the 26% increase in the general price level works out to a 2.4% annualized increase in inflation per year. The 60% increase in the general price level over the past 20 years is also equivalent to a 2.4% annualized increase in inflation per year. The 93% gain in the general price level over the past 25 years (1989 – 2013) works out to a 2.7% gain per year in inflation in each of those 25 years.

So, in general, when policymakers say there is no inflation, they do not mean that prices are not going up. Prices almost always go up. What they mean is that the rate of change in the general price level, or the inflation rate, is moderate. By comparison, in the 25 years ending in 1988, the general price level increased by 290%, and the average annual rate of change in the CPI was 5.6% per year, more than double the rate observed over the 1989 – 2013 period [Figure 1].

Quality Disconnect

In 1990, the best-selling car in America was the Honda Accord. It had power brakes, power steering, and a five-speed manual transmission. Air conditioning and AM/FM cassette stereo system were optional, and it got 21 miles per gallon (MPG) around town and 27 MPG on the highway. The manufacturer’s suggested retail price (MSRP) was $12,145.

The top-selling car in 2013 was the Toyota Camry. It also had power brakes and power steering. But air conditioning and the AM/FM stereo came standard, and it had an automatic transmission and got 25 MPG around town and 35 MPG on the highway. The 2013 Camry also came standard with:

  • A trip computer;
  • Cruise control;
  • Free maintenance for two years or 250,000 miles;
  • Free roadside assistance for two years or 25,000 miles;
  • A USB connection;
  • CD/MP3 player;
  • Bluetooth wireless;
  • Four-wheel anti-lock brakes;
  • Dual front and dual rear side-mounted airbags;
  • Traction control;
  • Daytime running lights;
  • Stability control;
  • Rear door safety locks;
  • Passenger airbag occupant sensing deactivation;
  • Intermittent wipers; and
  • VIP security system.

The MSRP for this car was $22,325, nearly double the price of the best-selling car in 1990 (the Honda Accord).

According to the New Vehicle Index within the CPI, new car prices increased by only 20% between 1990 and 2013. As noted above, the price of the top-selling car in 2013 was 84% higher than (nearly double) the price of the top-selling car in 1990. Why the disconnect [Figure 2]?

Figure_2_-_2-18-2014

The disconnect comes in the quality adjustment that the Bureau of Labor Statistics (BLS) uses to make an “apples-to-apples” comparison of the 1990 Accord and the 2013 Camry. The quality adjustment attempts to account for the fact that the 2013 Camry had many more “bells and whistles” than the 1990 Accord. The quality adjustment does not only apply to cars. A large portion of the components of the CPI have some form of quality adjustment applied to the raw prices, and the level of quality adjustment applied varies from item to item. In many cases, it’s not possible to attribute how much of the change in the CPI for a particular component is due to the quality adjustment and how much is due to the increase in the raw price. However, it is clear that this process of quality adjustment adds to the disconnect in the inflation conversation.

On balance, many factors contribute to the disconnect between what policymakers and economists say about inflation, and what consumers and businesses see and hear when they make purchases. We discussed two of the drivers of the disconnect here, but many others warrant further discussion. For policymakers like the Federal Reserve (Fed), the low rate of increase in the inflation rate expected by its policymaking arm, the Federal Open Market Committee (FOMC), this year (1.5%) and next year (1.75%) suggests that inflation is in fact “well contained.” Further, this low rate suggests the Fed can be patient as it begins to remove the monetary stimulus put into place over the past six years.

_____________________________________________________________________________________________________________________________

IMPORTANT DISCLOSURES

The opinions voiced in this material are for general information only and are not intended to provide specific advice or recommendations for any individual. To determine which investment(s) may be appropriate for you, consult your financial advisor prior to investing. All performance reference is historical and is no guarantee of future results. All indices are unmanaged and cannot be invested into directly.

The economic forecasts set forth in the presentation may not develop as predicted and there can be no guarantee that strategies promoted will be successful.

_____________________________________________________________________________________________________________________________

INDEX DESCRIPTIONS

The Consumer Price Index (CPI) is a measure of the average change over time in the prices paid by urban consumers for a market basket of consumer goods and services.

Personal Consumption Expenditures is a measure of price changes in consumer goods and services. Personal consumption expenditures consist of the actual and imputed expenditures of households; the measure includes data pertaining to durables, non-durables and services. It is essentially a measure of goods and services targeted toward individuals and consumed by individuals.

_____________________________________________________________________________________________________________________________

This research material has been prepared by LPL Financial.

To the extent you are receiving investment advice from a separately registered independent investment advisor, please note that LPL Financial is not an affiliate of and makes no representation with respect to such entity.

Not FDIC/NCUA Insured | Not Bank/Credit Union Guaranteed | May Lose Value | Not Guaranteed by any Government Agency | Not a Bank/Credit Union Deposit

Member FINRA/SIPC
 

Deficit Distraction
August 27, 2013

Deficit Distraction

In the 12 months ending July 2013, the federal government spent $3.4 trillion and took in $2.7 trillion in revenues, making the federal deficit (revenues less spending) about $725 billion, the smallest deficit recorded since late 2008. At just 3.5%, the deficit as a percent of nominal gross domestic product (GDP) over the past 12 months was also the smallest since late 2008, and stands in sharp contrast to the 10% deficit-to-GDP ratio posted in fiscal year (FY) 2009 ending September 2009 [Figure 1].

2013-08-27_Figure1

The story is much the same fiscal year to date in FY 2013, which ends on September 30, 2013. In the first 10 months of FY 2013, the budget deficit was $607 billion, or roughly 3.6% of GDP. Outlays have totaled $2.9 trillion and revenues have totaled $2.3 trillion. The first 10 months of FY 2013 saw the smallest deficit and deficit to GDP of any comparable period back to the first 10 months of FY 2008. An improved economy, a stronger labor market, spending cuts from sequestration, and recent changes to tax rates account for most of the improvement, although a few “one-time items” have also played a role. The non-partisan Congressional Budget Office (CBO), which produces an excellent update on the progress of the federal budget every month called “Monthly Budget Review” (see http://www.cbo.gov), continues to project that the budget deficit in FY 2013 will total $642 billion, or around 4.0% of GDP.

What’s Driving the Improvement in the Deficit?

Fiscal year to date in 2013, federal revenues are up 14%, while spending is down nearly 4%. Combined individual income tax receipts — which account for around 85% of federal revenues — are up 15% in the first 10 months of FY 2013 versus the same period in FY 2012. Personal income taxes account for roughly 50% of Federal revenues while taxes withheld for Social Security and Medicare account for 35% of federal revenues. A better labor market (2.3 million net new jobs were created over the past 12 months) and rising wages (wage and salary income, as measured by the monthly report on personal income and spending, is up 4% year over year), account for some of the gain. The fiscal cliff — the expiration of the Social Security payroll tax cut in January 2013 and the increase in tax rates for incomes above certain thresholds — have also boosted revenues. The rising equity market has also accounted for some of the gain in individual tax revenues: equity markets hit new all-time highs in the first half of 2013 and investors may set aside tax payments after exercising stock options or selling stocks. Corporate profits are at record levels, and corporate tax receipts are up 17% in the first 10 months of FY 2013 versus the similar period in FY 2012. Corporate tax receipts account for 10 – 15% of federal tax revenues [Figure 2].

2013-08-27_Figure2

At $2.9 trillion, federal budget outlays in the first 10 months of FY 2013 were $90 billion (or 4%) lower than in the same period in 2012. Not surprisingly, given the solid performance of the labor market noted above, federal spending on unemployment benefits was down a whopping 24% in the first 10 months of FY 2013, while defense spending (impacted in part by the sequester) fell 7%. Federal spending activities outside of defense and entitlement programs like Social Security, Medicare, and Medicaid fell 3% in the first 10 months of FY 2013 versus the first 10 months of FY 2012, but that figure is skewed lower by payments received by the federal government from the Troubled Asset Relief Program (TARP) and big payments from the large, quasi-government mortgage giants Fannie Mae and Freddie Mac that were at the center of the financial crisis. Despite the distortions, the sequester is having a modest impact in controlling non-defense discretionary spending. Interest payments on the public debt totaled $216 billion in the first 10 months of FY 2013, down 2% from the $222 billion in the similar period of FY 2012 [Figure 3].

2013-08-27_Figure3

Warning Signs

Some warning signs exist in the otherwise positive budget picture thus far in FY 2013 however, and if these warning signs continue to be ignored by policymakers, the near-term improvement in the budget picture is not likely to last. FY 2013 to date, federal spending on mandatory programs (payments set by formula written into the law) like Social Security, Medicare, and Medicaid is running above the pace of nominal GDP growth. Federal spending on Social Security benefits is up 5.4%, nearly twice the rate of nominal GDP growth over the past year (2.9%). Similarly, spending on Medicare is up 3.0% in the first 10 months of FY 2013, while Medicaid spending is up 5.7%, also about twice the rate of nominal GDP growth. The non-partisan CBO expects the improvement in the federal budget deficit to continue over the rest of this fiscal year, and for the next several fiscal years as well, through FY 2015. By then, the CBO expects the deficit as a percent of GDP to fall to 2.0%, the smallest since the 1.2% deficitto- GDP-ratio recorded in FY 2007, the last fiscal year prior to the Great Recession. From a 2.0% deficit-to-GDP ratio in FY 2015, the CBO projects that under current law, the deficit will increase to 3.2% in FY 2020 and to 3.5% by FY 2023, the last year the CBO makes a projection.

Most of the deficit deterioration in the latter half of this decade and the first half of the next occurs as a result of deterioration in the structural deficit, i.e., spending on mandatory programs like Social Security, Medicare, and Medicaid far outstripping the pace of GDP growth, mainly due to an aging population. The CBO projects that tax receipts targeted for use by those programs will only grow at the same pace as the overall economy over the next 10 years or so. Thus, the risk is that Congress and the general public will be distracted by the rapidly improving near-term budget outlook, and will not address the longer-term structural budget problem quickly enough to head off a worsening, long-term budget deficit.

____________________________________________________________________________________________________________

IMPORTANT DISCLOSURES

The opinions voiced in this material are for general information only and are not intended to provide specific advice or recommendations for any individual. To determine which investment(s) may be appropriate for you, consult your financial advisor prior to investing. All performance reference is historical and is no guarantee of future results. All indices are unmanaged and cannot be invested into directly.

Gross domestic product (GDP) is the monetary value of all the finished goods and services produced within a country’s borders in a specific time period, though GDP is usually calculated on an annual basis. It includes all of private and public consumption, government outlays, investments and exports less imports that occur within a defined territory.

The economic forecasts set forth in the presentation may not develop as predicted and there can be no guarantee that strategies promoted will be successful.

International investing involves special risks, such as currency fluctuation and political instability, and may not be suitable for all investors.

Purchasing Managers Index (PMI) is an indicator of the economic health of the manufacturing sector. The PMI index is based on five major indicators: new orders, inventory levels, production, supplier deliveries and the employment environment.

Markit is a leading, global financial information services company that provides independent data, valuations and trade processing across all asset classes in order to enhance transparency, reduce risk and improve operational efficiency. The Markit Purchasing Managers’ Index (PMIT) is a composite index based on five of the individual indexes with the following weights: New Orders – 0.3, Output – 0.25, Employment – 0.2, Suppliers’ Delivery Times – 0.15, Stocks of Items Purchased – 0.1, with the Delivery Times Index inverted so that it moves in a comparable direction.

The S&P/Case-Shiller U.S. National Home Price Index measures the change in value of the U.S. residential housing market. The S&P/Chase-Shiller U.S. National Home Price Index tracks the growth in value of real estate by following the purchase price and resale value of homes that have undergone a minimum of two arm’s-length transactions. The index is named for its creators, Karl Chase and Robert Shiller.

_____________________________________________________________________________________________________________________________________________________________________________

This research material has been prepared by LPL Financial.

To the extent you are receiving investment advice from a separately registered independent investment advisor, please note that LPL Financial is not an affiliate of and makes no representation with respect to such entity.

Not FDIC/NCUA Insured | Not Bank/Credit Union Guaranteed | May Lose Value | Not Guaranteed by any Government Agency | Not a Bank/Credit Union Deposit

Member FINRA/SIPC

Tapering Tantrum Take Two
May 28, 2013

The bond market suffered through another week of tapering tantrums with yields closing higher for a fourth consecutive week and near the highs of 2013. Federal Reserve (Fed) Chairman Ben Bernanke did little to clear the uncertainty over the timing of reducing, or tapering, bond purchases in Congressional testimony last week. Although his prepared testimony was very dovish and suggested a continuation of current bond purchases, investors focused on responses in the question and answer portion of his testimony, which fueled additional uncertainty. Bernanke suggested that tapering could begin “in the next few meetings” if labor market data continued to improve, and when asked whether the Fed may taper purchases before Labor Day, Bernanke said he did not know and that it depended on the economic data. Bernanke’s comments echoed those of the normally dovish Bill Dudley, the influential New York Fed President, who also seemed to acknowledge there is ongoing debate among Fed members about when to taper bond purchases.

The response from financial markets, as is typically the case when investors are presented with uncertainty, was lower prices and bonds, across the board, were not spared. Treasury yields continued their ascent, with the 10-year Treasury breaching the 2% yield barrier before closing the week at 2.01%, just below the 2.06% peak of 2013.

The response from financial markets, as is typically the case when investors are presented with uncertainty, was lower prices and bonds, across the board, were not spared. Treasury yields continued their ascent, with the 10-year Treasury breaching the 2% yield barrier before closing the week at 2.01%, just below the 2.06% peak of 2013.

Unlike prior rounds of bond purchases, such as QE1 and QE2, which were marked by specific end dates, QE3 is open-ended and allows for a reduction in the pace of purchases. This presents a new twist for the bond market, and pushing yields higher appeared to be a precautionary move by investors. However, the bond market is adapting quickly. Primary dealers, financial firms that are required to make markets in all Treasury securities, began to move their forecasts for timing QE tapering to the September 2013 Fed meeting, up from a prior consensus of the December 2013 Fed meeting.

A press conference follows the September 2013 Fed meeting and would allow the Fed Chairman to explain the rationale for tapering purchases. A press conference also follows the June 2013 Fed meeting, but it appears unlikely the Fed will move that soon, given the benign remarks in Bernanke’s testimony and the relatively dovish tone of meeting minutes from the May 1, 2013 Fed meeting. Should the Fed announce that tapering will begin at the end of June or in July, bond prices may decline further, and yields may rise more since the bond market has not fully priced in that outcome.

Uncertainty is likely to linger for at least another week and may exert additional upward pressure on bond yields. The current week is very light on economic data, and there are few Fed speakers of note. Investors will likely have to wait until the May 2013 employment report, which will be released on Friday, June 7, 2013, to receive additional clarity. The Fed is clearly focused on labor market gains regarding when to begin tapering bond purchases.

The past week’s events suggest the Fed appears to be focusing more on labor market improvements rather than the lower inflation witnessed so far in 2013, as measured by both the core Consumer Price Index (CPI) and core Consumer Personal Expenditures Index, which may decelerate to a record 1.0% when personal income data for April are released Friday, May 31, 2013, according to the Bloomberg consensus forecast.

We do not expect the Fed to announce a tapering of bond purchases at the June 2013 Fed meeting and therefore expect any additional rise in rates to be limited. Still-high long-term valuations suggest that Treasury weakness could continue. The sooner the Fed begins to reduce bond purchases and the more quickly bond purchases come to an ultimate end, the more rapid the potential rise in bond yields. Nonetheless, we expect the Fed to take a gradualist approach. The following factors also suggest that any rise in rates may also be limited.

  • A change in the relationship between economic data and bond yields. Recent economic data have frequently failed to meet consensus forecasts, as reflected by the Citigroup Economic Surprise Index [Figure 1]. The strength of the economy can be an important driver of bond yields. Note the close relationship between Treasury yields and whether economic data is surprising higher or lower over the years. A gap developed between the two series starting in 2011, due to the Fed’s extraordinary measures (e.g., its commitment to refrain from raising interest rates for a specified period of time), but directionally the pace of economic data is still evident as a driver of Treasury yields. Recently, the relationship between Treasury yields and economic data changed as bond investors have focused on tapering. We do not believe this change will last long and the bond market will refocus on economic data, which in our view is still too sluggish to reflect sharply lower bond prices and higher yields.

Figure_1

  • The Fed remains on hold. Fed interest rate hikes, or cuts, have been one of the key drivers of bond yields. Without an actual rate hike, the increase to short and intermediate yields in particular may be limited.
  • A tapering does not mean an end to easing. Even in the event of a tapering, the Fed will still be providing stimulus, and downward pressure on interest rates, by continuing bond purchases even if at a reduced rate.
  • Prior QE conclusions resulted in lower Treasury yields. Bond yields actually declined following the end of prior QE bond purchases [Figure 2]. Investors feared an economic slowdown absent the Fed’s stimulus, and stocks and high-yield bond prices declined while Treasury prices gained.

Figure_2

Should the rise in bond yields continue without corroboration by weaker economic data or additional clues that the Fed may reduce bond purchases as early as June 2013, a buying opportunity may emerge among high-quality bonds. In the meantime, the cautionary bond market tone may persist over the short term.

___________________________________________________________________________________________________________________________________________

IMPORTANT DISCLOSURES
The opinions voiced in this material are for general information only and are not intended to provide specific advice or recommendations for any individual. To determine which investment(s) may be appropriate for you, consult your financial advisor prior to investing. All performance referenced is historical and is no guarantee of future results. All indexes are unmanaged and cannot be invested into directly.

The economic forecasts set forth in the presentation may not develop as predicted and there can be no guarantee that strategies promoted will be successful.

Yield is the income return on an investment. This refers to the interest or dividends received from a security and is usually expressed annually as a percentage based on the investment’s cost, its current market value or its face value.

Bonds are subject to market and interest rate risk if sold prior to maturity. Bond values and yields will decline as interest rates rise, and bonds are subject to availability and change in price.

Bonds given an investment grade rating indicate a relatively low risk of default.

High-yield/junk bonds are not investment-grade securities, involve substantial risks, and generally should be part of the diversified portfolio of sophisticated investors.

Government bonds and Treasury bills are guaranteed by the U.S. government as to the timely payment of principal and interest and, if held to maturity, offer a fixed rate of return and fixed principal value. However, the value of fund shares is not guaranteed and will fluctuate.

Intermediate bonds are characterized by a maturity that is set to occur in the next three to 10 years.

Treasuries are marketable, fixed-interest U.S. government debt securities. Treasury bonds make interest payments semi-annually, and the income that holders receive is only taxed at the federal level.

Quantitative easing is a government monetary policy occasionally used to increase the money supply by buying government securities or other securities from the market. Quantitative easing increases the money supply by flooding financial institutions with capital in an effort to promote increased lending and liquidity.

This information is not intended to be a substitute for specific individualized tax, legal or investment planning advice. We suggest that you discuss your specific tax issues with a qualified tax advisor.

_____________________________________________________________________________________________________________________________________________

INDEX DESCRIPTIONS
Personal Consumption Expenditures is the measure of price changes in consumer goods and services. Personal consumption expenditures consist of the actual and imputed expenditures of households; the measure includes data pertaining to durables, non-durables and services. It is essentially a measure of goods and services targeted toward individuals and consumed by individuals.

Citigroup Economic Surprise Index (CESI) measures the variation in the gap between the expectations and the real economic data. This research material has been prepared by LPL Financial.

The Consumer Price Index (CPI) is a measure of the average change over time in the prices paid by urban consumers for a market basket of consumer goods and services.

______________________________________________________________________________________________________________________________________________

This research material has been prepared by LPL Financial.

To the extent you are receiving investment advice from a separately registered independent investment advisor, please note that LPL Financial is
not an affiliate of and makes no representation with respect to such entity.

Not FDIC/NCUA Insured | Not Bank/Credit Union Guaranteed | May Lose Value | Not Guaranteed by any Government Agency | Not a Bank/Credit Union Deposit

Listening to the leaders
May 14, 2013

Leading Indicators Continue to Point to Slow Economic Growth, but no Recession

The April Index of Leading Economic Indicators (LEI), due out on Friday, May 17, 2013, caps off a busy week for economic reports in the United States. This week includes reports on:

  • The consumer: Retail sales for April 2013 and the University of MichiganIndex of Consumer Sentiment for early May 2013;
  • Housing: Housing starts and building permits for April 2013 and the National Association of Homebuilders sentiment index for May 2013;
  • Manufacturing: Empire State Manufacturing Index for May, the Philadelphia Fed Manufacturing Index for May 2013, industrial production and capacity utilization for April 2013; and
  • Inflation: Consumer Price Index (CPI) and Producer Price Index (PPI) for April 2013.

On balance, these reports are likely to continue to show that the U.S. economy is growing at around 2.0% in the second quarter of 2013, that inflation remains muted, and that the odds of a recession in the next year to 18 months remains low. Policymakers at the Federal Reserve (Fed) will digest all of this data, and likely conclude that its quantitative easing (QE) program — the purchase of $85 billion per month of Treasury securities — should continue over the remainder of 2013.

1-We_Continue_to_Expect_the_Facts

LEI Updates

If you have not seen the LEI lately, there have been several changes made to its components, although as before, virtually all of the components of the LEI are known before the data are actually released. So in theory, the LEI itself should not be a surprise to market participants, the media, or pundits. Of course, that will not prevent anyone from ascribing movements in financial markets on Friday, May 17 to the LEI data, but we are always quick to point out that the S&P 500 itself is a component in the LEI.

In December 2011, the Conference Board, the private “think tank” that compiles and releases the data each month, made four changes to the LEI:

  • The Conference Board’s proprietary “Leading Credit Index” (LCI), an aggregate of several well-known financial market and credit market metrics like swap spreads, investor sentiment, margin account, etc., replaced the inflation adjusted M2 money supply.
  • The Institute for Supply Management’s (ISM) New Orders Index replaced the ISM’s Supplier Deliveries Index.
  • The U.S. Department of Census’ new orders for non-defense capital goods excluding aircraft replaced new orders for non-defense capital goods.
  • A combination of consumer expectations and business and economic conditions replace the University of Michigan’s Consumer Expectations Index.

LEI Places Very Low Odds of Recession in Next 12 Months

According to the consensus estimates compiled by Bloomberg News, the LEI is expected to post a 0.2% month-over-month gain in April 2013. The expected 0.2% month-over-month gain would put the year-over-year gain in the LEI at 2.1%. The LEI is designed to predict the future path of the economy, with a lead time of between six and 12 months. Since 1960 — 640 months or 53 years and four months — the year-over-year increase in the LEI has been at least 2.1% in 397 months. Not surprisingly, the U.S. economy was not in recession in any of those 397 months. Thus, it is highly unlikely that the economy was in recession in April 2013, despite the impact of the sequester, the fiscal cliff (spending cuts, payroll tax increases, income tax rate increases, etc.), the recession in Europe, or the slowdown in China.

But the LEI is designed to tell market participants what is likely to happen to the U.S. economy, not what has already happened. Three months after each of the 397 months that the LEI was up 2.1% or more, the economy was in recession in just two of the 397 months — both in 1973. Six months after the LEI was up by 2.1% or more on a year-over-year basis, the U.S. economy has been in recession in just six of the 397 months or 2% of the time. Looking out 12 months after the LEI was up 2.1% or more, the economy was in recession in just 27 of the 397 months, or 7% of the time. Based on this relationship, the odds of a recession within the next 18 months and two years increase to between 10% and 15%.

2_-_LEI_Suggests_a_Low_Probability_of_Recession

LPL_Financial_Research_Weekly_Calendar

On balance, the LEI says the risk of recession in the next 12 months is negligible (7%), but not zero. We would agree. But, the still-fragile state of the economy, and the uncertainty surrounding domestic fiscal policy, the recession in Europe, and the ongoing slowdown in China are telling us that the risk of recession is much higher than 7%. Our view remains that — aided by the Fed’s QE program, the early stages of a housing recovery, and a nascent manufacturing recovery — the U.S. economy is likely to grow at around 2.0% this year. The full impact of the sequester, the looming debate over the federal debt ceiling, weak exports, and ongoing contraction in both federal and state and local government spending are all acting to restrain growth, and these factors are likely to be in place for most of this year. A dramatic deterioration of the fiscal and financial situation in Europe, a fiscal or monetary policy mistake here in the United States or abroad, or an exogenous event (a major terror attack, natural disaster, etc.), among other events, may cause us to change our view.

______________________________________________________________________________________________________________________________________________

IMPORTANT DISCLOSURES
The opinions voiced in this material are for general information only and are not intended to provide specific advice or recommendations for any individual. To determine which investment(s) may be appropriate for you, consult your financial advisor prior to investing. All performance reference is historical and is no guarantee of future results. All indices are unmanaged and cannot be invested into directly.

* Over the last three quarters (third quarter of 2012, fourth quarter of 2012, and first quarter of 2013) , real GDP growth has averaged 2.0%.

Gross domestic product (GDP) is the monetary value of all the finished goods and services produced within a country’s borders in a specific time period, though GDP is usually calculated on an annual basis. It includes all of private and public consumption, government outlays, investments and exports less imports that occur within a defined territory.

The economic forecasts set forth in the presentation may not develop as predicted and there can be no guarantee that strategies promoted will be successful.

Stock investing involves risk including loss of principal.

Quantitative easing is a government monetary policy occasionally used to increase the money supply by buying government securities or other securities from the market. Quantitative easing increases the money supply by flooding financial institutions with capital in an effort to promote increased lending and liquidity.

The Federal Open Market Committee (FOMC) , a committee within the Federal Reserve System, is charged under the United States law with overseeing the nation’s open market operations (i.e., the Fed’s buying and selling of U.S. Treasury securities).

The Congressional Budget Office is a non-partisan arm of Congress, established in 1974, to provide Congress with non-partisan scoring of budget proposals.

______________________________________________________________________________________________________________________________________________

INDEX DESCRIPTIONS
The Consumer Price Index (CPI) is a measure of the average change over time in the prices paid by urban consumers for a market basket of consumer goods and services.

The Empire State Manufacturing Index is a seasonally-adjusted index that tracks the results of the Empire State Manufacturing Survey. The survey is distributed to roughly 175 manufacturing executives and asks questions intended to gauge both the current sentiment of the executives and their six-month outlook on the sector.

The Institute for Supply Management (ISM) index is based on surveys of more than 300 manufacturing firms by the Institute of Supply Management. The ISM Manufacturing Index monitors employment, production inventories, new orders, and supplier deliveries. A composite diffusion index is created that monitors conditions in national manufacturing based on the data from these surveys.

The index of leading economic indicators (LEI) is an economic variable, such as private-sector wages, that tends to show the direction of future economic activity.

The Leading Credit Index constitutes financial market indicators including bond market yield curve data, interest rate swaps, and Fed bank lending survey data.

The NAHB/Wells Fargo Housing Market Index gauges builder perceptions of current single-family home sales and sales expectations for the next six months as “good,” “fair” or “poor.” The survey also asks builders to rate traffic of prospective buyers as “high to very high,” “average,” or “low to very low.” Scores from each component are then used to calculate a seasonally adjusted index where any number over 50 indicates that more builders view conditions as good than poor.

The Philadelphia Fed Manufacturing Index is a survey produced by the Federal Reserve Bank of Philadelphia, which questions manufacturers on general business conditions. The index covers the Philadelphia, New Jersey, and Delaware region. Higher survey figures suggest higher production, which contribute to economic growth. Results are calculated as the difference between percentage scores with zero acting as the centerline point. As such, values greater than zero indicate growth, while values less than zero indicate contraction.

The Producer Price Index (PPI) program measures the average change over time in the selling prices received by domestic producers for their output. The prices included in the PPI are from the first commercial transaction for many products and some services.

Purchasing Managers’ Index (PMI) is an indicator of the economic health of the manufacturing sector. The PMI index is based on five major indicators: new orders, inventory levels, production, supplier deliveries, and the employment environment.

The University of Michigan Consumer Sentiment Index (MCSI) is a survey of consumer confidence conducted by the University of Michigan. The Michigan Consumer Sentiment Index (MCSI) uses telephone surveys to gather information on consumer expectations regarding the overall economy.

______________________________________________________________________________________________________________________________________________

This research material has been prepared by LPL Financial.
To the extent you are receiving investment advice from a separately registered independent investment advisor, please note that LPL Financial is
not an affiliate of and makes no representation with respect to such entity.

Not FDIC/NCUA Insured | Not Bank/Credit Union Guaranteed | May Lose Value | Not Guaranteed by any Government Agency | Not a Bank/Credit Union Deposit

What’s Fueling Gasoline?
April 10, 2013

This week, markets digest a variety of reports on the U.S. economy in February, March, and April 2013. Of particular interest to market participants will be the reports on producer prices and retail sales for March — both due out on Friday, April 12. The Consumer Price Index (CPI) is due out next Tuesday, April 16, 2013. The price of gasoline will feature prominently in all three reports. This time of year, gasoline prices typically garner plenty of attention from the media with the approach of the unofficial summer driving season right around the corner. Readers often want to know:

  • How have gasoline prices behaved thus far in 2013, and what might they do in the months ahead?
  • How much gasoline do we use in the United States?
  • How big an influence do gas prices have on consumer spending and the overall economy?

How Have Gasoline Prices Behaved So Far in 2013?

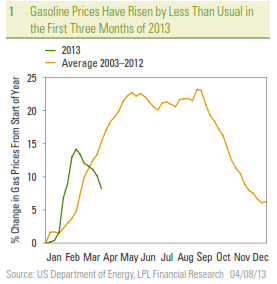
Gasoline prices are a product of global oil prices, federal, state, and local taxes, the cost of transporting the gasoline from refinery to filling station, and marketing costs. Prices can vary widely from region to region within the United States, and all prices in this report reflect the national average retail price for gasoline. Refinery shutdowns, refinery capacity, and differences in transportation and pipeline costs account for the U.S. regional differences in gasoline prices.  In the latest week, retail gasoline prices were $3.65 per gallon, and have declined by 20 cents per gallon over the past six weeks. While retail gasoline prices have increased by 28 cents per gallon this year, they remain 51 cents per gallon below the all-time high set in July 2008 at $4.16 per gallon. In a typical year, gasoline prices rise from January through the end of May, hit a plateau in the summer driving months of June, July, and August, and prices decline from the beginning of September through year-end.  Figure 1 shows that the price increase in gasoline in the first two months of 2013 was steeper than usual, but here in early April, the year-to-date price rise in gasoline prices has been more muted than usual.  Wholesale prices can often provide a window into what gasoline prices at the retail level will look like in a few weeks. Like gold, silver, copper, corn, wheat, etc., wholesale gasoline trades on commodity exchanges. Prices in the wholesale market have dropped 51 cents per gallon since mid February 2013, suggesting that the retail price is poised to drop by another $0.30 – 0.35 cents per gallon in the coming weeks, barring any major refinery outages or other disruptions. Wholesale gasoline prices are driven by global oil prices and supply and demand in the market place for gasoline from retail consumers, businesses, and government.

1_-_Gasoline_Prices_Have_Risen

How Much Gasoline Does the United States Use?

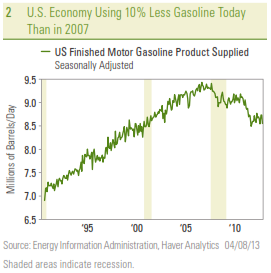
Each week, the Department of Energy produces the Weekly Petroleum Status Report (WPSR). The report has a variety of information on the nation’s petroleum industry, including  production, inventories, imports, exports, and prices. A key statistic in that report is the “gasoline supplied” figure, a good proxy for gasoline use (by all end users — consumers, businesses, industry, and government). On balance, the data reveals that the United States is using far less gasoline today than it did in 2007 [Figure 2]. In the last week of March 2013, the nation used 8.5 million barrels of gasoline per day, down 1 million barrels per day from the peak in January 2007, when the economy used 9.5 million barrels of gasoline per day. A combination of slowing economic growth, a slight increase in fuel economy among the nation’s vehicle fleet, and a sharp slowdown in miles driven (in part driven by an aging population) has helped to curtail U.S. gasoline use.

2_-_US_Economy_Using_10%_Less

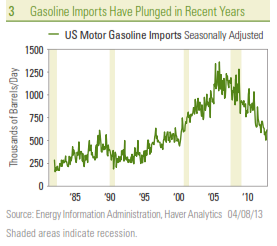
Gasoline imports (and exports) are also captured in the WPSR [Figure 3]. In March 2013, gasoline imports were around 600,000 barrels per day, levels not seen since the early 2000s. Some of the drop in imports in recent years is due to environmental standards and ethanol mandates, but our reliance on foreign gasoline is waning. Still, the vast majority (95%) of the gasoline we use is produced domestically.

3_-_Gasoline_Imports_Have_Plunged

Gasoline carries a weight of 5.5% in the CPI, an 8% weight in the Producer Price Index (PPI), and sales at gasoline service stations account for about 11% of retail sales. Although gasoline represents only a small portion of the most widely watched price indices and measures of consumer spending, spending on gasoline and gasoline prices garner plenty of attention in the media and from politicians. Why? Gasoline is one of those items (like groceries) that consumers see the price of almost every day, and most of us fill up our gas tanks regularly. Even small changes in gasoline prices can elicit plenty of news coverage and consumer backlash.

How Much Does Gasoline Influence Consumer Spending and the Overall Economy?

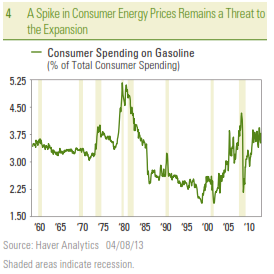
What consumers spend on gasoline is carefully measured by the U.S. Commerce Department’s personal income and spending report released each month. The last report (for February 2013) was released on March 28, 2013. This report revealed that consumers spent an annualized $431 billion on gasoline in February 2013. This was equal to 3.8% of total consumer spending ($1.1 trillion) in February 2013, and 3.2% of personal income ($1.4 trillion). At the peak of oil prices in 2008, 4.3% of U.S. consumer spending

LPL_Financial_Research_Weekly_Calendar

went to gasoline, and gasoline purchases were 3.2% of personal income. Both of these figures were well below the all-time peaks on these metrics hit during the early 1980s [Figure 4]. Another surge in energy prices relative to consumer income and spending remains a threat to the health and longevity of the current expansion, which will turn four years old in June 2013.

4_-_A_Spike_in_Consumer_Energy

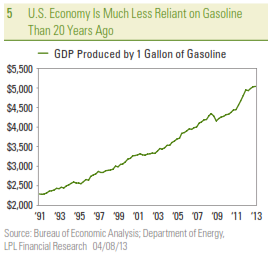
To put economy-wide gasoline use in perspective, in 1991, the U.S. economy used 7 million barrels per day of gasoline and produced gross domestic product (GDP) of $5.9 trillion, or put another way, produced $2,288 of GDP per gallon of gasoline used. In the first quarter of 2013, the U.S. economy used 8.7 millions of barrels of gasoline per day and produced $16 trillion in GDP, as the economy produced $5,036 in GDP for every gallon of gasoline used. Thus, looking back over the past 20-plus years, the U.S. economy’s output has nearly tripled, as gasoline usage increased by just 22%. In short, the U.S. economy has become much more gasoline efficient in the past 20 years, and this trend has been in place since the late 1970s/early 1980s [Figure 5]. Still, even with the emerging energy renaissance now underway, it may be years, or even decades — if ever — where the average U.S. consumer does not know (or care) what a gallon of gasoline costs.

5_-_US_Economy_is_Much_Less_Reliant

_________________________________________________________________________

IMPORTANT DISCLOSURES
The opinions voiced in this material are for general information only and are not intended to provide specific advice or recommendations for any individual. To determine which investment(s) may be appropriate for you, consult your financial advisor prior to investing. All performance reference is historical and is no guarantee of future results. All indices are unmanaged and cannot be invested into directly.

The economic forecasts set forth in the presentation may not develop as predicted and there can be no guarantee that strategies promoted will be successful.

Gross Domestic Product (GDP) is the monetary value of all the finished goods and services produced within a country’s borders in a specific time period, though GDP is usually calculated on an annual basis. It includes all of private and public consumption, government outlays, investments and exports less imports that occur within a defined territory.

Stock investing involves risk including loss of principal.

Commodity-linked investments may be more volatile and less liquid than the underlying instruments or measures, and their value may be affected by the performance of the overall commodities baskets as well as weather, disease, and regulatory developments.

The fast price swings in commodities and currencies will result in significant volatility in an investor’s holdings. Job Openings and Labor Turnover Survey (JOLTS) is a survey done by the United States Bureau of Labor Statistics to help measure job vacancies. It collects data from employers including retailers, manufacturers and different offices each month. Respondents to the survey answer quantitative and qualitative questions about their businesses’ employment, job openings, recruitment, hires and separations. The JOLTS data is published monthly and by region and industry.

______________________________________________________________________________________

INDEX DESCRIPTIONS
Producer Price Index is an inflationary indicator published by the U.S. Bureau of Labor Statistics to evaluate wholesale price levels in the economy.

The Consumer Price Index (CPI) is a measure of the average change over time in the prices paid by urban consumers for a market basket of consumer goods and services.

______________________________________________________________________________________

This research material has been prepared by LPL Financial.

To the extent you are receiving investment advice from a separately registered independent investment advisor, please note that LPL Financial is
not an affiliate of and makes no representation with respect to such entity.

Not FDIC/NCUA Insured | Not Bank/Credit Union Guaranteed | May Lose Value | Not Guaranteed by any Government Agency | Not a Bank/Credit Union Deposit