Ben’s Top 10
December 23, 2013

The Federal Reserve’s (Fed) policymaking arm, the Federal Open Market Committee (FOMC), announced that it will begin tapering, or scaling back, its bond-buying program known as quantitative easing (QE) at its final meeting of the year last week. The Fed will now purchase $75 billion per month in QE — $10 billion less than the current monthly $85 billion, citing less fiscal drag and the “cumulative progress toward maximum employment and the improvement in the outlook for labor market conditions.”

We believe the Fed made somewhat of a “trade” with the bond market. On one side, the Fed reduced QE by $10 billion per month. Conversely, the Fed delivered a bullish and confident view on the U.S. economy — signaling that it would keep interest rates lower for longer. The stock market was more than willing to forego $10 billion in purchases now (via the taper) in exchange for a bullishly confident Fed that will likely keep rates lower for longer and saw this as a good trade. After all, it is the Fed’s zero interest rate policy, not its soonto- be tapered bond purchases, that has the biggest impact on maintaining lower rates and boosting economic growth.

Fedlines: Ben’s Top 10

Unless the Fed decides to hold a press conference at its next policy meeting in late January 2014, last week’s press conference was outgoing Fed Chairman Ben Bernanke’s last. During that final press conference, Bernanke was asked about — and weighed in on — several key topics that will likely impact financial markets and the economy throughout 2014. Below, we examine Bernanke’s top 10 answers in his own words at his final press conference as Fed Chairman.

1. Is tapering tightening?

“And so I do want to reiterate that this is not intended to be a tightening.”

2. What advice do you have for Janet Yellen? (If confirmed by the Senate, Yellen will replace Bernanke as Fed Chairman in early 2014.)

“Well, I think the first thing to agree to is that Congress is our boss. The Federal Reserve is a(n) independent agency within the government. It’s important that we maintain our policy independence in order to be able to make decisions without short-term political interference.”

3. At what pace will the Fed taper?

“Sure, on the first issue of 10 billion (dollars), again, we say we are going to take further modest steps subsequently, so that would be the general range.”

4. Would the Fed do more if the economy falters? Would you increase purchases?

“But there are things that we can do. We can strengthen the guidance in various ways. And while the view of the committee was that the best way forward today was in this more qualitative approach, which incorporates elements both of the unemployment threshold and the inflation floor, that further strengthening would be possible and it’s something that is certainly not been ruled out.

And of course, asset purchases are still there to be used. We do have tools to manage a large balance sheet. We’ve made a lot of progress on that. So while — again, while we think that we can provide a high level of accommodation with a somewhat slower place, but still very high pace of asset purchases and our interest rate policy, we do have other things we can do if we need to ramp up again. That being said, we’re hopeful that the economy will continue to make progress and that we’ll begin to see the whites of the eyes of the end of the recovery and the beginning of the more normal period of economic growth.”

“Under some circumstances, yes, … we could stop purchases if the economy disappoints, we could pick them up somewhat if the economy is stronger.”

5. Why Has Recovery Been So Slow?

“It’s — of course that’s something for econometricians and historians to grapple with, but there have been a number of factors which have contributed to slower growth. They  include, for example, the observation of financial crises tend to disrupt the economy, may affect innovation, new products, new firms.

We had a big housing bust, and so the construction sector of course has been quite depressed for a while. We’ve had continuing financial disturbances in Europe and elsewhere. We’ve had very tight — on the whole, except for in 2009, we’ve had very tight fiscal policy.

People don’t appreciate how tight fiscal policy has been. At this stage in the last recession, which was a much milder recession, state, local and federal governments had hired 400,000 additional workers from the trough of the — of the recession. At the same point in this recovery, the change in state, local and federal government workers is minus 600,000.

So there’s about a million workers’ difference in how many people are — been employed at all levels of government. So fiscal policy has been tight, contractionary. So there have been a lot of headwinds. All that being said, we have been disappointed in the pace of growth, and we don’t fully understand why. Some of it may just be a slower pace of underlying potential, at least temporarily. Productivity has been disappointing. It may be that there’s been some bad luck, for example, the effects of the European crisis and the like. But compared to other advanced industrial countries, Europe, U.K., Japan — compared to other countries — advanced industrial countries recovering from financial crises, the U.S. recovery has actually been better than most.

It’s not been good. It’s not been satisfactory. Obviously, we still have a labor market where it’s not easy for people to find work. A lot of young people can’t get the experience and entree into the labor market. But I think given all of the things that we’ve faced, it’s perhaps, at least in retrospect, not shocking that the recovery has been somewhat tepid.”

6. What impact has QE had on the economy? Has QE worked?

”Well, it’s very hard to know — in terms of the study it’s very hard to know — it’s an imprecise science to try to measure these effects. You have to obviously ask yourself, you know, what would have happened in the absence of the policy. I think that study — I think it was a very interesting study, but it was on the upper end of the estimates that people have
gotten in a variety of studies looking at the effects of asset purchases.

That being said, I’m pretty comfortable with the idea that this program did, in fact, create jobs. I cited some figures. To repeat one of them, the Blue Chip forecast for unemployment in this current quarter made before we began our program was on the order of 7.8 percent, and that was before the fiscal cliff deal, which even — created even more fiscal head
winds for the economy. And of course, we’re now at 7 percent. I’m not saying that asset purchases made all that difference, but it made some of the difference. And I think it has helped to create jobs.

And you can see how it works. I mean, the asset purchases brought down long-term interest rates, brought down mortgage rates, brought down corporate bond yields, brought down car loan interest rates. And we’ve seen response in those areas as the economy has done better. Moreover, again, this has been done in the face of very tight, unusually tight fiscal policy for a recovery period. So I do think it’s been effective, but the precise size of the impact is something I think that we can very reasonably disagree about and the work will continue on. As I said before, the uncertainty about the impact and the uncertainty about the effects of ending programs and so on is one of the reasons why we have treated
this as a supplementary tool rather than as our primary tool.”

7. Are you concerned about deflation?

“Now, it is true that while we have passed the — or made significant progress on the labor market and growth hurdles, there is still this question about inflation, which is a bit of a concern, more than a bit of concern, as we indicated in our statement. Our outlook is still for inflation to go back to 2 percent. I gave you some reasons why I think that will happen. But we take that very seriously. And if inflation does not show signs of returning to target, we will take appropriate action.”

8. What impact has fiscal policy had on the recovery?

“We’ve had very tight — on the whole, except for in 2009, we’ve had very tight fiscal policy. People don’t appreciate how tight fiscal policy has been. At this stage in the last recession, which was a much milder recession, state, local and federal governments had hired 400,000 additional workers from the trough of the — of the recession. At the same point in this recovery, the change in state, local and federal government workers is minus 600,000. So there’s about a million workers’ difference in how many people are being employed at all levels of government. So fiscal policy has been tight, contractionary.”

9. What is your view on the recent budget deal?
“I will say a couple of things about this deal. One is that, relative to where we were in September and October, it certainly is nice that there has been a bipartisan deal and that it looks like it’s going to pass both houses of Congress. It’s also, at least directionally, what I have recommended in testimony, which is that it eases a bit the fiscal restraint in the next couple
of years, a period where the economy needs help to finish the recovery. And in place of that it achieves savings further out in the — in the 10-year window. So those things are positive things. Of course there’s a lot more work to be done. I have no doubt about that. But it’s certainly a better situation than we had in September and October, or in January during the fiscal cliff, for that matter. And I think it will be good for confidence if fiscal policy and congressional leaders work together to — even if — even if the outcomes are small, as this one was, it’s a good thing that they are working cooperatively and making some progress.

10. Has the large budget deficit weighed on the recovery?

“I mean, investment is driven by sales, by the need for capacity. And, you know, with a slow-growing GDP, slow-growing economy, most firms yet — do not yet feel that much pressure on their capacity to do major new projects. There’s also a variety of uncertainties out there — fiscal, regulatory tax and so on — that no doubt affects some of these calculations…I think there are a lot of factors. Usually you think that the way that a deficit or a long-term debt would affect investment would be through what’s called
crowding out, that it’s raising interest rates. But high interest rates — we may have many problems, but high interest rates is not our problem right now. There’s plenty of — particularly for larger firms, there’s plenty of credit available at low interest rates.”

Fed Watch: Employment Metrics
Outside of “Ben’s Top 10,” we learned that the Fed is indeed watching the employment metrics that we have written about several times this year:

  • The quit rate;
  • The hiring rate;
  • Job openings;
  • Wages;
  • Long-term unemployment; and
  • The participation rate.

Fed Watch: Inflation Factors
On the inflation front, Bernanke opined that some special factors are holding inflation back now and that inflation may pick up in the coming months. He said the FOMC is watching:

  • Health care costs;
  • Inflation expectations (as measured by markets and surveys of individuals and professionals);
  • Wage inflation;
  • U.S. and international GDP growth.

Figure_1_001

The Fed delivered a holiday surprise for the market — a bullish forecast via a signal that it will remain “highly accommodative” with low interest rates for longer . As we have discussed, we view the Fed’s decision as reaffirming our outlook for accelerating economic and profit growth in 2014. We continue to believe 2014 marks a return to a focus on the fundamentals of investing.

___________________________________________________________________________________________________________________________

IMPORTANT DISCLOSURES
The opinions voiced in this material are for general information only and are not intended to provide specific advice or recommendations for any individual. To determine which investment(s) may be appropriate for you, consult your financial advisor prior to investing. All performance reference is historical and is no guarantee of future results. All indices are unmanaged and cannot be invested into directly.

The economic forecasts set forth in the presentation may not develop as predicted and there can be no guarantee that strategies promoted will be successful.

Stock investing involves risk including loss of principal.

This research material has been prepared by LPL Financial.
To the extent you are receiving investment advice from a separately registered independent investment advisor, please note that LPL Financial is
not an affiliate of and makes no representation with respect to such entity.

Not FDIC/NCUA Insured | Not Bank/Credit Union Guaranteed | May Lose Value | Not Guaranteed by any Government Agency | Not a Bank/Credit Union Deposit

Member FINRA/SIPC

What Demographics Tell Us About Health Care
October 9, 2013

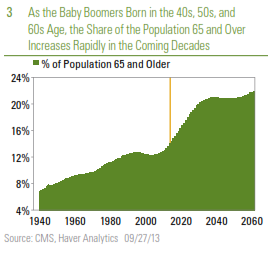
According to the U.S. Census Bureau, in 2013, 14% of the U.S. population is over 65, and by 2028, 20% of the population will be 65 or older. By 2060, 22% of the 420 million Americans will be 65 or older. Put a different way, between now and 2060, as the last of the baby boomers turn 100, the 65-and-under population will grow at just 0.4% per year, while the 65-and over population will grow nearly four times as fast, or 1.6% per year. These trends are well known to financial market participants and policymakers, since most of the changes in the future population can be explained by what birthrates were 10, 20, 30, 40, etc. years ago. Net immigration, projections of future birth rates, and, of course, life expectancy also play a role in these demographic forecasts. In this week’s Commentary, we discuss how these demographic changes (and other factors) will impact U.S. spending on health care in the decades ahead.

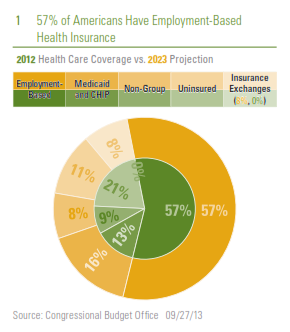
In the September 30, 2013 Weekly Economic Commentary, Health Care Check-Up: What We Spend on Health Care, we examined what type of insurance coverage Americans have today, how that may change over the next 10 years as a result of the Affordable Care Act (ACA), what we spend as an economy on health care, and who does most of the spending (individuals, businesses, government, etc.). Missing from the discussion was insurance coverage for the elderly portion of the population that qualifies for Medicare. The rise in the portion of the population over 65 years of age — from 14% today to 20% by 2028 — will be a big driver of health care spending, federal government spending, and the federal budget deficit over the next several decades, but it may not be the most important driver. Under current law, the non-partisan Congressional Budget Office (CBO) projects that the overall budget deficit as a percentage of gross domestic product (GDP) is expected to fall from around 4.5% of GDP in 2013 to around 2.0% to 2.5% of GDP by 2015 through 2017. In the following years, an increase in spending on Medicare, Medicaid, and Social Security, as well as other “mandatory” federal programs, will drive the deficit higher again. By 2023, the CBO projects that the deficit will be 3.5% of GDP, or close to $900 billion, citing “the pressures of an aging population, rising health care costs, and an expansion of federal subsidies for health insurance.” But which of these factors is the biggest driver of this increase?

2013-10-15_Figure_1

Shifting Insurance Needs and Impact on Federal Spending 

In its recent (September 2013) publication, “The 2013 Long Term Budget Outlook,” the CBO looks beyond its usual 10-year forecast horizon and projects federal spending and revenues out to 2038, and notes that “the future size and composition of the U.S. population will affect federal tax revenues, federal spending, and the performance of the economy — for example, by influencing the size of the labor force and the number of beneficiaries of programs such as Medicare and Social Security.”

Today, 52 million people are covered by Medicare, and another 57 million are covered by Medicaid. Medicare provides coverage for the elderly and also covers several million non-elderly people. Medicaid covers a variety of low-income people, including pregnant women, children, parents, other caretaker relatives, and elderly and disabled individuals. As we noted in last week’s Weekly Economic Commentary, today around 156 million people have employment-based health care and another 9 million buy their primary health insurance on their own in the private market. Fifty-seven million people are uninsured. Figure 1 shows how the CBO expects the health care insurance market for non-elderly persons to shift over the next 10 years as a result of the ACA.

2013-10-15_Figure_2

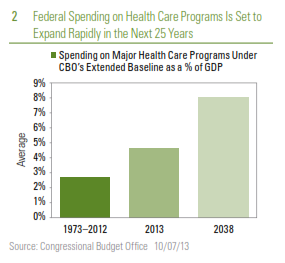
Federal spending on its major health care programs — Medicare, Medicaid, the Children’s Health Insurance Program, and subsidies offered through new health insurance exchanges — represented 4.6% of GDP in 2013, after averaging just 2.7% of GDP over the past 40 years (1973 – 2012). By 2038, spending on these major health care programs will grow to 8.0% of GDP [Figure 2]. Although outside the scope of this week’s Weekly Economic Commentary, spending on Social Security, another portion of mandatory federal spending that is largely driven by demographics, was 4.9% of federal spending in 2013 (versus 4.2% in the 1973 – 2012 period) and is expected to grow to “only” 6.2% of GDP by 2038.

Demographics Is Driving a Large Portion, but Not All the
Increase in Federal Spending on Health Care

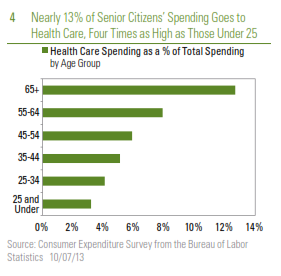
The projected increases in federal spending, as a percentage of GDP, on major health care programs is driven by demographics (the percentage of the population that is over 65 years of age), rising health care spending per beneficiary, and the provisions of the ACA that provide a subsidy to persons purchasing health care insurance via one of the health care exchanges and expand Medicaid coverage in many states. As described above and in Figure 3, the percentage of the population that is 65 or older moves from about 14% today to 21% by 2038. Not shown on the chart, but equally as important, the percentage of the population that is over 80 will nearly double from around 4% today to around 7% by 2038. This is critical because per capita spending on health care rises with age [Figure 4]. In addition, the CBO projects that spending per enrollee in federal health care programs will rise at a faster pace than overall per capita GDP in the decades ahead.

2013-10-15_Figure_3

2013-10-15_Figure_4

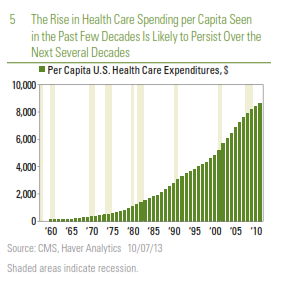
Many factors help to explain the recent increase in per capita spending on health care, and the expected rise in per capita spending in the years and decades ahead [Figure 5]. Technology that has spurred the development of new medical equipment and new drugs is a key driver of this increase in spending. These new tools allow health care providers to diagnose and treat illnesses in ways that were not possible in the past. CBO notes that somewhat counter-intuitively, while technology normally drives costs down in an industry, it has the opposite impact in health care. The general rise in incomes and the increased access to insurance are also responsible for the increase in per capita spending on health care in recent years, and they are also likely to play a role in rising per capita spending in the years ahead.

2013-10-15_Figure_5

Responses to Rising Health Care Costs Will Be Critical

On balance, while demographics will be a key driver of the increase in federal expenditures on health care (and the overall federal budget deficit) in the decades to come, it is not the only driver. The CBO projects that just 35% of the increase in federal spending on health care between now and 2038 is related to the aging population. Another 40% of the increase is due to health care spending per capita rising faster than GDP per capita. CBO attributes the remainder of the increase in federal spending on major health care programs between now and 2038 (around 25%) to provisions of the ACA. After 2038, demographics and the ACA begin to fade as factors, and health care spending per capita becomes the biggest driver of federal spending on health care programs. CBO notes — and we concur — that national health care spending cannot rise more quickly than GDP forever, because as spending takes up an ever-larger share of federal spending (and household incomes), it begins to restrain spending in other critical areas. Demographics are a very important factor in determining health care costs in the decades ahead. However, more important is how (and when) the federal and state governments — and more critically — households and businesses respond to these rising costs.

___________________________________________________________________________________________________________________

IMPORTANT DISCLOSURES

The opinions voiced in this material are for general information only and are not intended to provide specific advice or recommendations for any individual. To determine which investment(s) may be appropriate for you, consult your financial advisor prior to investing.  All performance reference is historical and is no guarantee of future results. All indices are unmanaged and cannot be invested into directly.

The economic forecasts set forth in the presentation may not develop as predicted and there can be no guarantee that strategies promoted will be successful.

Stock investing involves risk including loss of principal.

Gross domestic product (GDP) is the monetary value of all the finished goods and services produced within  a country’s borders in a specific time period, though GDP is usually calculated on an annual basis. It includes all of private and public consumption, government outlays, investments and exports less imports that occur within a defined territory.

The Congressional Budget Office is a non-partisan arm of Congress, established in 1974, to provide Congress with non-partisan scoring of budget proposals.

Deficit Distraction
August 27, 2013

Deficit Distraction

In the 12 months ending July 2013, the federal government spent $3.4 trillion and took in $2.7 trillion in revenues, making the federal deficit (revenues less spending) about $725 billion, the smallest deficit recorded since late 2008. At just 3.5%, the deficit as a percent of nominal gross domestic product (GDP) over the past 12 months was also the smallest since late 2008, and stands in sharp contrast to the 10% deficit-to-GDP ratio posted in fiscal year (FY) 2009 ending September 2009 [Figure 1].

2013-08-27_Figure1

The story is much the same fiscal year to date in FY 2013, which ends on September 30, 2013. In the first 10 months of FY 2013, the budget deficit was $607 billion, or roughly 3.6% of GDP. Outlays have totaled $2.9 trillion and revenues have totaled $2.3 trillion. The first 10 months of FY 2013 saw the smallest deficit and deficit to GDP of any comparable period back to the first 10 months of FY 2008. An improved economy, a stronger labor market, spending cuts from sequestration, and recent changes to tax rates account for most of the improvement, although a few “one-time items” have also played a role. The non-partisan Congressional Budget Office (CBO), which produces an excellent update on the progress of the federal budget every month called “Monthly Budget Review” (see http://www.cbo.gov), continues to project that the budget deficit in FY 2013 will total $642 billion, or around 4.0% of GDP.

What’s Driving the Improvement in the Deficit?

Fiscal year to date in 2013, federal revenues are up 14%, while spending is down nearly 4%. Combined individual income tax receipts — which account for around 85% of federal revenues — are up 15% in the first 10 months of FY 2013 versus the same period in FY 2012. Personal income taxes account for roughly 50% of Federal revenues while taxes withheld for Social Security and Medicare account for 35% of federal revenues. A better labor market (2.3 million net new jobs were created over the past 12 months) and rising wages (wage and salary income, as measured by the monthly report on personal income and spending, is up 4% year over year), account for some of the gain. The fiscal cliff — the expiration of the Social Security payroll tax cut in January 2013 and the increase in tax rates for incomes above certain thresholds — have also boosted revenues. The rising equity market has also accounted for some of the gain in individual tax revenues: equity markets hit new all-time highs in the first half of 2013 and investors may set aside tax payments after exercising stock options or selling stocks. Corporate profits are at record levels, and corporate tax receipts are up 17% in the first 10 months of FY 2013 versus the similar period in FY 2012. Corporate tax receipts account for 10 – 15% of federal tax revenues [Figure 2].

2013-08-27_Figure2

At $2.9 trillion, federal budget outlays in the first 10 months of FY 2013 were $90 billion (or 4%) lower than in the same period in 2012. Not surprisingly, given the solid performance of the labor market noted above, federal spending on unemployment benefits was down a whopping 24% in the first 10 months of FY 2013, while defense spending (impacted in part by the sequester) fell 7%. Federal spending activities outside of defense and entitlement programs like Social Security, Medicare, and Medicaid fell 3% in the first 10 months of FY 2013 versus the first 10 months of FY 2012, but that figure is skewed lower by payments received by the federal government from the Troubled Asset Relief Program (TARP) and big payments from the large, quasi-government mortgage giants Fannie Mae and Freddie Mac that were at the center of the financial crisis. Despite the distortions, the sequester is having a modest impact in controlling non-defense discretionary spending. Interest payments on the public debt totaled $216 billion in the first 10 months of FY 2013, down 2% from the $222 billion in the similar period of FY 2012 [Figure 3].

2013-08-27_Figure3

Warning Signs

Some warning signs exist in the otherwise positive budget picture thus far in FY 2013 however, and if these warning signs continue to be ignored by policymakers, the near-term improvement in the budget picture is not likely to last. FY 2013 to date, federal spending on mandatory programs (payments set by formula written into the law) like Social Security, Medicare, and Medicaid is running above the pace of nominal GDP growth. Federal spending on Social Security benefits is up 5.4%, nearly twice the rate of nominal GDP growth over the past year (2.9%). Similarly, spending on Medicare is up 3.0% in the first 10 months of FY 2013, while Medicaid spending is up 5.7%, also about twice the rate of nominal GDP growth. The non-partisan CBO expects the improvement in the federal budget deficit to continue over the rest of this fiscal year, and for the next several fiscal years as well, through FY 2015. By then, the CBO expects the deficit as a percent of GDP to fall to 2.0%, the smallest since the 1.2% deficitto- GDP-ratio recorded in FY 2007, the last fiscal year prior to the Great Recession. From a 2.0% deficit-to-GDP ratio in FY 2015, the CBO projects that under current law, the deficit will increase to 3.2% in FY 2020 and to 3.5% by FY 2023, the last year the CBO makes a projection.

Most of the deficit deterioration in the latter half of this decade and the first half of the next occurs as a result of deterioration in the structural deficit, i.e., spending on mandatory programs like Social Security, Medicare, and Medicaid far outstripping the pace of GDP growth, mainly due to an aging population. The CBO projects that tax receipts targeted for use by those programs will only grow at the same pace as the overall economy over the next 10 years or so. Thus, the risk is that Congress and the general public will be distracted by the rapidly improving near-term budget outlook, and will not address the longer-term structural budget problem quickly enough to head off a worsening, long-term budget deficit.

____________________________________________________________________________________________________________

IMPORTANT DISCLOSURES

The opinions voiced in this material are for general information only and are not intended to provide specific advice or recommendations for any individual. To determine which investment(s) may be appropriate for you, consult your financial advisor prior to investing. All performance reference is historical and is no guarantee of future results. All indices are unmanaged and cannot be invested into directly.

Gross domestic product (GDP) is the monetary value of all the finished goods and services produced within a country’s borders in a specific time period, though GDP is usually calculated on an annual basis. It includes all of private and public consumption, government outlays, investments and exports less imports that occur within a defined territory.

The economic forecasts set forth in the presentation may not develop as predicted and there can be no guarantee that strategies promoted will be successful.

International investing involves special risks, such as currency fluctuation and political instability, and may not be suitable for all investors.

Purchasing Managers Index (PMI) is an indicator of the economic health of the manufacturing sector. The PMI index is based on five major indicators: new orders, inventory levels, production, supplier deliveries and the employment environment.

Markit is a leading, global financial information services company that provides independent data, valuations and trade processing across all asset classes in order to enhance transparency, reduce risk and improve operational efficiency. The Markit Purchasing Managers’ Index (PMIT) is a composite index based on five of the individual indexes with the following weights: New Orders – 0.3, Output – 0.25, Employment – 0.2, Suppliers’ Delivery Times – 0.15, Stocks of Items Purchased – 0.1, with the Delivery Times Index inverted so that it moves in a comparable direction.

The S&P/Case-Shiller U.S. National Home Price Index measures the change in value of the U.S. residential housing market. The S&P/Chase-Shiller U.S. National Home Price Index tracks the growth in value of real estate by following the purchase price and resale value of homes that have undergone a minimum of two arm’s-length transactions. The index is named for its creators, Karl Chase and Robert Shiller.

_____________________________________________________________________________________________________________________________________________________________________________

This research material has been prepared by LPL Financial.

To the extent you are receiving investment advice from a separately registered independent investment advisor, please note that LPL Financial is not an affiliate of and makes no representation with respect to such entity.

Not FDIC/NCUA Insured | Not Bank/Credit Union Guaranteed | May Lose Value | Not Guaranteed by any Government Agency | Not a Bank/Credit Union Deposit

Member FINRA/SIPC
Clearing up confusion on common queries
May 7, 2013

In this week’s commentary we attempt to clear up some of the confusion around some of the most common questions we encounter regularly, including:

  • The Federal Reserve (Fed), its balance sheet, its role in the economy,and its impact on inflation;
  • The federal budget deficit;
  • The federal debt outstanding, and the debt-to-GDP ratio; and
  • The trade deficit and a related topic, the US dollar.

In many ways, the items above are related. But oftentimes, pundits, politicians, newsletter writers, bloggers, Tweeters, and even the “traditional media” will confuse or conflate one or more of these issues, and that’s usually when we get a call about it in the LPL Financial Research Department.

The Federal Reserve

The Federal Reserve (Fed) was created in 1913 by an act of Congress, The Federal Reserve Act, to provide “the nation with a safer, more flexible, and more stable monetary and financial system.” The Fed was created after a series of financial panics, bank runs, credit crunches, and booms and busts in the late 1800s and early 1900s. Over time, the Fed’s role in the economy has expanded, and currently, the Fed has a “dual mandate” from Congress (via the Full Employment and Balanced Growth Act of 1978) to conduct monetary policy that aims to promote “full employment and reasonable price stability.” In plain English, Congress created the Fed to run monetary policy, and could, at any time, vote to take away or modify the Fed’s dual mandate. In fact, Congress could run monetary policy themselves if they voted to do so, although it would be an understatement to say that markets would not embrace that outcome were it occur.

As part of its mandate from Congress, the Fed’s policymaking arm, the Federal Open Market Committee (FOMC) can raise or lower the interest rate banks charge each other for overnight loans, and expand and contract its balance sheet (quantitative easing, or QE) to achieve its goals. Since 2008, the Fed has pursued several rounds of QE — the purchase of Treasury and mortgage-backed securities (MBS) in the marketplace — by creating “reserve credits.” The Fed’s balance sheet currently stands at just over $3 trillion, and it is likely to continue to grow over the remainder of 2013 and perhaps beyond.

1_The_Fed's_balance_Sheet

The Fed’s balance sheet does not add to the federal deficit (see below), nor does the Fed set interest rates in the marketplace — beyond interest rates on overnight lending. Interest rates on everything from 3-month T-bills to 30-year Treasury bonds are set by the market, not the Fed. While the Fed is not responsible for fiscal policy or the budget deficit (see below), an argument has been made that the Fed is encouraging fiscal policymakers to overspend by buying the debt issued by the Treasury to fund the spending. In all likelihood however, Congress would be spending more than it takes in, and the Treasury would be issuing the debt to fund this overspending anyway. The difference is that instead of the Fed buying the Treasuries, other entities (the U.S. public, bond funds, pension funds, insurance companies, foreign entities, etc.) would be buying the debt, albeit at a slightly higher yield, and a slightly higher cost to the Treasury.

Our view remains that the Fed will continue its program of QE over the remainder of 2013, and keep rates at or near zero until at least 2015.

The risk of inflation from the Fed’s policies would arise if all the money the Fed is pumping into the system (mainly onto commercial banks’ balance sheets) would be lent out all at once by those banks to businesses and consumers across the country and around the world. While there has been some lending, lending activity has not been robust, and indeed the velocity of money — the rate at which money sloshes around in the economy — has fallen by a third since the onset of the financial crisis in 2007 – 08, and shows no signs of reversing. (Please see the Weekly Economic Commentary:  (Inflation Situation Revisited from March 18, 2013 for more on our view on inflation).

In short, the Fed runs monetary policy and is given that mandate by Congress. Our view remains that the Fed will continue its program of QE over the remainder of 2013, and will keep rates at or near zero until at least 2015.

Federal Budget Deficit

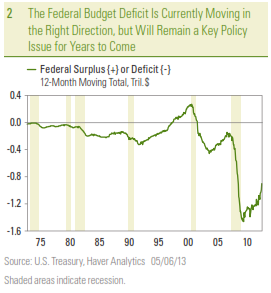
The federal budget deficit is the difference between what the Treasury collects in taxes (personal income taxes, payroll taxes, excise taxes, corporate taxes) and fees, less what the federal government spends (on defense, social programs, roads, education, etc.). Deficits increase when the federal government, authorized by Congress, spends more than it takes in, and deficits decrease when the federal government takes in more revenue than it spends in a year. A large percentage of federal spending is set on autopilot via mandatory spending on programs like Social Security, Medicare, and Medicaid (see the Weekly Economic Commentary from October 29, 2012), although smaller portions of the budget (interest payments on the federal debt and spending on non-mandatory items) are determined by Congress annually.

2_The_Federal_Budget_Deficit

Fiscal Policy

Fiscal policy (decisions on how the government should raise revenue and/or manage spending) is made by Congress, with the President having veto power over what Congress decides. The federal budget deficit (in dollar terms and as a percent of gross domestic product [GDP]), is headed lower, at least over the medium term, helped by tax increases, the sequester spending cuts, the fading impact of the $787 billion American Recovery and Reinvestment Act (ARRA) of 2009, and the improving economy, leading to higher revenues and lower spending for items such as unemployment insurance. While this improvement in the overall budget picture is welcome, and somewhat of a surprise to many, it may lead to complacency, and prevent the policymakers responsible for fiscal policy from taking the needed actions to begin to address our longer-term budget problems. While the Fed has no role in setting fiscal policy, the Fed’s own policies do impact the deficit. The Fed’s operations historically earn a profit, as the revenue it takes in via open market operations as well as by check and electronic payments processing for the financial system, far exceed its operating costs. The Fed promptly returns all profits back to the Treasury. In 2012, the Fed paid $88 billion into the Treasury, and it has consistently returned profits to the Treasury since the mid-1930s. The Fed’s monetary policy can also impact what the federal government pays in interest on the public debt. By keeping short-term rates low, the Fed is helping to keep interest payments owed by the federal government low. By keeping a lid on inflation, the Fed has a hand in keeping intermediate- and long-term interest rates low, which in turn helps to keep the interest paid by the federal government on intermediate- and longer-dated Treasuries low.

LPL_Financial_Research_Weekly_Calendar

Federal Debt

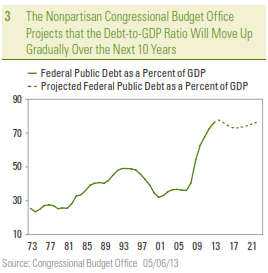
The federal debt is simply the federal deficit accumulated over the years. When the deficit increases in a given year because the federal government spends more than it takes in, the debt increases. There are several measures of federal debt, the broadest being total public debt outstanding, which was $16.8 trillion at the end of March 2013. Of that, $11.9 trillion was marketable and held by the public (and half of that is held by foreigners), while $4.9 trillion is owned by entities within the federal government. The debt-to-GDP ratio is calculated by dividing the debt (total, held by public, etc.) by nominal GDP (See the Weekly Economic Commentary: The ABCs of GDP from May 6, 2013), which stands at $16 trillion. So the United States’ debt-to-GDP ratio measured by total debt outstanding ($16.8 trillion) divided by nominal GDP ($16 trillion) is 105%. However, most market participants exclude the federal debt owed to other federal government entities and calculate the debt-to-GDP ratio as debt owned by the public ($11.9 trillion) divided by nominal GDP ($16.0) trillion for a debt-to-GDP ratio of just over 74%. The nonpartisan Congressional Budget Office projects that public debt outstanding as a percent of GDP (currently at 74% of GDP) will rise gradually to 77% of GDP by 2023, assuming current law and trend-like 2.8% real GDP growth over the next 10 years.

The structural and demographic problems that will drive the deficit over the next several decades remain in place, and the longer policymakers wait to address the problems, the more difficult (and painful) it becomes to address the problems later on.

3_The_Nonpartisan_CBO

The real problem posed by the federal debt, however, is the structural deficits in the Social Security, Medicare, and Medicaid programs, which won’t be helped much by an improving economy. The biggest risk on the federal debt is that the recent improvement in the deficit (and relative stability in the debt-to-GDP ratio) allows complacency to set in among policymakers in Washington. The structural and demographic problems that will drive the deficit over the next several decades remain in place, and the longer policymakers wait to address the problems, the more difficult (and painful) it becomes to address the problems later on.

Trade Deficit

The difference between what we export in goods and services to other countries, and what we import in goods and services from other countries is our trade deficit. Many factors influence the trade deficit, including, but not limited to:

  • The value of the dollar;
  • The relative strength of our economy to economies outside the United States;
  • The quality of goods and services made here relative to the quality of the goods and services created overseas; and
  • Trade barriers and tariffs.

The United States is still likely to run a substantial trade deficit in the years ahead, and the trade sector will continue to weigh on overall GDP growth and the value of the dollar.

We currently run a very large deficit on goods (importing $2.3 trillion and exporting just $1.6 trillion over the past 12 months), but we run a small net trade surplus (importing $435 billion and exporting $636 billion) on the service side. Congress and the President can impact trade directly (via trade agreements, tariffs) and indirectly (via enacting industry and product-specific tax and regulatory measures). A nation’s fiscal policy can have an influence on the trade deficit as well, if the fiscal policy impacts economic growth, the value of the dollar, etc. The Fed’s main impact on the trade deficit is via interest rates and the dollar. Typically, if the Fed is cutting interest rates or maintaining “easy” monetary policy, the dollar may decline in response, making our exports less expensive to the rest of the world. The nascent revival of the U.S. manufacturing sector along with the now ample supply of natural gas and related products will help to hold the trade deficit in check by reducing our dependence on foreign manufactured goods and imported energy and energy products. Despite these positives however, the United States is still likely to run a substantial trade deficit in the years ahead, and the trade sector will continue to weigh on overall GDP growth and the value of the dollar.

The Dollar

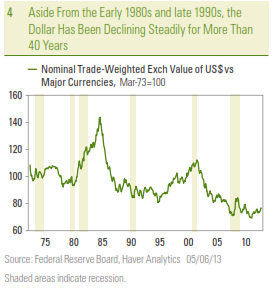
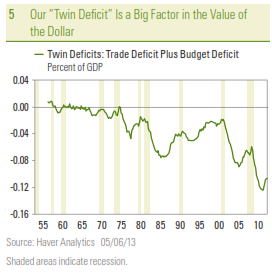
Aside from two periods in the early 1980s and late 1990s, the US dollar has been declining since it went off the gold standard in the early 1970s. The value of the dollar is set in the open market, although the Fed, Congress, and the President can have an impact on the dollar. Of the three, the Fed probably has the most direct impact on the value of the dollar, as it sets short-term interest rates, which often have a big influence on the value of a nation’s currency. The Fed’s current program of QE is increasing the number of dollars in the world, and helping to put downward pressure on the dollar. Trade policy, broad economic policy, and even foreign policy — set by Congress and/or the President — can also impact the value of the dollar. Our “twin deficits” (trade and budget) have put downward pressure on the dollar over the past several decades, and will continue to do so for the foreseeable future.

4_Aside_from_the_early_1980's

Since the United States is the world’s largest economy, most global trade is denominated in dollars, making the dollar the world’s “reserve currency.” Central banks and governments of most nations outside the United States hold reserves in dollars, although the rise of China’s economy and the sheer size of the Eurozone’s economy has eroded the dollar’s “reserve currency” status in recent years. Still, the dollar is still viewed as a “safe haven,” and in times of economic and political uncertainty around the globe, the dollar normally rises in value.

5_-_Our__Twin_Deficit_

While our “twin deficits” and the Fed’s actions to stimulate the economy are putting downward pressure on the dollar, the dollar’s status as the world’s reserve currency, and the United States’ position as the world’s largest economy and the world’s largest exporter with a diversified and dynamic economy and labor force, suggests that a sudden, sharp decline in the value of the dollar is unlikely. We continue to believe the dollar will slowly depreciate over time — continuing the trend that has been in place since the early 1970s.

_____________________________________________________________________________________________________________________________________________

IMPORTANT DISCLOSURES
The opinions voiced in this material are for general information only and are not intended to provide specific advice or recommendations for any individual. To determine which investment(s) may be appropriate for you, consult your financial advisor prior to investing. All performance reference is historical and is no guarantee of future results. All indices are unmanaged and cannot be invested into directly. Gross domestic product (GDP) is the monetary value of all the finished goods and services produced within
a country’s borders in a specific time period, though GDP is usually calculated on an annual basis. It includes all of private and public consumption, government outlays, investments and exports less imports that occur within a defined territory.

The economic forecasts set forth in the presentation may not develop as predicted and there can be no guarantee that strategies promoted will be successful.

Stock investing involves risk including loss of principal.

Quantitative easing is a government monetary policy occasionally used to increase the money supply by buying government securities or other securities from the market. Quantitative easing increases the money supply by flooding financial institutions with capital in an effort to promote increased lending and liquidity.

The Federal Open Market Committee (FOMC) , a committee within the Federal Reserve System, is charged under the United States law with overseeing the nation’s open market operations (i.e., the Fed’s buying and selling of U.S. Treasury securities).

The Congressional Budget Office is a non-partisan arm of Congress, established in 1974, to provide Congress with non-partisan scoring of budget proposals.

Government bonds and Treasury Bills are guaranteed by the U.S. government as to the timely payment of principal and interest and, if held to maturity, offer a fixed rate of return and fixed principal value. However, the value of fund shares is not guaranteed and will fluctuate.

Mortgage-Backed Securities are subject to credit, default risk, prepayment risk that acts much like call risk when you get your principal back sooner than the stated maturity, extension risk, the opposite of prepayment risk, and interest rate risk.

____________________________________________________________________________________________________________________________________________

INDEX DESCRIPTIONS
The Consumer Price Index (CPI) is a measure of the average change over time in the prices paid by urban consumers for a market basket of consumer goods and services.

Purchasing Managers’ Index (PMI) is an indicator of the economic health of the manufacturing sector. The PMI index is based on five major indicators: new orders, inventory levels, production, supplier deliveries and the employment environment.

____________________________________________________________________________________________________________________________________________

This research material has been prepared by LPL Financial.
To the extent you are receiving investment advice from a separately registered independent investment advisor, please note that LPL Financial is
not an affiliate of and makes no representation with respect to such entity.

Not FDIC/NCUA Insured | Not Bank/Credit Union Guaranteed | May Lose Value | Not Guaranteed by any Government Agency | Not a Bank/Credit Union Deposit

Budget Myths
November 20, 2012

As Congress and the President work together to avoid the looming fiscal cliff during the lame duck session of Congress, a more intransient problem remains in the background: the United States’ structural budget deficit. In our recent Weekly Economic Commentary: Budget Debate (10/29/12), we wrote about how often the budget was mentioned during the campaign season, and we pointed out that the economy and the labor market got more attention than the longer term budget issues facing the country. In late 2010, three different non-partisan organizations released plans that would put the U.S. budget on a path toward a balanced budget, using a combination of revenue/tax increases and spending cuts to achieve that goal. These organizations are:

  • The President’s National Commission on Fiscal Responsibility and Reform (commonly known as Bowles-Simpson);
  • Bipartisan Policy Center (commonly known as Rivlin-Domenici); and
  • Pew-Peterson Commission on Budget Reform.

While each plan differed on certain aspects of the longer term fix for our budget woes, they all generally agreed that there are no easy answers and no quick fixes. Both Democrats and Republicans populated the three commissions. Some hold (or once held) elected office, while others served in the federal government or were on the boards of the many think tanks in and around Washington. All were focused on finding bi-partisan solutions to the problem. In general, the three commissions concluded that in order to successfully tackle the longer term deficit problem, formerly politically untouchable areas must be on the table in any serious negotiation. These areas include:

  • Social Security;
  • Defense spending;
  • Farm subsidies;
  • Medicare;
  • Medicaid;
  • Personal and corporate tax rates; and

„„ So-called tax expenditures, more commonly known as personal and corporate tax deductions ( e.g., home mortgage interest, state and local real estate tax, or charitable contributions).

The plans did vary on the amount of revenue increases (via some combination of higher tax rates, fewer deductions, and more income subject to taxation) relative to spending cuts (across all categories of federal spending) needed to achieve a long-term path toward fiscal stability. The outcome of the November 6 election suggests that the ultimate mix of revenue increases and spending decreases that will set the country on that path is likely to be more reliant on revenue increases than spending cuts than if Governor Romney won and/or the Republicans took control of the Senate.

Absent from the list above are several budget items that receive a great deal of attention in the media, but are not a significant source of the nation’s long-term budget woes. For example, both the Bowles-Simpson plan and the Rivlin-Domenici plan noted that budgets cannot be balanced by eliminating waste or earmarks, by just cutting domestic discretionary spending, by growing our way out of the deficit, or by only raising taxes or cutting foreign aid — or all of these together. To illustrate why this is the case, we focus on the impact of waste, fraud, and abuse, domestic discretionary programs, and foreign aid have on our budget. In future commentaries, we intend to tackle some of the other items in the budget.

Fiscal Cliff Calendar of Events


Waste, Fraud, and Abuse: Impact
The libertarian Cato Institute, a Washington, D.C.-based think tank, estimates waste, fraud, and abuse in the federal budget at between $100 billion and $125 billion per year. On an absolute basis, this is an enormous amount of money, and taxpayers and the financial markets would welcome any and all steps to eliminate this from the budget. However, the annual outlays of the U.S. federal government in fiscal year 2012 were $3.5 trillion. So even if somehow the federal government were able to eliminate every dollar of waste, fraud, and abuse in the budget, federal outlays in fiscal year 2012 would still have been well over $3.3 trillion, and the federal deficit in fiscal year 2012 would have been $960 billion instead of $1 trillion.

Domestic Discretionary Spending: Impact
Let us now examine domestic discretionary spending. The federal budget can be sliced and diced several ways. One way to look at the budget is by function or cabinet post, i.e., Department of Labor, Department of the Interior, Department of Defense, etc. Another way is to group the spending categories together by legislative mandate. For example, all mandatory spending (regardless of function) is grouped together, and all non-mandatory spending (also known as discretionary spending) is grouped together. Mandatory spending is all spending that is not controlled through Congress’ annual appropriation process. For the most part, mandatory spending is based on eligibility criteria and benefit of payment rules set into law. Examples include Social Security, Medicare, Medicaid, and interest on the public debt. In recent fiscal years, mandatory spending has accounted for nearly two-thirds of all federal spending, and this slice of the pie is set to rise dramatically in the coming decade.

Discretionary spending is what Congress agrees to spend each year on things like national defense, education, Veterans Affairs, the national park system, etc. In recent fiscal years, discretionary spending has accounted for about one-third of federal budget outlays. Nondefense discretionary outlays ($528 billion in fiscal year 2011) alone account for only 10 – 15% of total outlays. Thus, even if we eliminated all nondefense discretionary spending — which would literally wipe out whole Cabinet level departments and hundreds of politically sensitive programs championed by both Republicans and Democrats — it would only make a small dent in the overall deficit.

Foreign Aid: Impact
Although not a single line item in the budget, foreign aid receives a great deal of attention in the media. A 2010 poll conducted by the University of Maryland’s Program on International Policy Attitudes found that Americans thought that the United States spends 25% of its budget on foreign aid. Foreign aid is mostly part of discretionary spending, but at around $40 – 50 billion per year accounts for roughly 1% of federal budget outlays, far less than the 25% of the budget the public thinks is spent. These outlays are found in the budgets of the U.S. Treasury, the Department of Agriculture, the State Department, and even the Department of Defense for items such as:

  • Embassy security;
  • The Peace Corps;
  • Disaster assistance;
  • Peacekeeping;
  • Direct economic support to foreign nations;
  • The World Bank, IMF, and United Nations; and
  • Global health initiatives.

Figure 2


Putting It All Together
All together, waste, fraud, and abuse, non-defense discretionary spending, and foreign aid amount to a sizable portion (more than $700 billion), roughly 20% of total federal outlays. But 80% of the budget lies outside of these three areas of the budget. Although there is certainly some merit in taking a hard look at each of these categories as part of a longer term budget reform, the real task lies in the 80% of federal outlays that are growing at an unsustainable pace and will contribute the most to our medium- and long-term budget woes in the coming decade.

LPL Financial 2012 Forecasts


IMPORTANT DISCLOSURES
The opinions voiced in this material are for general information only and are not intended to provide specific advice or recommendations for any individual. To determine which investment(s) may be appropriate for you, consult your financial advisor prior to investing. All performance reference is historical and is no guarantee of future results. All indices are unmanaged and cannot be invested into directly.

* Gross Domestic Product (GDP) is the monetary value of all the finished goods and services produced within a country’s borders in a specific time period, though GDP is usually calculated on an annual basis. It includes all of private and public consumption, government outlays, investments and exports less imports that occur within a defined territory.

^ Federal Funds Rate is the interest rate at which depository institutions actively trade balances held at the Federal Reserve, called federal funds, with each other, usually overnight, on an uncollateralized basis.

† Private Sector – the total nonfarm payroll accounts for approximately 80% of the workers who produce the entire gross domestic product of the United States. The nonfarm payroll statistic is reported monthly, on the first Friday of the month, and is used to assist government policy makers and economists determine the current state of the economy and predict future levels of economic activity. It doesn’t include:
– general government employees
– private household employees
– employees of nonprofit organizations that provide assistance to individuals
– farm employees

The economic forecasts set forth in the presentation may not develop as predicted and there can be no guarantee that strategies promoted will be successful.

Stock investing involves risk including loss of principal.

The index of leading economic indicators (LEI) is an economic variable, such as private-sector wages, that tends to show the direction of future economic activity.

International investing involves special risks, such as currency fluctuation and political instability, and may not be suitable for all investors.

INDEX DESCRIPTIONS
Purchasing Managers Index (PMI) is an indicator of the economic health of the manufacturing sector. The PMI index is based on five major indicators: new orders, inventory levels, production, supplier deliveries and the employment environment.

This research material has been prepared by LPL Financial.
To the extent you are receiving investment advice from a separately registered independent investment advisor, please note that LPL Financial is
not an affiliate of and makes no representation with respect to such entity.

Not FDIC/NCUA Insured | Not Bank/Credit Union Guaranteed | May Lose Value | Not Guaranteed by any Government Agency | Not a Bank/Credit Union Deposit

A Fiscal New Year
October 4, 2012

Weekly Market Commentary

October 4, 2012 

This week marks Golden Week, a national holiday in China. However, the United States has its own holiday to observe. This week begins a new fiscal year for the U.S. government. Unfortunately, a new year likely brings another trillion in federal debt to add to the mounting total. The proportion of U.S. federal government debt held by the public reached 70% percent of the U.S. economy in fiscal year 2012, while total federal debt crossed 100%.  Federal debt held by the public has doubled to $11 trillion today from roughly $5 trillion five years ago, before the financial crisis and Great Recession.  The turning of the calendar to a new fiscal year presents little to celebrate.

Rather than dwell on how we got here, what is most important for investors is whether demand will remain sufficient to absorb the rising supply and what the market effects may be of continued borrowing. The trillion-dollar pace of growth in federal debt requires strong and growing demand. The lack of strong demand for borrowing from the private sector has helped to support demand for the soaring supply of government debt.

The big buyers have been foreigners, led by China, as well as the Federal Reserve (Fed) through its bond buying programs. Together, they have purchased about two-thirds of the Treasuries issued during the past five years. U.S.-based investors, retirement plans, banks, and mutual funds have also been big net buyers of Treasuries and account for almost all the rest, while state and local governments have been sellers.

Over the past five years, the demand for safety by investors and lack of new debt supply from households and businesses helped interest rates move down, despite the tremendous pace of borrowing by the federal government. However, as of mid-2012, household borrowing began to grow again along with business borrowing for the first time since the financial crisis. Looking forward, if the economic recovery is sustained in 2013, demand for borrowing from all sectors—household, business, and government—may result in even more dependence on foreigners to finance the United States’ growing debt.

IMPORTANT DISCLOSURES

The opinions voiced in this material are for general information only and are not intended to provide specific advice or recommendations for any individual. To determine which investment(s) may be appropriate for you, consult your financial advisor prior to investing. All performance reference is historical and is no guarantee of future results. All indices are unmanaged and cannot be invested into directly.

The economic forecasts set forth in the presentation may not develop as predicted and there can be no guarantee that strategies promoted will be successful.

Gross Domestic Product (GDP) is the monetary value of all the finished goods and services produced within a country’s borders in a specific time period, though GDP is usually calculated on an annual basis. It includes all of private and public consumption, government outlays, investments and exports less imports that occur within a defined territory.

Quantitative Easing is a government monetary policy occasionally used to increase the money supply by buying government securities or other securities from the market. Quantitative easing increases the money supply by flooding financial institutions with capital in an effort to promote increased lending and liquidity.

This research material has been prepared by LPL Financial.

To the extent you are receiving investment advice from a separately registered independent investment advisor, please note that LPL Financial is not an affiliate of and makes no representation with respect to such entity.

Not FDIC/NCUA Insured | Not Bank/Credit Union Guaranteed |   May Lose Value | Not Guaranteed by any Government Agency | Not a Bank/Credit   Union Deposit

LPL Financial, Member FINRA/SIPC