Deficit Distraction
August 27, 2013

Deficit Distraction

In the 12 months ending July 2013, the federal government spent $3.4 trillion and took in $2.7 trillion in revenues, making the federal deficit (revenues less spending) about $725 billion, the smallest deficit recorded since late 2008. At just 3.5%, the deficit as a percent of nominal gross domestic product (GDP) over the past 12 months was also the smallest since late 2008, and stands in sharp contrast to the 10% deficit-to-GDP ratio posted in fiscal year (FY) 2009 ending September 2009 [Figure 1].

2013-08-27_Figure1

The story is much the same fiscal year to date in FY 2013, which ends on September 30, 2013. In the first 10 months of FY 2013, the budget deficit was $607 billion, or roughly 3.6% of GDP. Outlays have totaled $2.9 trillion and revenues have totaled $2.3 trillion. The first 10 months of FY 2013 saw the smallest deficit and deficit to GDP of any comparable period back to the first 10 months of FY 2008. An improved economy, a stronger labor market, spending cuts from sequestration, and recent changes to tax rates account for most of the improvement, although a few “one-time items” have also played a role. The non-partisan Congressional Budget Office (CBO), which produces an excellent update on the progress of the federal budget every month called “Monthly Budget Review” (see http://www.cbo.gov), continues to project that the budget deficit in FY 2013 will total $642 billion, or around 4.0% of GDP.

What’s Driving the Improvement in the Deficit?

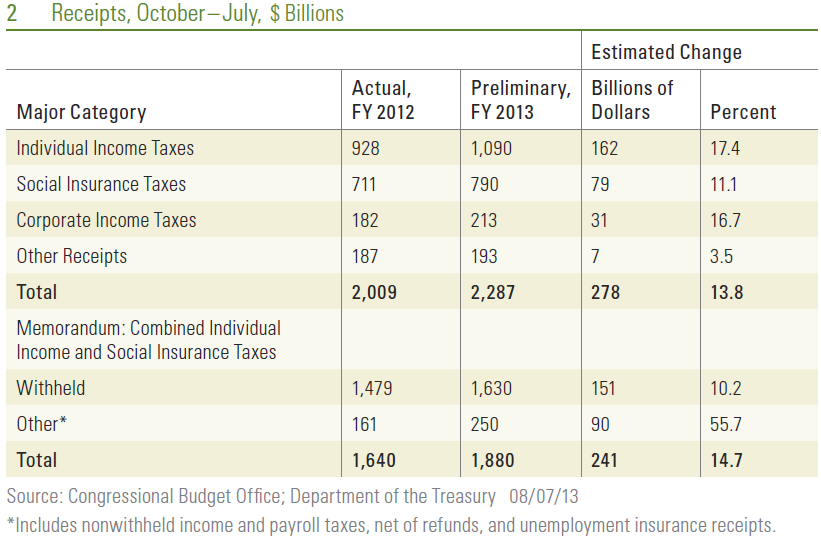
Fiscal year to date in 2013, federal revenues are up 14%, while spending is down nearly 4%. Combined individual income tax receipts — which account for around 85% of federal revenues — are up 15% in the first 10 months of FY 2013 versus the same period in FY 2012. Personal income taxes account for roughly 50% of Federal revenues while taxes withheld for Social Security and Medicare account for 35% of federal revenues. A better labor market (2.3 million net new jobs were created over the past 12 months) and rising wages (wage and salary income, as measured by the monthly report on personal income and spending, is up 4% year over year), account for some of the gain. The fiscal cliff — the expiration of the Social Security payroll tax cut in January 2013 and the increase in tax rates for incomes above certain thresholds — have also boosted revenues. The rising equity market has also accounted for some of the gain in individual tax revenues: equity markets hit new all-time highs in the first half of 2013 and investors may set aside tax payments after exercising stock options or selling stocks. Corporate profits are at record levels, and corporate tax receipts are up 17% in the first 10 months of FY 2013 versus the similar period in FY 2012. Corporate tax receipts account for 10 – 15% of federal tax revenues [Figure 2].

2013-08-27_Figure2

At $2.9 trillion, federal budget outlays in the first 10 months of FY 2013 were $90 billion (or 4%) lower than in the same period in 2012. Not surprisingly, given the solid performance of the labor market noted above, federal spending on unemployment benefits was down a whopping 24% in the first 10 months of FY 2013, while defense spending (impacted in part by the sequester) fell 7%. Federal spending activities outside of defense and entitlement programs like Social Security, Medicare, and Medicaid fell 3% in the first 10 months of FY 2013 versus the first 10 months of FY 2012, but that figure is skewed lower by payments received by the federal government from the Troubled Asset Relief Program (TARP) and big payments from the large, quasi-government mortgage giants Fannie Mae and Freddie Mac that were at the center of the financial crisis. Despite the distortions, the sequester is having a modest impact in controlling non-defense discretionary spending. Interest payments on the public debt totaled $216 billion in the first 10 months of FY 2013, down 2% from the $222 billion in the similar period of FY 2012 [Figure 3].

2013-08-27_Figure3

Warning Signs

Some warning signs exist in the otherwise positive budget picture thus far in FY 2013 however, and if these warning signs continue to be ignored by policymakers, the near-term improvement in the budget picture is not likely to last. FY 2013 to date, federal spending on mandatory programs (payments set by formula written into the law) like Social Security, Medicare, and Medicaid is running above the pace of nominal GDP growth. Federal spending on Social Security benefits is up 5.4%, nearly twice the rate of nominal GDP growth over the past year (2.9%). Similarly, spending on Medicare is up 3.0% in the first 10 months of FY 2013, while Medicaid spending is up 5.7%, also about twice the rate of nominal GDP growth. The non-partisan CBO expects the improvement in the federal budget deficit to continue over the rest of this fiscal year, and for the next several fiscal years as well, through FY 2015. By then, the CBO expects the deficit as a percent of GDP to fall to 2.0%, the smallest since the 1.2% deficitto- GDP-ratio recorded in FY 2007, the last fiscal year prior to the Great Recession. From a 2.0% deficit-to-GDP ratio in FY 2015, the CBO projects that under current law, the deficit will increase to 3.2% in FY 2020 and to 3.5% by FY 2023, the last year the CBO makes a projection.

Most of the deficit deterioration in the latter half of this decade and the first half of the next occurs as a result of deterioration in the structural deficit, i.e., spending on mandatory programs like Social Security, Medicare, and Medicaid far outstripping the pace of GDP growth, mainly due to an aging population. The CBO projects that tax receipts targeted for use by those programs will only grow at the same pace as the overall economy over the next 10 years or so. Thus, the risk is that Congress and the general public will be distracted by the rapidly improving near-term budget outlook, and will not address the longer-term structural budget problem quickly enough to head off a worsening, long-term budget deficit.

____________________________________________________________________________________________________________

IMPORTANT DISCLOSURES

The opinions voiced in this material are for general information only and are not intended to provide specific advice or recommendations for any individual. To determine which investment(s) may be appropriate for you, consult your financial advisor prior to investing. All performance reference is historical and is no guarantee of future results. All indices are unmanaged and cannot be invested into directly.

Gross domestic product (GDP) is the monetary value of all the finished goods and services produced within a country’s borders in a specific time period, though GDP is usually calculated on an annual basis. It includes all of private and public consumption, government outlays, investments and exports less imports that occur within a defined territory.

The economic forecasts set forth in the presentation may not develop as predicted and there can be no guarantee that strategies promoted will be successful.

International investing involves special risks, such as currency fluctuation and political instability, and may not be suitable for all investors.

Purchasing Managers Index (PMI) is an indicator of the economic health of the manufacturing sector. The PMI index is based on five major indicators: new orders, inventory levels, production, supplier deliveries and the employment environment.

Markit is a leading, global financial information services company that provides independent data, valuations and trade processing across all asset classes in order to enhance transparency, reduce risk and improve operational efficiency. The Markit Purchasing Managers’ Index (PMIT) is a composite index based on five of the individual indexes with the following weights: New Orders – 0.3, Output – 0.25, Employment – 0.2, Suppliers’ Delivery Times – 0.15, Stocks of Items Purchased – 0.1, with the Delivery Times Index inverted so that it moves in a comparable direction.

The S&P/Case-Shiller U.S. National Home Price Index measures the change in value of the U.S. residential housing market. The S&P/Chase-Shiller U.S. National Home Price Index tracks the growth in value of real estate by following the purchase price and resale value of homes that have undergone a minimum of two arm’s-length transactions. The index is named for its creators, Karl Chase and Robert Shiller.

_____________________________________________________________________________________________________________________________________________________________________________

This research material has been prepared by LPL Financial.

To the extent you are receiving investment advice from a separately registered independent investment advisor, please note that LPL Financial is not an affiliate of and makes no representation with respect to such entity.

Not FDIC/NCUA Insured | Not Bank/Credit Union Guaranteed | May Lose Value | Not Guaranteed by any Government Agency | Not a Bank/Credit Union Deposit

Member FINRA/SIPC

Exporting Good Old American Know-How
August 20, 2013

The United States has run a trade deficit (importing more goods and services from other countries than it exports) since the mid-1970s. Although the trade deficit narrows during recessions — imports typically fall faster than exports during a recession — the trade gap has increased over time, and currently stands at around 3.5% of gross domestic product (GDP) [Figure 1]. This large and persistent trade deficit acts as a drag on overall GDP growth, since sales of exports are added to GDP, while purchases of imports are subtracted. Along with our massive budget deficit, the trade deficit is one of the major economic challenges facing the United States and has fostered the oft repeated conventional wisdom that “we don’t make anything in this country anymore,” or “everything I buy or own is made in China.” In this week’s Weekly Economic Commentary, we focus on the details of what we import and export and how that impacts the U.S. labor market. Inside Look at U.S. Trade Deficit The trade deficit is computed by adding up the value of all the goods and services made in the United States and shipped to other countries, and subtracting the value of all the goods and services from abroad purchased in the U.S. Our large deficit on the goods side (around $759 billion in 2012*) more than offsets the trade surplus (around $213 billion in 2012) we have on the service side of the ledger. Combined, our goods and services trade deficit was $547 billion in 2012. The composition of the deficit on the goods side (what we import) contributes to the notion that “we don’t make anything in the U.S. anymore,” while the “hidden” surplus on the service side gets little attention.

2013-08-20_Figure1A

Trade Surplus and Where the Jobs Are

Figure 2 helps to illustrate the point that where we have a trade surplus (in the service sector), we create jobs, and relatively high paying jobs. As noted previously, the United States ran a $759 billion trade deficit in the goods sector in 2012. Just 1 million jobs have been added in the goods-producing sector since the trough in the labor market in early 2010. The median hourly wage in the goods-producing sector is $26.05. In contrast, we run a $213 billion trade surplus in the service sector, where 6.4 million jobs have been added since the February 2010 nadir in employment. In addition, in the areas where we have the largest service sector trade advantage (professional and technical services, motion pictures, broadcasting, performing arts and sports, insurance carriers, securities, commodities and investments, data processing and hosting, etc.) the median hourly wage ($32.91) is more than 25% above the median hourly wage in manufacturing, construction, and mining and natural resources ($26.05). In general, the jobs in the export-oriented service sector require more advanced skills, and, in most cases, advanced education and training.

2013-08-20_Figure2B

That is not to say that the goods-manufacturing sector is not creating any new jobs or will not create any in the coming years. Indeed, aided by much cheaper energy inputs, a flexible and well-educated labor force, a high unemployment rate, and higher quality control standards, along with some well-placed “arm twisting” from federal, state, and local governments, a few bright spots have emerged in the manufacturing economy in recent years. The sector has created 530,000 jobs since the trough in employment in early 2010, the best performance over a similar time frame since 1998, and more jobs in this area are likely on the way. The caveat here is that 95% of the manufacturing jobs created since early 2010 have been in durable manufacturing (autos and light trucks, appliances, fabricated metal products, and machinery), all areas that mostly require advanced skills. Just a handful of jobs have been created in the non-durable manufacturing area, where the United States does not have a particular competitive
advantage.

Consumer and Consumer-Related Items Dominate U.S.
Goods Imports

The list of our top 10 imported items is full of consumer and consumer related items like apparel, computers and electronic equipment, transportation equipment, oil and gas, petroleum and coal, and the somewhat deceiving “miscellaneous manufactured goods” category. This category of imported goods — which includes household items like jewelry, sporting goods, toys and games, office supplies, etc. — is found in the grocery stores and big box discount stores we shop in every day. We imported $102 billion of these goods in 2012 and exported just $44 billion. Although this category is not the main driver of our overall trade deficit, it is certainly one of the most visible manifestations of it, and contributes to the overall perception that “we don’t make anything here anymore.” Employment in this area of manufacturing peaked in 1978 at around 7 million workers. Today, only 4.5 million people are employed in the manufacturing of non-durable goods.

U.S. Service Exports Are Growing Rapidly

What is not as visible to most Americans (and to most pundits and media outlets) is that the United States is a net exporter of services, and that our service exports are growing rapidly, as consumers and businesses around the world demand America’s intellectual property and expertise — and culture too. Service exports were at an all-time high in 2012, and have more than doubled in the past 10 years. Eighty percent of U.S. jobs are service related, and although much is made of the maligned “hamburger flipper” service job, many U.S. service-related jobs require advanced degrees and advanced skills, and help to make possible our booming business in service exports.

Good Old American Know-How in Demand

Our top service export, business, professional, and technical services, is a fancy name for good old American know-how. At $153 billion, this would have been our fifth-largest export in 2012. It includes fields ranging from education, oil field services, and entertainment, to advertising, computer and data processing services, and database and other information services, as well as research, development, and testing services.

This category of exports is basically invisible to average Americans unless they (or someone they know) work in these fields. Nearly 19 million Americans (16% of overall employment in the United States) are employed in this category of service exports, and, unlike most other measures of employment, this category has completely recovered from the Great Recession. Of course, not all of those 19 million jobs are tied to exports, but a sizable portion is.

Exporting Hollywood

Another service export category that stands out is royalties, license fees, copyrights, and broadcast rights, with $124 billion of exports in 2012 [Figure 3]. This includes fees earned by U.S. television networks and movie studios selling licenses to foreign media outlets for overseas broadcasts of TV shows like CSI, Family Guy, Jersey Shore, Law and Order, The Big Bang Theory, ICarly and, of course, the Super Bowl, and movies like Iron Man 3, Despicable Me, Monsters University, and Fast and Furious. It also includes U.S. firms like Microsoft, Apple, Oracle, and Cisco licensing their software for use overseas. Similarly, U.S. companies garnered $43 billion in fees in 2012 by selling their patented manufacturing processes to overseas firms. Financial services (investment banking, advisory fees, trading, trust, custody, etc.) provided by Wall Street investment banks and other large commercial banks netted $76 billion in fees in 2012.

2013-08-20_Figure3

Foreigners who visited the United States in 2012 spent a whopping $126 billion on hotels, rental cars, and other goods and services while they were here, far outstripping the $83 billion American travelers spent abroad. Looking at combined goods and services export categories, travel would rank sixth. We also ran a huge trade surplus in education, where foreign students spent $25 billion in 2012 to study in the United States, while U.S. students spend just $6 billion to study at overseas colleges and universities.

With the exception of insurance services and freight and port services, the United States enjoys a trade surplus in every major category of services. Most major service export categories have experienced near 10% growth per year over the past 10 years, driven higher by fast-growing emerging market economies eager to consume good old American know-how, along with American culture (TV, movies, Times Square, Hollywood, and Disney World), and expertise ranging from accounting to software and, of course, our world-renowned colleges and universities. In short, the United States is still one of the world’s largest exporters of goods and services, and our fastest-growing exports (services) aren’t always as visible as some of the items we import and consume every day.

Looking ahead, our competitive advantage in the service sector, including good old American know-how, should help to continue to drive employment higher in this sector, especially in areas that require advanced skills. Our reliance on exports (and employment) in the less volatile service sector, which continue to be in high demand in fast-growing emerging markets worldwide, should help to promote longer U.S. economic expansions and less dependence on the boom-and-bust inventory cycles that accompany more goods-based export-dependent economies around the world. American “know-how” is our most abundant resource and should continue to make the United States an attractive destination for the world’s capital.

____________________________________________________________________________________________________________

IMPORTANT DISCLOSURES

The opinions voiced in this material are for general information only and are not intended to provide specific advice or recommendations for any individual. To determine which investment(s) may be appropriate for you, consult your financial advisor prior to investing.  All performance reference is historical and is no guarantee of future results. All indices are unmanaged and cannot be invested into directly.

The economic forecasts set forth in the presentation may not develop as predicted and there can be no guarantee that strategies promoted will be successful.

Gross domestic product (GDP) is the monetary value of all the finished goods and services produced within a country’s borders in a specific time period, though GDP is usually calculated on an annual basis. It includes all of private and public consumption, government outlays, investments and exports less imports that occur within a defined territory.

Purchasing Managers’ Index (PMI) is an indicator of the economic health of the manufacturing sector. The PMI index is based on five major indicators: new orders, inventory levels, production, supplier deliveries and the employment environment.

Quantitative easing is a government monetary policy occasionally used to increase the money supply by buying government securities or other securities from the market. Quantitative easing increases the money supply by flooding financial institutions with capital in an effort to promote increased lending and liquidity.

Markit is a leading, global financial information services company that provides independent data, valuations and trade processing across all asset classes in order to enhance transparency, reduce risk and improve operational efficiency. The Markit Purchasing Managers’ IndexT (PMIT) is a composite index based on five of the individual indexes with the following weights: New Orders – 0.3, Output – 0.25, Employment – 0.2, Suppliers’ Delivery Times – 0.15, Stocks of Items Purchased – 0.1, with the Delivery Times Index inverted so that it moves in a comparable direction.

This research material has been prepared by LPL Financial.

To the extent you are receiving investment advice from a separately registered independent investment advisor, please note that LPL Financial is not an affiliate of and makes no representation with respect to such entity.

Not FDIC/NCUA Insured | Not Bank/Credit Union Guaranteed | May Lose Value | Not Guaranteed by any Government Agency | Not a Bank/Credit Union Deposit

Member FINRA/SIPC

Clearing up confusion on common queries
May 7, 2013

In this week’s commentary we attempt to clear up some of the confusion around some of the most common questions we encounter regularly, including:

  • The Federal Reserve (Fed), its balance sheet, its role in the economy,and its impact on inflation;
  • The federal budget deficit;
  • The federal debt outstanding, and the debt-to-GDP ratio; and
  • The trade deficit and a related topic, the US dollar.

In many ways, the items above are related. But oftentimes, pundits, politicians, newsletter writers, bloggers, Tweeters, and even the “traditional media” will confuse or conflate one or more of these issues, and that’s usually when we get a call about it in the LPL Financial Research Department.

The Federal Reserve

The Federal Reserve (Fed) was created in 1913 by an act of Congress, The Federal Reserve Act, to provide “the nation with a safer, more flexible, and more stable monetary and financial system.” The Fed was created after a series of financial panics, bank runs, credit crunches, and booms and busts in the late 1800s and early 1900s. Over time, the Fed’s role in the economy has expanded, and currently, the Fed has a “dual mandate” from Congress (via the Full Employment and Balanced Growth Act of 1978) to conduct monetary policy that aims to promote “full employment and reasonable price stability.” In plain English, Congress created the Fed to run monetary policy, and could, at any time, vote to take away or modify the Fed’s dual mandate. In fact, Congress could run monetary policy themselves if they voted to do so, although it would be an understatement to say that markets would not embrace that outcome were it occur.

As part of its mandate from Congress, the Fed’s policymaking arm, the Federal Open Market Committee (FOMC) can raise or lower the interest rate banks charge each other for overnight loans, and expand and contract its balance sheet (quantitative easing, or QE) to achieve its goals. Since 2008, the Fed has pursued several rounds of QE — the purchase of Treasury and mortgage-backed securities (MBS) in the marketplace — by creating “reserve credits.” The Fed’s balance sheet currently stands at just over $3 trillion, and it is likely to continue to grow over the remainder of 2013 and perhaps beyond.

1_The_Fed's_balance_Sheet

The Fed’s balance sheet does not add to the federal deficit (see below), nor does the Fed set interest rates in the marketplace — beyond interest rates on overnight lending. Interest rates on everything from 3-month T-bills to 30-year Treasury bonds are set by the market, not the Fed. While the Fed is not responsible for fiscal policy or the budget deficit (see below), an argument has been made that the Fed is encouraging fiscal policymakers to overspend by buying the debt issued by the Treasury to fund the spending. In all likelihood however, Congress would be spending more than it takes in, and the Treasury would be issuing the debt to fund this overspending anyway. The difference is that instead of the Fed buying the Treasuries, other entities (the U.S. public, bond funds, pension funds, insurance companies, foreign entities, etc.) would be buying the debt, albeit at a slightly higher yield, and a slightly higher cost to the Treasury.

Our view remains that the Fed will continue its program of QE over the remainder of 2013, and keep rates at or near zero until at least 2015.

The risk of inflation from the Fed’s policies would arise if all the money the Fed is pumping into the system (mainly onto commercial banks’ balance sheets) would be lent out all at once by those banks to businesses and consumers across the country and around the world. While there has been some lending, lending activity has not been robust, and indeed the velocity of money — the rate at which money sloshes around in the economy — has fallen by a third since the onset of the financial crisis in 2007 – 08, and shows no signs of reversing. (Please see the Weekly Economic Commentary:  (Inflation Situation Revisited from March 18, 2013 for more on our view on inflation).

In short, the Fed runs monetary policy and is given that mandate by Congress. Our view remains that the Fed will continue its program of QE over the remainder of 2013, and will keep rates at or near zero until at least 2015.

Federal Budget Deficit

The federal budget deficit is the difference between what the Treasury collects in taxes (personal income taxes, payroll taxes, excise taxes, corporate taxes) and fees, less what the federal government spends (on defense, social programs, roads, education, etc.). Deficits increase when the federal government, authorized by Congress, spends more than it takes in, and deficits decrease when the federal government takes in more revenue than it spends in a year. A large percentage of federal spending is set on autopilot via mandatory spending on programs like Social Security, Medicare, and Medicaid (see the Weekly Economic Commentary from October 29, 2012), although smaller portions of the budget (interest payments on the federal debt and spending on non-mandatory items) are determined by Congress annually.

2_The_Federal_Budget_Deficit

Fiscal Policy

Fiscal policy (decisions on how the government should raise revenue and/or manage spending) is made by Congress, with the President having veto power over what Congress decides. The federal budget deficit (in dollar terms and as a percent of gross domestic product [GDP]), is headed lower, at least over the medium term, helped by tax increases, the sequester spending cuts, the fading impact of the $787 billion American Recovery and Reinvestment Act (ARRA) of 2009, and the improving economy, leading to higher revenues and lower spending for items such as unemployment insurance. While this improvement in the overall budget picture is welcome, and somewhat of a surprise to many, it may lead to complacency, and prevent the policymakers responsible for fiscal policy from taking the needed actions to begin to address our longer-term budget problems. While the Fed has no role in setting fiscal policy, the Fed’s own policies do impact the deficit. The Fed’s operations historically earn a profit, as the revenue it takes in via open market operations as well as by check and electronic payments processing for the financial system, far exceed its operating costs. The Fed promptly returns all profits back to the Treasury. In 2012, the Fed paid $88 billion into the Treasury, and it has consistently returned profits to the Treasury since the mid-1930s. The Fed’s monetary policy can also impact what the federal government pays in interest on the public debt. By keeping short-term rates low, the Fed is helping to keep interest payments owed by the federal government low. By keeping a lid on inflation, the Fed has a hand in keeping intermediate- and long-term interest rates low, which in turn helps to keep the interest paid by the federal government on intermediate- and longer-dated Treasuries low.

LPL_Financial_Research_Weekly_Calendar

Federal Debt

The federal debt is simply the federal deficit accumulated over the years. When the deficit increases in a given year because the federal government spends more than it takes in, the debt increases. There are several measures of federal debt, the broadest being total public debt outstanding, which was $16.8 trillion at the end of March 2013. Of that, $11.9 trillion was marketable and held by the public (and half of that is held by foreigners), while $4.9 trillion is owned by entities within the federal government. The debt-to-GDP ratio is calculated by dividing the debt (total, held by public, etc.) by nominal GDP (See the Weekly Economic Commentary: The ABCs of GDP from May 6, 2013), which stands at $16 trillion. So the United States’ debt-to-GDP ratio measured by total debt outstanding ($16.8 trillion) divided by nominal GDP ($16 trillion) is 105%. However, most market participants exclude the federal debt owed to other federal government entities and calculate the debt-to-GDP ratio as debt owned by the public ($11.9 trillion) divided by nominal GDP ($16.0) trillion for a debt-to-GDP ratio of just over 74%. The nonpartisan Congressional Budget Office projects that public debt outstanding as a percent of GDP (currently at 74% of GDP) will rise gradually to 77% of GDP by 2023, assuming current law and trend-like 2.8% real GDP growth over the next 10 years.

The structural and demographic problems that will drive the deficit over the next several decades remain in place, and the longer policymakers wait to address the problems, the more difficult (and painful) it becomes to address the problems later on.

3_The_Nonpartisan_CBO

The real problem posed by the federal debt, however, is the structural deficits in the Social Security, Medicare, and Medicaid programs, which won’t be helped much by an improving economy. The biggest risk on the federal debt is that the recent improvement in the deficit (and relative stability in the debt-to-GDP ratio) allows complacency to set in among policymakers in Washington. The structural and demographic problems that will drive the deficit over the next several decades remain in place, and the longer policymakers wait to address the problems, the more difficult (and painful) it becomes to address the problems later on.

Trade Deficit

The difference between what we export in goods and services to other countries, and what we import in goods and services from other countries is our trade deficit. Many factors influence the trade deficit, including, but not limited to:

  • The value of the dollar;
  • The relative strength of our economy to economies outside the United States;
  • The quality of goods and services made here relative to the quality of the goods and services created overseas; and
  • Trade barriers and tariffs.

The United States is still likely to run a substantial trade deficit in the years ahead, and the trade sector will continue to weigh on overall GDP growth and the value of the dollar.

We currently run a very large deficit on goods (importing $2.3 trillion and exporting just $1.6 trillion over the past 12 months), but we run a small net trade surplus (importing $435 billion and exporting $636 billion) on the service side. Congress and the President can impact trade directly (via trade agreements, tariffs) and indirectly (via enacting industry and product-specific tax and regulatory measures). A nation’s fiscal policy can have an influence on the trade deficit as well, if the fiscal policy impacts economic growth, the value of the dollar, etc. The Fed’s main impact on the trade deficit is via interest rates and the dollar. Typically, if the Fed is cutting interest rates or maintaining “easy” monetary policy, the dollar may decline in response, making our exports less expensive to the rest of the world. The nascent revival of the U.S. manufacturing sector along with the now ample supply of natural gas and related products will help to hold the trade deficit in check by reducing our dependence on foreign manufactured goods and imported energy and energy products. Despite these positives however, the United States is still likely to run a substantial trade deficit in the years ahead, and the trade sector will continue to weigh on overall GDP growth and the value of the dollar.

The Dollar

Aside from two periods in the early 1980s and late 1990s, the US dollar has been declining since it went off the gold standard in the early 1970s. The value of the dollar is set in the open market, although the Fed, Congress, and the President can have an impact on the dollar. Of the three, the Fed probably has the most direct impact on the value of the dollar, as it sets short-term interest rates, which often have a big influence on the value of a nation’s currency. The Fed’s current program of QE is increasing the number of dollars in the world, and helping to put downward pressure on the dollar. Trade policy, broad economic policy, and even foreign policy — set by Congress and/or the President — can also impact the value of the dollar. Our “twin deficits” (trade and budget) have put downward pressure on the dollar over the past several decades, and will continue to do so for the foreseeable future.

4_Aside_from_the_early_1980's

Since the United States is the world’s largest economy, most global trade is denominated in dollars, making the dollar the world’s “reserve currency.” Central banks and governments of most nations outside the United States hold reserves in dollars, although the rise of China’s economy and the sheer size of the Eurozone’s economy has eroded the dollar’s “reserve currency” status in recent years. Still, the dollar is still viewed as a “safe haven,” and in times of economic and political uncertainty around the globe, the dollar normally rises in value.

5_-_Our__Twin_Deficit_

While our “twin deficits” and the Fed’s actions to stimulate the economy are putting downward pressure on the dollar, the dollar’s status as the world’s reserve currency, and the United States’ position as the world’s largest economy and the world’s largest exporter with a diversified and dynamic economy and labor force, suggests that a sudden, sharp decline in the value of the dollar is unlikely. We continue to believe the dollar will slowly depreciate over time — continuing the trend that has been in place since the early 1970s.

_____________________________________________________________________________________________________________________________________________

IMPORTANT DISCLOSURES
The opinions voiced in this material are for general information only and are not intended to provide specific advice or recommendations for any individual. To determine which investment(s) may be appropriate for you, consult your financial advisor prior to investing. All performance reference is historical and is no guarantee of future results. All indices are unmanaged and cannot be invested into directly. Gross domestic product (GDP) is the monetary value of all the finished goods and services produced within
a country’s borders in a specific time period, though GDP is usually calculated on an annual basis. It includes all of private and public consumption, government outlays, investments and exports less imports that occur within a defined territory.

The economic forecasts set forth in the presentation may not develop as predicted and there can be no guarantee that strategies promoted will be successful.

Stock investing involves risk including loss of principal.

Quantitative easing is a government monetary policy occasionally used to increase the money supply by buying government securities or other securities from the market. Quantitative easing increases the money supply by flooding financial institutions with capital in an effort to promote increased lending and liquidity.

The Federal Open Market Committee (FOMC) , a committee within the Federal Reserve System, is charged under the United States law with overseeing the nation’s open market operations (i.e., the Fed’s buying and selling of U.S. Treasury securities).

The Congressional Budget Office is a non-partisan arm of Congress, established in 1974, to provide Congress with non-partisan scoring of budget proposals.

Government bonds and Treasury Bills are guaranteed by the U.S. government as to the timely payment of principal and interest and, if held to maturity, offer a fixed rate of return and fixed principal value. However, the value of fund shares is not guaranteed and will fluctuate.

Mortgage-Backed Securities are subject to credit, default risk, prepayment risk that acts much like call risk when you get your principal back sooner than the stated maturity, extension risk, the opposite of prepayment risk, and interest rate risk.

____________________________________________________________________________________________________________________________________________

INDEX DESCRIPTIONS
The Consumer Price Index (CPI) is a measure of the average change over time in the prices paid by urban consumers for a market basket of consumer goods and services.

Purchasing Managers’ Index (PMI) is an indicator of the economic health of the manufacturing sector. The PMI index is based on five major indicators: new orders, inventory levels, production, supplier deliveries and the employment environment.

____________________________________________________________________________________________________________________________________________

This research material has been prepared by LPL Financial.
To the extent you are receiving investment advice from a separately registered independent investment advisor, please note that LPL Financial is
not an affiliate of and makes no representation with respect to such entity.

Not FDIC/NCUA Insured | Not Bank/Credit Union Guaranteed | May Lose Value | Not Guaranteed by any Government Agency | Not a Bank/Credit Union Deposit

The ABC’s of GDP
April 30, 2013

The ABC’s of GDP

GDP = C + I + G + (X-M)

College freshmen know it — or should know it — by the end of their Economics 101 classes, but for most of us, freshman year in college remains a bit “fuzzy” for a variety of reasons. On Friday, April 26, 2013, the Bureau of Economic Analysis (BEA) of the U.S. Department of Commerce released the first estimate of gross domestic product (GDP) for the first quarter of 2013. Inflation-adjusted, or real, GDP expanded at a 2.5% seasonally adjusted annualized rate in the first quarter of 2013, after rising at just 0.4% in the fourth quarter of 2012. The 2.5% increase fell short of expectations for 3.0% growth. Over the last three quarters (third quarter of 2012, fourth quarter of 2012, and first quarter of 2013), real GDP growth has averaged 2.0%. We continue to expect GDP growth to average around 2.0% over the course of 2013.

letter_blocksAlthough consumer spending, housing, and inventory accumulation accelerated in Q113 versus Q412 and added to growth, business spending slowed dramatically, and the trade deficit widened, dampening growth.  Housing construction added 0.3 percentage points to GDP in the first quarter, marking the eighth quarter in a row that housing has added to GDP, after a five-year period (2006 – 2010) where housing was a drag on GDP.

The big story in the GDP report was again federal government spending.  Defense spending fell 11.5% annualized between Q412 and Q113, after the 22% drop in Q412 versus Q312, the largest back-to-back drop in defense spending in 60 years. The sequester, which cut federal government spending across the board beginning on March 1, 2013, contributed to a 2.0% drop in non-defense federal spending between Q412 and Q113. State and local government spending fell again, too, by 1.2% between Q413 and Q113, the second consecutive quarterly decline, and the 13th quarterly decline in state and local spending in the past 14 quarters, dating back to the end of 2009. On balance, there were few, if any signs, in the GDP report for the first quarter of 2013 that the economy will re-accelerate anytime soon.

The ABC’s of GDP
 A – (Seasonally) adjusted. GDP is reported by the BEA in several different ways, but the most commonly cited way is on a real (inflation-adjusted) seasonally adjusted annualized basis. GDP is seasonally adjusted to smooth out the fluctuation in the economy related to weather patterns, shopping patterns, holidays, school vacations, etc., to allow apples-to-apples comparisons between quarters. For example, vehicle assembly plants typically shut down in July, which would depress GDP in the third quarter (July, August, and September) relative to the second quarter (April, May, and June). Similarly, sales of jewelry spikes around Christmas and again at Valentine’s Day. Seasonally adjusting the data helps market participants to see through the swings in the seasonal data and helps to reveal the true underlying health of the economy at any time of the year.

figure_1

B – Business capital spending. Part of “I,” business capital spending (capex), is what businesses spend on machinery, software, furniture, vehicles, computers, iPads, etc.  Businesses spent an annualized $1.2 trillion on equipment and software in the first quarter of 2013, accounting for 8% of GDP.  Business capital spending is very sensitive to economic conditions.  Business capital spending did not surpass its pre-Great Recession peak of $1.1 trillion until mid-2012. Market participants digest plenty of “input” data on business capital spending — Institute for Supply Management (ISM), durable goods orders and shipments, the regional Federal Reserve Bank manufacturing indices, reports from companies, truck sales, steel production, and rail car loadings — well ahead of the GDP report, but there is more information available to gauge consumer spending than there is to gauge business spending.

C – Consumption or consumer spending, on durable goods, non-durable goods, and services.  Consumption accounts for two-thirds of GDP. In the first quarter of 2013, consumers spent an annualized $9.7 trillion, adjusted for inflation. Consumption surpassed its pre-Great Recession peak of $9.3 trillion in early 2011. Of all the categories of GDP, consumption is the most visible to most consumers. We all spend money on various items every day. The data sets that provide input to the consumption portion of GDP — weekly retail sales, chain store sales, vehicle sales, etc. — is both robust and abundant. By the time GDP is released, most market participants have a pretty good sense of what this component of GDP is doing.

D – Durable goods. Consumer spending on durable goods (items designed to last more than three years), including microwave ovens, refrigerators, and color TVs. Consumers spent an annualized $1.4 trillion on durable goods in the first quarter of 2013. Spending on durable goods surpassed the pre-Great Recession peak of $1.2 trillion in early 2011. Consumer spending on durable goods represents 15% of total consumer spending, and is the category of consumer spending that is the most sensitive to overall economic conditions.

E F

GGovernment spending, including spending by the federal government and state and local governments. Governments spent an annualized $2.4 trillion in the first quarter of 2013, with the federal government spending just under $1 trillion and state and local governments spending $1.4 trillion.  Government spending peaked in 2009 and 2010 at around $2.6 trillion, and since then most of the drop in government spending has been on the state and local side. Overall government spending accounts for just under 18% of GDP. Plenty of data on federal government spending are available to market participants (Daily Treasury Statement, federal employment, etc.), but little timely information is available on state and local government spending prior to the release of the quarterly GDP data.

H – Housing, which in GDP parlance, is counted as residential investment, which is captured in the “I” of our equation. Housing is counted in GDP when a new home, or condo, or multifamily apartment or dorm room is built. Housing accounts for less than 3% of GDP, and at a spend rate of just under $400 billion in the first quarter of 2013, remains at half of its pre-Great Recession spending rate of close to $800 billion hit in 2005. Both the severity of the Great Recession — and it slackluster aftermath — can be traced back to the housing market. Plenty of timely data are available on the housing market each month: new and existing home sales, various home price metrics, data on construction and housing starts; all provide market participants with a good gauge of the housing market prior to the release of the GDP data.

I – Investment, and includes business spending on equipment and software (capital spending), on structures (factories, office parks, and malls), on inventories, and consumer spending on housing.

J K L

M – Shorthand for imports. Imports subtract from GDP because U.S. businesses and consumers send money overseas in exchange for goods and services.  On an annualized basis, the United States imported $2.3 trillion (annualized) of goods ($1.9 trillion) and services ($0.4 trillion) in the first quarter of 2013.

N – Nondurables. Consumer spending on nondurable goods (goods designed to last less than three years) include items like milk, motor fuel, magazines, and men’s clothing. Consumers spent an annualized $2.1 trillion on nondurable goods in the first quarter of 2013. Consumer spending on nondurable goods accounts for 21% of consumer spending, and this categoryof spending surpassed its pre-Great Recession peak in late 2010. Consumer spending on non-durables is less sensitive to economic conditions than spending on durable goods, but more sensitive than spending on services.

O P Q R

S – Services. Consumer spending on services (housing, haircuts, healthcare, hotels, etc.) is the largest category of consumer spending.  Consumers spent an annualized $6.2 trillion on services in the first quarter of 2013. Consumer spending on services surpassed its pre-Great Recession peak of $6.0 trillion in early 2011. Consumer spending on services represents 64% of consumer spending, and is the category of consumer spending that is least sensitive to overall economic conditions.

T U V W

X – Shorthand for exports. Exports add to GDP because the income received by U.S. businesses from overseas in exchange for the goods produced exceeds the cost to the economy of producing the goods. Inflation-adjusted exports ran at a $1.9 trillion annualized rate in the first quarter of 2013, and surpassed their pre-Great Recession high in late 2010. Exports consist of goods exports ($1.3 trillion) and service exports ($0.6 trillion). The United States is a net importer of goods (we import more than we export), e.g., cars, jet engines, and medical equipment.  However, we are a net exporter of services, such as legal services, consulting services, engineering services, and financial services.

Y Z

____________________________________________________________________________________________________________________________________

IMPORTANT DISCLOSURES

The opinions voiced in this material are for general information only and are not intended to provide specific advice or recommendations for any individual. To determine which investment(s) may be appropriate for you, consult your financial advisor prior to investing. All performance reference is historical and is no guarantee
of future results. All indices are unmanaged and cannot be invested into directly.

The economic forecasts set forth in the presentation may not develop as predicted and there can be no guarantee that strategies promoted will be successful.

Gross domestic product (GDP) is the monetary value of all the finished goods and services produced within a country’s borders in a specific time period, though GDP is usually calculated on an annual basis. It includes all of private and public consumption, government outlays, investments and exports less imports that occur
within a defined territory.

Stock investing involves risk including loss of principal.

____________________________________________________________________________________________________________________________________

INDEX DESCRIPTIONS

Challenger, Gray & Christmas is the oldest executive outplacement firm in the United States. The firm conducts regular surveys and issues reports on the state of the economy, employment, job-seeking, layoffs, and executive compensation.

The Consumer Price Index (CPI) is a measure of the average change over time in the prices paid by urban consumers for a market basket of consumer goods and services.

The Institute for Supply Management (ISM) index is based on surveys of more than 300 manufacturing firms by the Institute of Supply Management. The ISM Manufacturing Index monitors employment, production inventories, new orders, and supplier deliveries. A composite diffusion index is created that monitors conditions in national manufacturing based on the data from these surveys.

Purchasing Managers’ Index (PMI) is an indicator of the economic health of the manufacturing sector. The PMI index is based on five major indicators: new orders, inventory levels, production, supplier deliveries and the employment environment.

The Chicago Area Purchasing Manager Index that is read on a monthly basis to gauge how manufacturing activity is performing. This index is a true snapshot of how manufacturing and corresponding businesses are performing for a given month. A reading of 50 or above is considered a positive reading. Anything below 50 is considered to indicate a decline in activity. Readings of the index have the ability to shift the day’s trading session one way or another based on the results.

The S&P/Case-Shiller U.S. National Home Price Index measures the change in value of the U.S. residential housing market. The S&P/Case-Shiller U.S. National Home Price Index tracks the growth in value of real estate by following the purchase price and resale value of homes that have undergone a minimum of two arm’s-length transactions. The index is named for its creators, Karl Case and Robert Shiller.

____________________________________________________________________________________________________________________________________

This research material has been prepared by LPL Financial.

To the extent you are receiving investment advice from a separately registered independent investment advisor, please note that LPL Financial is not an affiliate of and makes no representation with respect to such entity.

Not FDIC/NCUA Insured | Not Bank/Credit Union Guaranteed | May Lose Value | Not Guaranteed by any Government Agency | Not a Bank/Credit Union Deposit

Member FINRA/SIPC